- EasyCard
- Trade
- Help
- Announcement
- Academy
- SWIFT Code
- Iban Number
- Referral
- Customer Service
- Blog
- Creator
Must-Read on Today's Market Movements: Hong Kong and China Stocks Never Move in Sync


Image Source: unsplash
Today’s market movements once again reflect the inconsistency between Hong Kong and China markets. The Hong Kong market plummeted by 2173 points in a single day, closing at 20927 points, hitting a historical low. Major Chinese indices, such as the Shanghai Composite Index, fell by 0.94%, the Shenzhen Component Index dropped by 0.85%, and the ChiNext Index declined by 1.18%.
| Index Name | Change | Closing Points |
|---|---|---|
| Shanghai Composite Index | -0.94% | 3348.37 points |
| Shenzhen Component Index | -0.85% | 10132.41 points |
| ChiNext Index | -1.18% | 2021.5 points |
| Hang Seng Index | -9.41% | 20927 points |
This lack of synchronization is actually quite common and worth exploring in depth to understand the underlying reasons.
Key Highlights
- Hong Kong and China stock markets often move out of sync, mainly due to differences in funding sources, policy environments, and investor structures.
- Hong Kong’s market has higher trading volumes and strong liquidity, attracting international and diverse funds, with better resilience to declines.
- The China market is dominated by local investors, with policies focused on industrial adjustments, making it more sensitive to news-driven volatility.
- Investors should diversify their asset allocations, combining Hong Kong stocks, Chinese A-shares, U.S. stocks, and bonds to reduce risk and enhance stability.
- Closely monitor market signals and technical indicators, flexibly adjusting portfolios to address the varying changes in both markets.
Today’s Market Movements Overview
Image Source: pexels
Hong Kong Market Performance
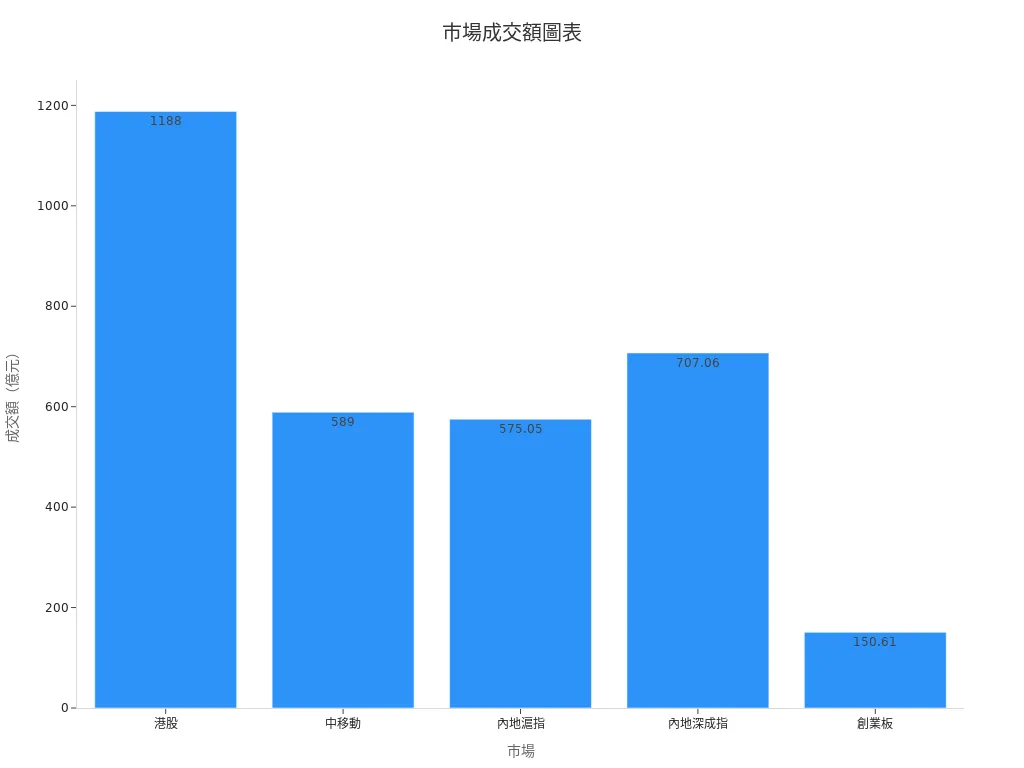
The Hang Seng Index closed at 20927 points today, down 2173 points in a single day, with a decline of 9.41%. Hong Kong’s trading volume reached approximately USD 118.8 billion (calculated at 1 USD = 7.8 HKD), indicating active market trading. Despite the significant drop, compared to major Chinese indices, Hong Kong’s market showed relative resilience.
Hong Kong’s trading volume today exceeded that of major Chinese markets, reflecting strong liquidity.
The table below summarizes today’s trading activity for Hong Kong and major stocks:
| Market | Trading Volume (USD billion) | Index Closing Points | Change in Points |
|---|---|---|---|
| Hong Kong | 1188 | 20927 | -2173 |
| China Mobile | 589 | 78.9 | -3.78% |
Mainland China Market Performance
Major Chinese indices also fell today, but the declines were milder than in Hong Kong. The Shanghai Composite Index closed at 3348.37 points, down 0.94%; the Shenzhen Component Index closed at 10132.41 points, down 0.85%; and the ChiNext Index closed at 2021.5 points, down 1.18%.
In terms of trading volume, the Shanghai Composite Index recorded about USD 57.505 billion, the Shenzhen Component Index about USD 70.706 billion, and the ChiNext Index about USD 15.061 billion.
Today’s market movements show that while the Chinese market declined, its liquidity was lower than Hong Kong’s, reflecting a more cautious investor sentiment.
| Index Name | Trading Volume (USD billion) | Closing Points | Change |
|---|---|---|---|
| Shanghai Composite Index | 575.05 | 3348.37 | -0.94% |
| Shenzhen Component Index | 707.06 | 10132.41 | -0.85% |
| ChiNext Index | 150.61 | 2021.5 | -1.18% |
Sector Divergence
Today’s market movements were not only reflected in broad market indices but also showed significant divergence in sector performance.
- Gold, coal, and non-ferrous metal sectors generally fell by about 1%.
- Some individual stocks in the gold sector rose against the trend, such as Ronghua Industry and Shandong Gold leading the gains, with Hengbang Shares and Chenzhou Mining also rising.
- Resource stocks performed weakly overall, dragging down market sentiment.
- The coal sector, a cyclical sector, has been underperforming recently, and investors are advised to reduce holdings when prices rise.
- Gold concept stocks were active in the short term, driving a brief market rebound, but overall sentiment remained weak, with noticeable index volatility.
Today’s market movements reflect divergent sector performances, and investors need to closely monitor market signals and flexibly adjust their portfolios.
Reasons for Lack of Synchronization
Fund Flows
Fund flows directly impact the performance of Hong Kong and China stock markets. Hong Kong’s trading volume primarily comes from Chinese companies and international funds. The Chinese market has shown signs of shrinking trading volume in recent years, reflecting fluctuating investor confidence.
As a gateway to China, Hong Kong attracts fund inflows from the Middle East and Russia. CSOP launched a Saudi Arabia ETF on the Hong Kong market, with assets under management exceeding USD 1 billion shortly after listing. China’s securities regulator approved cross-listing of this ETF by domestic companies, facilitating fund flows between the two markets.
Different fund flows create significant divergence between the two markets. Hong Kong’s diverse funding sources provide stronger resilience. In China, funds are mainly from local investors, and funds tend to flow out during uncertainty.
Policy News
Policy news directly affects both markets. The Hong Kong government actively promotes innovation, technology, and investment attraction initiatives, drawing funds and businesses to the city.
- The Hong Kong government allocated HKD 1 billion to establish an AI research institute, promoting AI technology development.
- About 70 government departments have participated in trials of AI large-scale model assistance systems, showing practical applications driven by policy.
- The Office for Attracting Strategic Enterprises, established in 2022, has attracted 66 key enterprises, boosting economic vitality.
- The number of foreign enterprises remains stable at 9000, reflecting policy support for foreign investor confidence.
- The talent admission scheme has approved over 270,000 applications, with about 180,000 talents arriving in Hong Kong, supporting industry growth.
- The Hong Kong SAR government actively promotes innovation, technology, and investment attraction initiatives, facilitating inflows of funds and investment institutions.
In China, policy news focuses on industrial adjustments and regulation. Market volatility increases during policy changes. Hong Kong’s policies are more open, attracting international funds. China’s policies prioritize stabilizing domestic demand and industrial upgrades, with greater short-term market volatility.
International Factors
International factors often affect the synchronization of Hong Kong and China stock markets. Hong Kong’s market is highly correlated with global markets, significantly influenced by U.S. interest rates, USD exchange rates, and geopolitical events. When the U.S. raises interest rates or the USD strengthens, international funds tend to flow out of emerging markets, pressuring Hong Kong.
The Chinese market is less affected by international factors, primarily driven by domestic economic conditions and policies. During global market volatility, Hong Kong reacts quickly, while China remains relatively stable. This difference often leads to unsynchronized “today’s market movements.”
Investor Structure
Investor structure is another key reason for the lack of synchronization between the two markets. Hong Kong’s investors are mainly institutional investors and international funds, with flexible operations and rapid responses. China’s market is dominated by retail investors, whose decisions are more influenced by emotions.
Hong Kong’s high proportion of institutional investors focuses on fundamental analysis during market volatility. China’s retail-heavy market is more susceptible to news-driven short-term volatility.
This structural difference means the two markets may react entirely differently to the same news.
Historical and Recent Examples
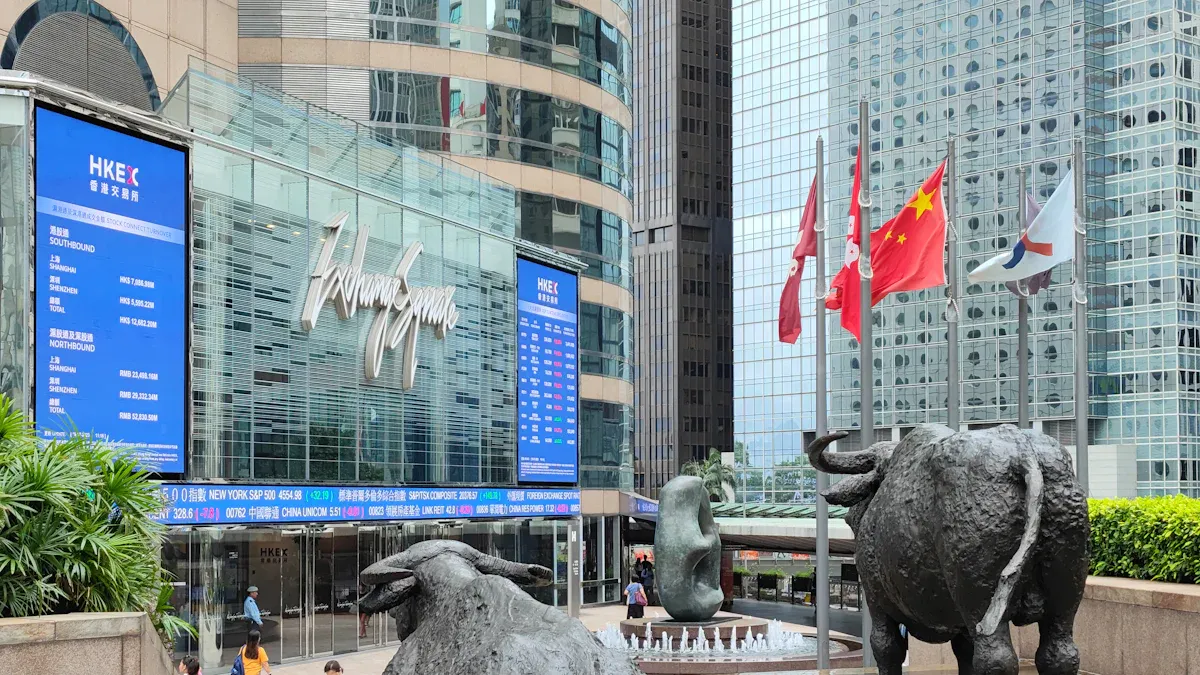
Image Source: unsplash
Historical Divergence
The divergence between Hong Kong and China markets is not new. In the past, the Hong Kong SAR government used statistical data to justify denying residency rights to mainland Chinese children of Hong Kong residents while expecting Chinese pregnant women to become “tourists” promoting Hong Kong’s fertility tourism. This policy contradiction reflects significant economic and social identity divergences between the two regions.
Hong Kong society has also shaped the image of mainland Chinese residents crossing into Hong Kong through popular culture and narratives. For example, the metaphor of “Bei Gu” highlights the complexity of Hong Kong-China relations. Hong Kong has shifted from dominating China’s capital markets to becoming a pursuer. These cases and data illustrate that the two markets have long been divided politically, economically, and socially, often leading to unsynchronized stock market performances.
Historically, policy, fund flows, and social identity recognition between Hong Kong and China have shown long-term divergence, profoundly affecting the trends of their stock markets.
Recent Developments
In recent years, the divergence between the two markets has become more pronounced.
- While both Chinese A-shares and Hong Kong stocks fell simultaneously, sector performances showed clear divergence.
- Defensive sectors in A-shares, such as pharmaceuticals and banking, performed strongly, with some bank stocks hitting historical highs, and the agriculture sector strengthened due to policy support.
- Emerging technology sectors like nuclear power, autonomous vehicles, and robotics faced heavy losses, weakening bullish sentiment.
- Hong Kong’s Hang Seng Index and Hang Seng Tech Index fell by over 1.5% and 2.5%, respectively, but fund activity remained strong, with the Hong Kong Monetary Authority’s base money balance surging and overnight HIBOR dropping to 0%.
- Southbound fund flows continued to show net inflows, IPO markets were active, and capital market sentiment warmed.
- International institutions hold divergent views, with Morgan Stanley favoring Hong Kong stocks and Goldman Sachs optimistic about A-shares driven by RMB appreciation.
These phenomena reflect significant divergences in liquidity, sector performance, and foreign sentiment, indicating structural differences and external influences that make unsynchronized stock market movements the norm.
Investment Strategies
Diversified Allocation
Diversified allocation is an effective way to reduce investment risk. Studies show that asset allocation accounts for up to 88% of investment outcomes. Different asset classes perform variably over time, and investors can hold Hong Kong stocks, Chinese A-shares, U.S. stocks, bonds, and gold simultaneously. This reduces the impact of single-market volatility on the overall portfolio. Diversified allocation includes strategic and tactical asset allocation. Strategic allocation maintains fixed proportions, suitable for long-term investors. Tactical allocation adjusts flexibly based on market changes, enhancing the ability to respond to sudden events. Investors should choose allocation methods based on their risk tolerance and investment goals.
Risk Management
- Risk management requires combining quantitative and qualitative methods. Common quantitative methods include Monte Carlo simulation, sensitivity analysis, and decision tree analysis, which rely on historical data to predict risks.
- In supply chain management, companies use risk matrices to prioritize high-risk projects, seek backup suppliers, or build safety stocks.
- Hong Kong banks and large enterprises use financial risk management platforms, leveraging global commercial credit databases and credit rating changes to detect client credit risks promptly.
- Regularly assessing and updating risk management strategies helps address market environment changes and reduce potential losses.
Market Signals
Investors should closely monitor market signals and flexibly adjust portfolios. Technical indicators like KD, RSI, MACD, Bollinger Bands, and Bias are supported by data and help judge market trends and buying/selling timing. Experts recommend combining multiple indicators for analysis to avoid misleading signals.
When analyzing Hong Kong and China markets, investors must consider them separately, not as a whole. The two markets differ in structure, fund flows, and policy environments, requiring tailored strategies to enhance portfolio stability and flexibility.
Today’s market movements once again highlight the divergence between Hong Kong and China markets.
- The Shanghai and Shenzhen markets surpassed USD 1 trillion in trading volume within 20 minutes of opening, setting a new record.
- The Shanghai Index closed up 4.59%, the Shenzhen Component Index rose 5.77%, and the ChiNext Index surged 10.98%.
- On the same day, Hong Kong’s Hang Seng Index fell over 4% intraday, and the Hang Seng Tech Index dropped over 6%.
Experts note that A-shares were closed for holidays while Hong Kong continued trading, making unsynchronized market movements the norm. Investors should analyze the two markets separately, stay vigilant, and flexibly adjust strategies.
FAQ
Why do Hong Kong and China stock markets often move out of sync?
Hong Kong’s funds are diverse, including international capital. China’s market is dominated by local funds. Differences in policies, investor structures, and international factors lead to frequent unsynchronized movements.
How should investors diversify risk?
Investors can allocate across Hong Kong stocks, Chinese A-shares, U.S. stocks, bonds, and gold. This reduces risks from single-market volatility.
What’s the difference in trading volumes between the two markets?
| Market | Trading Volume (USD billion) |
|---|---|
| Hong Kong | 1188 |
| Shanghai | 575.05 |
| Shenzhen | 707.06 |
Hong Kong has higher trading volumes and stronger liquidity.
What international factors affect Hong Kong’s market?
U.S. interest rates, USD exchange rates, and geopolitical events impact Hong Kong. China’s market is mainly influenced by domestic economics and policies.
What are technical indicators used for?
Indicators like RSI, MACD, and Bollinger Bands help investors judge market trends. Combining multiple indicators improves analysis accuracy.
The divergence between Hong Kong and China’s markets highlights differing capital flows, policies, and global influences, requiring agile investment strategies. BiyaPay simplifies fund management, enabling US and Hong Kong stock investments without extra overseas accounts—start now at BiyaPay! With transfer fees as low as 0.5% and coverage across 190+ countries, it meets global investment needs. Real-time exchange rate queries enhance USD-HKD tracking, complementing economic calendar monitoring.
Its 5.48% annualized yield wealth product offers flexible withdrawals to navigate volatility. Regulated internationally, it ensures secure transactions. Visit BiyaPay today to optimize your investment strategy!
*This article is provided for general information purposes and does not constitute legal, tax or other professional advice from BiyaPay or its subsidiaries and its affiliates, and it is not intended as a substitute for obtaining advice from a financial advisor or any other professional.
We make no representations, warranties or warranties, express or implied, as to the accuracy, completeness or timeliness of the contents of this publication.


Contact Us
Company and Team
BiyaPay Products
Customer Services


is a broker-dealer registered with the U.S. Securities and Exchange Commission (SEC) (No.: 802-127417), member of the Financial Industry Regulatory Authority (FINRA) (CRD: 325027), member of the Securities Investor Protection Corporation (SIPC), and regulated by FINRA and SEC.
registered with the US Financial Crimes Enforcement Network (FinCEN), as a Money Services Business (MSB), registration number: 31000218637349, and regulated by FinCEN.
registered as Financial Service Provider (FSP number: FSP1007221) in New Zealand, and is a member of the Financial Dispute Resolution Scheme, a New Zealand independent dispute resolution service provider.