- EasyCard
- Trade
- Help
- Announcement
- Academy
- SWIFT Code
- Iban Number
- Referral
- Customer Service
- Blog
- Creator
Observations on the Dow Jones Futures Market Amid U.S. Economic Policy Changes


Image Source: unsplash
Every adjustment in U.S. economic policy is quickly reflected in the Dow Jones futures market. For instance, after Trump implemented a 25% tariff on Colombian goods, the market immediately experienced significant volatility, with the index dropping over 200 points. The U.S. dollar index fluctuated around 104.28, risk aversion intensified, leading to a sharp depreciation of emerging market currencies like the Mexican peso. In 2025, geopolitical situations, tariff policies, and dollar trends are expected to remain key focuses for investors. Investors should closely monitor these signals to seize market opportunities.
Key Points
- Adjustments in U.S. economic policy quickly impact the Dow Jones futures market, and investors should closely monitor policy changes and geopolitical risks.
- In 2025, interest rates, tariffs, and regulatory policies will be the main drivers of market volatility, affecting corporate earnings and capital flows.
- The Dow Jones futures market has high liquidity and long trading hours, allowing Asia-Pacific investors to flexibly participate and use technical indicators to determine entry timing.
- Investors should adopt diversified and low-volatility strategies, combined with risk management tools like stress testing and stop-loss points, to enhance resilience.
- Continuously tracking economic data and policy signals, and flexibly adjusting long and short positions, helps seize market opportunities and reduce losses.
Policy Changes and Market Volatility
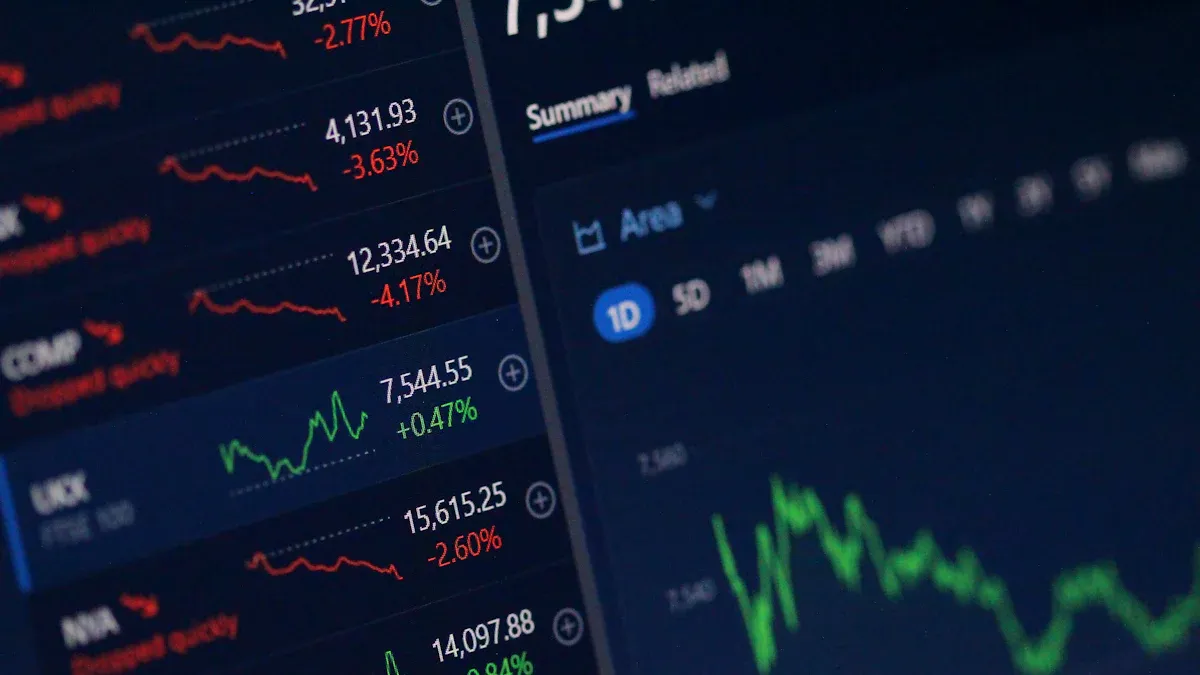
Image Source: unsplash
Market Sentiment
Every adjustment in U.S. economic policy directly affects market sentiment. When the Federal Reserve announces rate hikes, investors typically become cautious, and capital flows toward safe-haven assets. Tax cuts, on the other hand, boost expectations for corporate earnings, driving stock market gains. After Trump introduced a new round of tariff policies, U.S. stocks lost approximately $5 trillion in market value over two days, with the S&P 500 plunging over 10%, and the Dow Jones futures also saw significant declines. These data reflect the market’s negative reaction and pessimistic sentiment toward tariff policies. Experts point out that after the end of a bull market, short-term rebounds may occur, but they are unlikely to sustain, with market sentiment leaning pessimistic and volatility increasing.
Investors are generally concerned that trade retaliation measures will further impact corporate confidence and global supply chains, increasing market uncertainty. Moody’s report also indicates that Trump’s tariffs could lead to stagflation in the U.S. economy, prompting the Federal Reserve to raise rates, similar to the Volcker era in the 1980s. OCBC Bank analysis suggests that ongoing trade wars and tariffs will exacerbate U.S. stock market volatility, push up inflation, and reduce the likelihood of rate cuts.
Historical Review
Looking back, policy changes have often triggered sharp market volatility in the short term. According to the three-cycle theory, economic cycles are divided into six phases, and policy changes influence asset prices through liquidity and risk appetite. Stocks perform poorly during stagflation and early recession phases due to policy tightening, which makes investors pessimistic. In late recession phases, policy easing increases liquidity, and the stock market begins to recover. The bond market performs well in early recession phases as inflation and economic growth decline, reducing risk appetite. Geopolitical events, such as U.S.-China tensions and the Russia-Ukraine conflict, also cause significant short-term market fluctuations, impacting exports, commodities, and high-tech industries.
In 2025, escalating tensions between Israel and Iran, combined with Trump’s new tariff policies, immediately reflected heightened risk aversion in the market. Short-term market volatility is significantly influenced by policy factors, and policy changes can quickly manifest in market prices like the Dow Jones futures through liquidity and risk appetite mechanisms.
2025 Policy Focus
Interest Rates and Fiscal Policy
In 2025, the Federal Reserve’s interest rate policy remains a central focus for the market. Fed officials have repeatedly emphasized that rate adjustments will depend on inflation data and labor market performance. If inflation remains high, the Fed may maintain high interest rates, increasing corporate borrowing costs and suppressing investment appetite. Tax cuts and infrastructure policies are expected to stimulate economic growth. Trump’s 2.0 policy emphasizes large-scale tax cuts and infrastructure investment, expected to boost corporate earnings but may also widen the fiscal deficit. The dollar’s trend is also influenced by interest rate policies; when the dollar is strong, capital flows to U.S. assets, supporting the Dow Jones futures. During tense Middle East situations, safe-haven capital flows into the dollar, further pushing up the dollar index.
Tariffs and Trade
Trump has proposed a new round of comprehensive tariff policies, imposing high tariffs on China and other major trading partners. These measures have raised the average U.S. tariff rate to a near-century high, triggering intense market reactions. The S&P 500 index fell 17.1%, gold prices rose 10.3%, and cryptocurrencies like Bitcoin and Ethereum saw significant declines, indicating high market sensitivity to policy changes. The U.S. trade deficit with China has narrowed, but deficits with Southeast Asia and North American neighbors have increased, reflecting a reshaping of trade structures. A New York Fed report notes that about three-quarters of companies have adjusted prices to reflect tariff pressures, and prices of non-tariff-affected goods have also risen, with inflationary pressures spreading across the market. Companies face uncertainty about future tariff trends, making operational decisions more challenging.
Regulatory Adjustments
In 2025, the U.S. government has strengthened regulations on the technology, financial, and energy sectors. New regulatory measures require companies to enhance transparency, strengthen data protection, and improve risk management for financial institutions. These policies help boost market confidence but also increase compliance costs for companies. Some companies adjust business strategies in response to regulatory pressures, reducing high-risk investments. Regulatory adjustments also affect the volatility of the Dow Jones futures, and investors need to closely monitor policy details and flexibly adjust their portfolios.
Dow Jones Futures Market Dynamics
Image Source: unsplash
Price Volatility
In 2025, price volatility in the Dow Jones futures market has significantly increased. After Israel’s airstrike on Iran, global stock markets experienced sharp fluctuations, with the Dow Jones index dropping over 760 points in a single day. This event highlights the direct impact of geopolitical risks on the market. Key policy events, such as the Federal Open Market Committee (FOMC) interest rate decisions and U.S. quadruple witching days, also act as catalysts for market volatility.
Investors generally focus on economic data like the Producer Price Index (PPI), with market sentiment leaning cautious. On a Thursday in June, Dow Jones futures fell 0.5%, in sync with declines in S&P 500 futures and Nasdaq 100 futures. This reflects trade policy uncertainty, geopolitical conflicts, and fluctuations in U.S. Treasury yields, all of which exacerbate market unease.
Although short-term volatility is evident, the technical structure remains bullish. Investors should closely monitor policy and geopolitical events and adjust strategies based on market changes.
Tip: Major policy events like FOMC meetings and quadruple witching days often amplify market volatility, and investors can use an economic calendar to plan ahead.
Liquidity
The Dow Jones futures market is known for its high liquidity. E-mini Dow Jones futures contracts see massive daily trading volumes, attracting participation from global institutions and individual investors. Market makers play a critical role, continuously providing quotes and ensuring two-sided liquidity, allowing investors to trade close to market prices.
High liquidity helps reduce bid-ask spreads and minimizes slippage risks. Even during major policy or geopolitical events, the market remains stable.
The table below shows the main liquidity characteristics of E-mini Dow Jones futures:
| Feature | Description |
|---|---|
| Trading Volume | Hundreds of thousands of contracts daily, with high global participation |
| Market Maker Role | Provides continuous quotes, maintaining market depth |
| Bid-Ask Spread | Typically kept at very low levels, with low transaction costs |
| Trading Hours | Nearly 24-hour operation, covering major global time zones |
Investors can leverage high liquidity to flexibly adjust positions and respond to sudden market changes.
Asia-Pacific Trading
The participation of Asia-Pacific investors in the Dow Jones futures market has been increasing year by year. Due to the nearly 24-hour trading of E-mini futures contracts, investors in Hong Kong, Singapore, Japan, and other regions can flexibly enter and exit the market during local time zones.
The Asia-Pacific session often sees heightened volatility before and after major U.S. economic data releases. Some Hong Kong banks and brokers have launched professional trading platforms supporting overnight trading and real-time risk management.
Asia-Pacific investors tend to use futures to hedge U.S. stock positions or capture short-term volatility opportunities. With frequent policy and geopolitical events, the reaction speed and participation depth of the Asia-Pacific market have become important indicators of global capital flows.
Note: While liquidity is high during Asia-Pacific sessions, volatility may increase during U.S. holidays or major events, requiring investors to strengthen risk controls.
Technical and Fundamental Observations
Technical Indicators
In the volatile market of 2025, technical analysis tools are critical for investors to judge Dow Jones futures trends. Common technical indicators include:
- Trend Lines: Connecting multiple highs and lows, support and resistance levels tested multiple times are more reliable.
- Trading Volume: When prices break through trend lines, a surge in trading volume makes the breakout signal more reliable.
- Moving Average Alignment: A bullish alignment indicates strong support.
- RSI Indicator: An RSI above 50 suggests a stable uptrend.
- Multi-Indicator Convergence: Combining candlestick patterns, MACD, KDJ, and other indicators improves judgment accuracy.
- Retracement Rule: 33%, 50%, 63%, 75% retracement levels are commonly used to predict support and resistance levels.
Professional analysts suggest that investors combine multi-angle technical indicators and set reasonable stop-loss points to enhance operational safety.
Open Interest
Open Interest reflects the total number of outstanding contracts in the market. This data indicates capital inflows or outflows. Trading volume represents the total number of contracts traded in a day, reflecting market activity. The two are usually positively correlated but not identical. When open interest continues to rise, it indicates capital inflows, suggesting a trend may persist. A decrease in open interest indicates capital outflows, signaling potential consolidation or reversal. Investors can observe changes in open interest from major players (e.g., foreign investors, mutual funds, proprietary traders) to gauge bullish or bearish forces and improve their grasp of Dow Jones futures trends.
Forward Curve
The forward curve is an important tool for observing the futures market structure. When the forward curve shows a contango (where far-month contract prices are higher than near-month contracts), it typically reflects market expectations of rising future prices. Conversely, a backwardation indicates expectations of falling prices. Investors can use the forward curve to gauge market sentiment and capital flows, adjusting their position strategies. Hong Kong banks and brokers often use forward curve analysis to help clients develop more precise risk management plans.
Investment Strategies and Risks
Long and Short Strategies
When facing policy uncertainty and geopolitical risks, investors should flexibly adjust long and short strategies. When markets expect rising interest rates or increased tariffs, investors may consider short-term bearish operations, reducing holdings in high-volatility assets. If policies shift toward easing or market sentiment warms, investors can gradually increase long positions.
Low-volatility strategies have gained more attention in recent years. Investors choosing stocks or assets with lower price volatility can effectively reduce downside risks from sharp market fluctuations. According to market data, during the significant tech stock decline in 2024, low-volatility strategies helped mitigate losses and enhance portfolio stability.
Additionally, asset allocation should be diversified. Some investors prefer short- to medium-term U.S. Treasuries, which have lower risks and can avoid policy noise, improving overall resilience.
Risk Management
Professional investors use various risk management tools to address external shocks. Common measures include:
- Stress Testing: Regularly simulate potential losses from major events to assess financial strength.
- Backtesting: Compare actual results with risk predictions to verify model accuracy.
- Risk Limits: Set maximum risk exposure for each asset class and regularly review.
- Sensitivity Analysis: Assess the impact of changes in interest rates, exchange rates, and other factors on asset values.
- Credit Risk Quantification: Use expected credit loss models to simulate the impact of credit changes on portfolios.
Experts recommend that investors continuously monitor risk exposure and adjust strategies promptly based on market changes. These statistical methods effectively validate the effectiveness of risk management measures under policy uncertainty.
Recommendations
Facing policy and geopolitical risks in 2025, investors can refer to the following recommendations:
- Regularly review portfolios to enhance asset allocation flexibility and resilience.
- Adopt low-volatility strategies, focusing on assets with lower volatility to reduce the impact of sharp market fluctuations.
- Monitor the U.S. Treasury market and appropriately allocate to short- to medium-term bonds to avoid the high volatility of long-term bonds.
- Use Value at Risk (VaR) and other quantitative tools to assess potential losses and set reasonable stop-loss points.
- Closely track policy signals and geopolitical developments, flexibly adjusting long and short positions.
These strategies help investors enhance their adaptability to markets like the Dow Jones futures and reduce losses from external risks.
The Dow Jones futures market is influenced by multiple factors, including policy changes, geopolitical risks, and dollar exchange rate fluctuations.
- Tariff policy adjustments, trade negotiations, and Fed interest rate decisions alter market expectations.
- Global political instability, dollar trends, and U.S. Treasury yield fluctuations affect capital flows.
- Key economic indicators like PPI, GDP growth rate, and employment data reflect market health.
Investors should continuously track these data, flexibly use technical and fundamental indicators, and adjust risk management measures as needed.
FAQ
What is the difference between Dow Jones futures and spot markets?
Dow Jones futures are derivative products, allowing investors to predict the future direction of the index. Spot markets involve immediate stock trading. Futures can be used for hedging or leveraged operations.
How do U.S. policy changes immediately affect the Dow Jones futures?
Policies like rate hikes, tax cuts, or tariff adjustments immediately impact market sentiment. Investors often see short-term index fluctuations, with capital flowing to safe-haven assets or the dollar.
How can investors use technical indicators to determine entry timing?
Investors can refer to RSI, moving averages, and trading volume indicators. When multiple indicators signal simultaneously, entry timing becomes clearer.
What advantages do Asia-Pacific investors have in participating in Dow Jones futures?
Asia-Pacific investors can leverage nearly 24-hour trading sessions to flexibly adjust positions. Hong Kong banks and brokers also provide overnight trading and real-time risk management services.
How should investors manage risks amid policy uncertainty?
Investors can regularly review portfolios, set stop-loss points, and use stress testing and risk limits. Diversified asset allocation helps reduce risks from single market fluctuations.
The Dow Jones futures market in 2025 faces heightened volatility (down over 760 points daily), driven by U.S. tariffs, interest rate policies, and geopolitical risks, demanding agility from Asia-Pacific investors. BiyaPay streamlines fund management, enabling investments in U.S. stocks and Hong Kong stocks without extra overseas accounts—start now at BiyaPay! With transfer fees as low as 0.5% and coverage across 190+ countries, it meets global trading needs.
Real-time exchange rate queries enhance USD-HKD tracking, complemented by economic calendar monitoring for PPI and FOMC updates. Its 5.48% annualized yield wealth product offers flexible withdrawals for liquidity. Regulated internationally, it ensures secure transactions. Visit BiyaPay today to refine your investment approach!
*This article is provided for general information purposes and does not constitute legal, tax or other professional advice from BiyaPay or its subsidiaries and its affiliates, and it is not intended as a substitute for obtaining advice from a financial advisor or any other professional.
We make no representations, warranties or warranties, express or implied, as to the accuracy, completeness or timeliness of the contents of this publication.


Contact Us
Company and Team
BiyaPay Products
Customer Services


is a broker-dealer registered with the U.S. Securities and Exchange Commission (SEC) (No.: 802-127417), member of the Financial Industry Regulatory Authority (FINRA) (CRD: 325027), member of the Securities Investor Protection Corporation (SIPC), and regulated by FINRA and SEC.
registered with the US Financial Crimes Enforcement Network (FinCEN), as a Money Services Business (MSB), registration number: 31000218637349, and regulated by FinCEN.
registered as Financial Service Provider (FSP number: FSP1007221) in New Zealand, and is a member of the Financial Dispute Resolution Scheme, a New Zealand independent dispute resolution service provider.