- EasyCard
- Trade
- Help
- Announcement
- Academy
- SWIFT Code
- Iban Number
- Referral
- Customer Service
- Blog
- Creator
Hang Seng Index Futures Market Sentiment and Trading Data


Image Source: pexels
The Hang Seng Index futures market has recently shown volatility. Investors are focusing on geopolitical tensions, the latest developments in China-U.S. trade negotiations, and regulatory news impacting technology stocks. The latest contract data, such as opening price, range, and trading volume, reflect a cautious market sentiment. Some funds are staying on the sidelines, and the number of open interest contracts has also fluctuated. Professional analysts believe that the market will remain influenced by multiple factors in the short term.
Key Points
- The Hang Seng Index futures market sentiment is affected by China-U.S. trade negotiations, geopolitical issues, and regulatory news, requiring investors to closely monitor these changes.
- Trading volume and open interest data are key indicators for assessing market momentum and bullish-bearish forces, aiding investors in making more informed trading decisions.
- Technology stocks have performed strongly recently, driven by favorable regulatory developments, but real estate and financial sectors face pressure, requiring investors to flexibly adjust their portfolio structures.
- Technical analysis shows key support and resistance levels for Hang Seng Index futures, and investors should combine candlestick patterns and trading volume to judge trends and set stop-loss levels.
- Experts recommend that investors focus on economic data and global developments, flexibly adjust strategies, and avoid relying solely on single signals for trading decisions.
Market Sentiment

Image Source: pexels
Dominant Factors
- The U.S. and China reached a 90-day trade war ceasefire agreement, significantly lowering tariffs, exceeding market expectations, and boosting risk appetite in both Hang Seng Index futures and spot markets.
- The Hong Kong Hang Seng Index closed up 2.98% on the day, with the Hang Seng Tech Index rising 5.16%, reflecting investor optimism toward technology stocks.
- Safe-haven assets like gold, U.S. Treasuries, and the Japanese yen saw price declines, indicating funds flowing toward risk assets, with the U.S. Dollar Index (DXY) rising over 1%, and USD/JPY and USD/CHF exchange rates appreciating, showing clear fund flows into USD assets.
- U.S. 10-year Treasury yields rose, with prices falling, signaling increased market confidence in economic prospects.
- Hong Kong stocks rose due to optimism about China’s economic outlook, with the Hang Seng Index hitting a three-year high, and the Hang Seng Index futures market sentiment remaining positive.
- The U.S.’s new tariff policy has raised market caution, but Chinese assets are attracting more international investors, with the Hang Seng Index up 23% year-to-date, making it the best-performing major market globally.
- On June 12, the total open interest for Hang Seng Index futures spot month contracts was 129,689, down 2,331 from the previous day, indicating some investors reducing positions and a cautious market sentiment.
- Recent tensions in the Middle East have heightened safe-haven sentiment, causing declines in Hang Seng Index futures and spot prices, with the Hang Seng Tech Index falling 2.1%.
Expert Opinions
Experts generally believe that Hang Seng Index futures market sentiment is influenced by multiple factors. Some analysts point out that whether the Federal Reserve cuts rates will directly impact the USD’s trend, affecting the attractiveness of USD-denominated assets. They recommend investors closely monitor economic indicators like inflation, employment data, GDP growth, and consumer spending, as these directly affect market sentiment.
Sentiment analysis techniques also help experts understand fluctuations in market participants’ emotions, combined with macroeconomic policy interpretations, further explaining the drivers of Hang Seng Index futures market sentiment changes.
According to recent news, expert Wing-Kim Tsang stated that heightened Middle East tensions are increasing safe-haven sentiment, putting short-term pressure on Hong Kong stocks, lacking strong catalysts, with insufficient foreign capital inflows and technical indicators brewing downward adjustment pressure, shifting overall market sentiment from optimism to caution or even pessimism.
Additionally, fluctuations in total and net open interest over the past week reflect adjustments in bullish and bearish forces, with investors adopting a wait-and-see attitude toward future trends. Experts suggest investors continue monitoring global developments and regulatory news, flexibly adjusting Hang Seng Index futures investment strategies.
Hang Seng Index Futures Trading Data
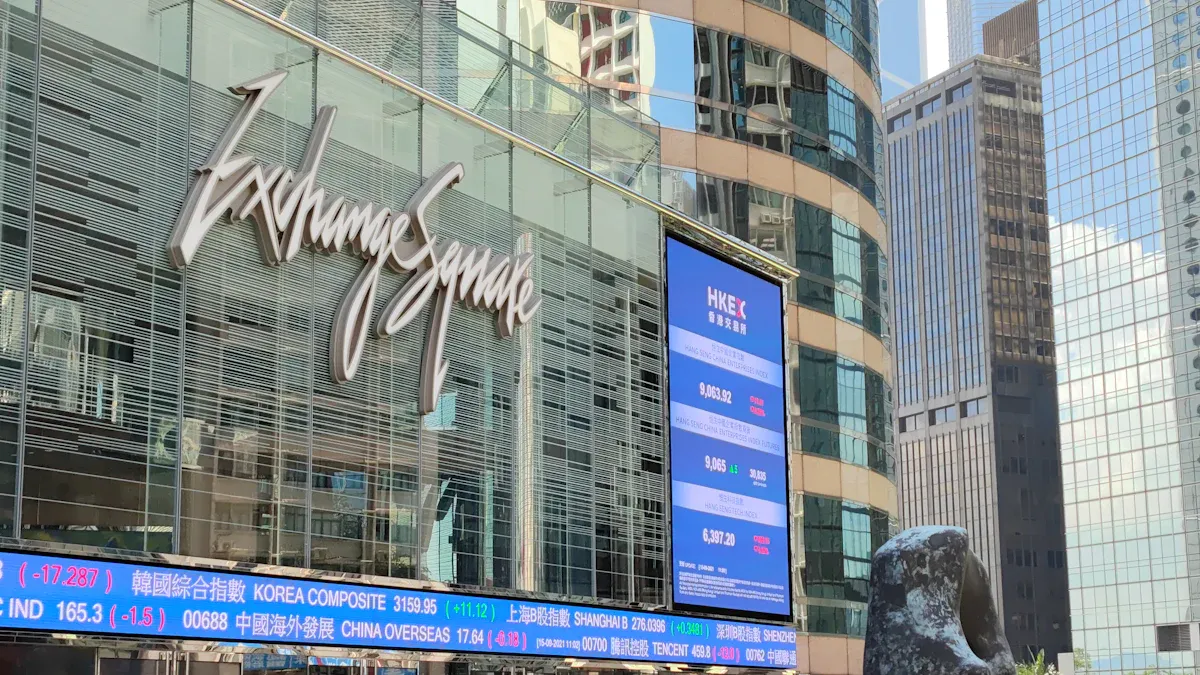
Image Source: unsplash
Real-Time Market Data
The Hang Seng Index futures market has been active recently. The latest contract opened at 23,800 points, up 120 points from the previous trading day. The intraday range reached 350 points, indicating a significant increase in market volatility.
Investors commonly use real-time market data to observe the relationship between market fluctuations and trading volume. In the Fear and Greed Index, volatility and trading volume each account for 25% of the weighting, reflecting their importance in gauging market sentiment.
Real-time market data shows that when prices rise with increasing trading volume, the market trend tends to persist. Conversely, if prices rise but trading volume decreases, it may signal an impending trend reversal.
Investors can combine real-time market data with trading volume and price trends to assess market conditions, improving the accuracy of trading decisions.
Trading Volume and Open Interest
Trading volume is a key indicator of market activity and liquidity. The total trading volume for Hang Seng Index futures in the past trading day reached 145,000 contracts, a 12% increase from the same period last week. Increased trading volume indicates strong market momentum, with more buyers and sellers willing to transact, significantly boosting market activity.
Open interest data reflects the distribution of bullish and bearish positions in the market. On June 12, the total open interest for Hang Seng Index futures spot month contracts was 129,689, down 2,331 from the previous day. This change suggests some investors are reducing positions, with market sentiment trending cautious.
OANDA’s open interest data divides bullish and bearish positions into four quadrants, representing long positions at highs, profitable shorts, losing shorts, and long positions at lows. These quadrants reflect market participants’ psychology and potential price pressures. For example, long positions at highs may trigger selling pressure, while losing short positions may drive price increases due to stop-losses.
By combining trading volume and open interest data, investors can more accurately assess market momentum, price turning points, and bullish-bearish force comparisons, enabling wiser trading decisions.
Experts recommend that investors closely monitor changes in trading volume and open interest to capture market trend reversals and potential risks.
Popular Stocks
In the recent Hang Seng Index futures market, technology stocks have performed prominently. Tencent Holdings (0700.HK) rose 4.2% in a single day, with trading volume exceeding 25 million shares, becoming the market’s leading gainer. Alibaba (9988.HK) also recorded a 3.8% increase, with significantly higher trading volume. These tech giants benefited from favorable policy signals from Chinese regulators, with market expectations of further profit growth.
On the other hand, real estate and financial sectors underperformed. Hang Seng Properties (0012.HK) fell 2.1%, mainly due to U.S. rate hike expectations and tightened local real estate policies. HSBC Holdings (0005.HK) also saw a 1.5% decline, with markets concerned about stricter global banking regulations.
Regulators recently introduced several new measures, including tighter oversight of tech companies’ data compliance, which has pressured some tech stocks’ short-term performance. However, in the long term, the market generally believes that regulatory policies will improve corporate governance and boost international investor confidence.
| Stock Name | Change (%) | Trading Volume (Million Shares) | Main Influencing Factors |
|---|---|---|---|
| Tencent Holdings | +4.2 | 25.0 | Favorable Tech Regulations |
| Alibaba | +3.8 | 19.0 | Upgraded Profit Expectations |
| Hang Seng Properties | -2.1 | 3.2 | Tightened Real Estate Policies |
| HSBC Holdings | -1.5 | 8.5 | Stricter Banking Regulations |
Investors should closely monitor the impact of new regulatory measures on popular stocks and flexibly adjust portfolio structures to address market volatility.
Technical Analysis
Candlestick Patterns
Several distinct candlestick patterns have emerged recently. Analysts noted that Hang Seng Index futures repeatedly showed long upper shadows in the 23,800 to 24,000 range, indicating significant selling pressure at highs. On the daily chart, three consecutive days of “doji” and “engulfing patterns” reflect intense bullish-bearish struggles.
Some technical analysts point out that if reversal patterns like “evening star” or “dark cloud cover” appear, short-term correction pressure may arise. Forum users generally believe that if the closing price falls below 23,500 points in the next two days, the market may probe lower levels.
Experts recommend that investors closely monitor changes in candlestick patterns and combine trading volume to assess trend strength, avoiding trading decisions based solely on single signals.
Support and Resistance
The 23,000-point level has become a key support level recently. Analysts observed that Hang Seng Index futures tested this level multiple times over the past week but were supported by buying interest. If it breaks below 23,000, the next support level is expected at 22,700.
On the resistance side, 24,000 points is the main pressure zone. The market has attempted to break through multiple times but failed to hold. Technical indicators like RSI (Relative Strength Index) are currently at 52, indicating a neutral-to-strong market state. MACD (Moving Average Convergence Divergence) shows a bearish divergence signal, with some experts suggesting short-term pullback risks.
Several forum participants noted that if Hang Seng Index futures hold above 23,000 with increased volume, it could challenge 24,500 points. Otherwise, the market may retreat further, and investors should set stop-loss levels.
The Hang Seng Index futures market sentiment has been influenced by multiple factors recently. KGI Securities’ report indicates that chip tracking and technical indicator changes reflect adjustments in bullish and bearish forces. In the short term, Hang Seng Index futures may oscillate between 22,500 and 23,000 points. Weak U.S. economic data and RMB exchange rate volatility increase investment risks. Investors should closely monitor policy signals and fund flows, flexibly adjusting strategies.
FAQ
What’s the Difference Between Hang Seng Index Futures and Spot?
Hang Seng Index futures are derivative products, allowing investors to predict future index movements. Spot refers to the immediate buying and selling of Hang Seng Index constituent stocks.
How to Interpret Open Interest Data?
Open interest data reflects bullish and bearish forces in the market. An increase in open interest indicates market activity, while a decrease suggests investors are reducing positions, with sentiment turning cautious.
What Are Common Support and Resistance Levels in Technical Analysis?
Support levels are where prices tend to find buying interest during declines. Resistance levels are where prices face selling pressure during rises.
How Do Regulatory News Impact Hang Seng Index Futures?
Regulatory news affects market confidence. Favorable policies can drive index rises, while tightened regulations may increase short-term market volatility.
What Are the Main Risks of Investing in Hang Seng Index Futures?
Hang Seng Index futures are highly volatile. The market is influenced by global developments, policy changes, and USD exchange rates, requiring investors to set stop-loss levels.
Navigating the volatile Hang Seng Index futures market demands agility amid geopolitical and regulatory shifts, but are complex overseas account setups and hefty transfer fees slowing you down? BiyaPay simplifies your strategy! Trade US and Hong Kong stocks, including Hang Seng Index-linked ETFs, directly on the platform without offshore accounts. Access a 5.48% annualized yield savings product with flexible withdrawals for optimal liquidity.
Real-time exchange rate tracking supports conversions between USD, HKD, and over 30 fiat currencies with USDT, while remittances to 190+ countries start at just 0.5% in fees. Join BiyaPay now to streamline your global investments securely!
*This article is provided for general information purposes and does not constitute legal, tax or other professional advice from BiyaPay or its subsidiaries and its affiliates, and it is not intended as a substitute for obtaining advice from a financial advisor or any other professional.
We make no representations, warranties or warranties, express or implied, as to the accuracy, completeness or timeliness of the contents of this publication.


Contact Us
Company and Team
BiyaPay Products
Customer Services


is a broker-dealer registered with the U.S. Securities and Exchange Commission (SEC) (No.: 802-127417), member of the Financial Industry Regulatory Authority (FINRA) (CRD: 325027), member of the Securities Investor Protection Corporation (SIPC), and regulated by FINRA and SEC.
registered with the US Financial Crimes Enforcement Network (FinCEN), as a Money Services Business (MSB), registration number: 31000218637349, and regulated by FinCEN.
registered as Financial Service Provider (FSP number: FSP1007221) in New Zealand, and is a member of the Financial Dispute Resolution Scheme, a New Zealand independent dispute resolution service provider.