- EasyCard
- Trade
- Help
- Announcement
- Academy
- SWIFT Code
- Iban Number
- Referral
- Customer Service
- Blog
- Creator
2025 NASDAQ Index Latest Technical Analysis and Trading Strategies


Image Source: pexels
You may be concerned about the future trends of the NASDAQ index in 2025. Current technical indicators suggest that the NASDAQ index is likely to maintain strong upward momentum but is approaching a significant resistance zone. You should make good use of various technical indicators to seize trading opportunities while strictly managing risks. Please note that investing involves risks, and all content is for reference only.
Key Points
- The NASDAQ index is primarily composed of U.S. tech stocks, influenced by macroeconomic factors such as inflation, labor market, U.S. Treasury yields, and USD exchange rates, which investors should closely monitor.
- Using multiple technical indicators like candlestick patterns, moving averages, RSI, MACD, and Bollinger Bands can effectively identify NASDAQ index trends and trading opportunities, improving win rates.
- Trading strategies include trend-following, breakout, range trading, and quantitative trading; investors should flexibly choose based on market conditions and personal risk tolerance.
- Strictly implementing stop-loss and take-profit, using leverage rationally, and maintaining good emotions and trading discipline are key to stable profits.
- Continuous learning and reviewing trading operations, avoiding blindly following trends, are essential to seize opportunities and achieve long-term stable returns in a fast-changing market.
Market Environment
NASDAQ Characteristics
You need to understand the uniqueness of the NASDAQ index. The NASDAQ index is primarily composed of U.S. tech stocks, including many globally leading AI and innovative companies. This index reflects the development pace of the tech industry and market confidence in future technology. The NASDAQ index is highly volatile, easily influenced by market sentiment, policy news, and corporate earnings reports. You will find that the NASDAQ index is particularly sensitive to macroeconomic data, especially the following:
- Inflation data (e.g., CPI, PPI): Reflects price changes, affecting consumption and corporate costs.
- Labor market data: Employment conditions and unemployment claims, indicating economic vitality.
- U.S. Treasury yields: Indicator of fund flows and market risk appetite.
- USD exchange rate: Affects multinational companies’ profits and tech stock performance.
- Tariff policies and trade agreements: Directly impact tech companies’ international operations.
- Corporate earnings outlook and consumer confidence: Collectively reflect market momentum.
The NASDAQ index’s performance is closely tied to tech stocks and AI companies’ development. You should closely monitor these macroeconomic data, as they affect the index’s short- and medium-term trends.
2025 Trends
Looking ahead to 2025, you will see that the NASDAQ index is likely to continue its past strength but faces multiple challenges. U.S. inflation pressure is gradually easing, with CPI and PPI data showing slowing price growth. The labor market remains robust, but unemployment claims have slightly increased, suggesting economic growth may slow. U.S. 10-year Treasury yields continue to decline, with strong demand for 30-year bonds, reflecting a preference for risk assets, supporting tech stocks.
A weaker USD against other major currencies benefits U.S. tech companies’ international revenue. Market reactions to tariff policies and trade agreements will continue to influence short-term NASDAQ index fluctuations. You should pay attention to corporate earnings outlooks and consumer confidence, as these factors will determine tech stock momentum.
- You can refer to the following trends:
- Easing inflation pressure benefits tech stock valuations.
- Robust labor market but beware of slowing risks.
- Weak USD and low-rate environment facilitate fund flows into tech sectors.
- Tariff and trade policy changes may cause short-term volatility.
You should closely monitor these changes, flexibly adjust trading strategies, and seize investment opportunities in the NASDAQ index.
NASDAQ Index Technical Analysis
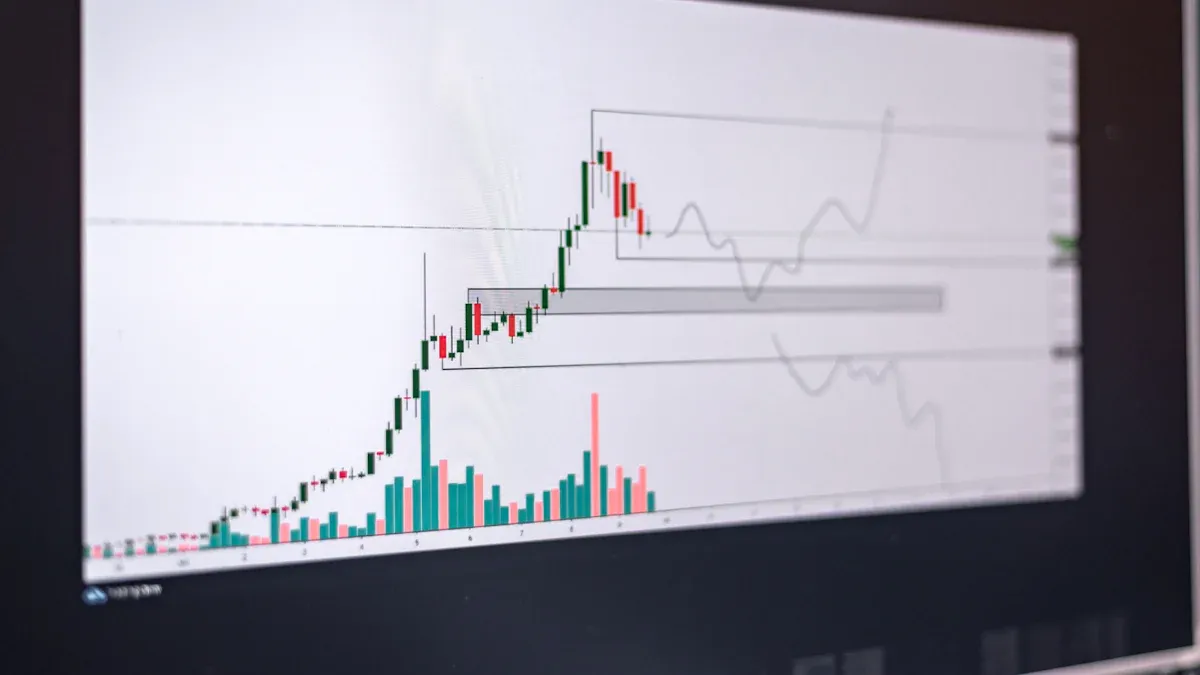
Image Source: pexels
Candlestick Patterns and Moving Averages
You can use candlestick charts to observe NASDAQ index price fluctuations. Candlestick charts clearly show the open, close, high, and low prices for each trading period. When you notice consecutive bullish or bearish candles, this typically indicates clear market sentiment.
Moving averages (e.g., 5-day, 20-day, 60-day) help you determine the overall direction. When the short-term moving average crosses above the long-term moving average, it’s a bullish signal. Conversely, when the short-term moving average crosses below the long-term moving average, it’s a bearish signal. You should combine trend lines and support/resistance lines to identify key turning points. For example, when candlesticks break through significant resistance lines with bullish moving average alignment, this often signals further upside potential for the NASDAQ index.
RSI and MACD
RSI (Relative Strength Index) helps you determine whether the NASDAQ index is overbought or oversold. When RSI exceeds 70, the market may be overheated, with pullback risks. When RSI falls below 30, it may signal a rebound opportunity.
MACD (Moving Average Convergence Divergence) is used to capture trend changes. You can observe changes in MACD histograms and the crossover of DIFF and DEA lines. When MACD histograms turn positive from negative, and the DIFF line crosses above the DEA line, it’s a clear bullish signal. You should combine candlestick patterns (e.g., bullish engulfing, morning star) to improve trading win rates.
Bollinger Bands Application
Bollinger Bands consist of a middle line (typically a 20-day moving average) and two standard deviation lines above and below. You can use Bollinger Bands to identify the NASDAQ index’s volatility range. According to technical analysis, Bollinger Bands’ expansion and contraction are significantly correlated with NASDAQ index price movements. When Bollinger Bands expand and candlesticks stay near the upper band, bullish momentum is strong, and the uptrend is likely to continue. Conversely, when Bollinger Bands contract, the market enters a consolidation or pullback phase. You should closely monitor Bollinger Band changes and combine them with indicators like MACD to improve trend prediction accuracy.
Fibonacci Retracement
You can use the Fibonacci retracement tool to identify potential support and resistance levels for the NASDAQ index. Common retracement levels are 0.382, 0.5, and 0.618. When the NASDAQ index experiences a clear pullback, you can predict potential price stabilization points based on these levels. If the price finds support at the 0.618 retracement level and shows rebound candlestick patterns, this is typically a good entry point. You should combine other technical indicators to avoid misjudgments from single signals.
Heikin-Ashi and ATR
Heikin-Ashi (averaged candlesticks) helps you smooth NASDAQ index price fluctuations, making trend directions clearer. You can observe consecutive bullish or bearish candles to identify trend formation and changes.
ATR (Average True Range) measures market volatility, assisting you in setting reasonable stop-loss and take-profit targets.
You can follow these steps to improve trading precision:
- Use simple moving averages to determine the overall market direction.
- Observe consecutive same-color Heikin-Ashi candles to confirm the trend.
- When the price breaks the high (or low) of the previous consecutive bearish (or bullish) candles, use it as an entry signal.
- Set stop-loss (e.g., ATR × 1.2) and profit targets (e.g., ATR × 1.8) using ATR to improve risk-reward ratios.
- Combining Heikin-Ashi and ATR helps reduce false signal risks, enhancing trend judgment and trading precision.
You will find that this combination demonstrates high consistency in trend prediction based on NASDAQ index historical data. Heikin-Ashi effectively identifies trend formation, continuation, and termination, while ATR helps you set reasonable risk ranges. Single indicators are prone to false signals, but combining them compensates for weaknesses, improving overall trading performance.
Elliott Wave Theory
Elliott Wave Theory posits that market movements exhibit cyclical patterns. You can use Elliott Wave Theory to analyze the NASDAQ index’s primary impulse and corrective waves. Studies show that combining sequential moving averages with Elliott Wave Theory in trading can yield positive excess returns. You can use wave-by-wave analysis, combined with neural networks or multiple regression quantitative methods, to improve prediction accuracy. Although no clear data exists on the probability of different wave patterns, empirical results confirm that wave patterns have statistical and predictive foundations in NASDAQ index trends. You should combine trend lines, support/resistance lines, and other technical indicators to enhance the practical value of Elliott Wave Theory.
Technical analysis is not foolproof. You should verify signals from multiple perspectives and combine various indicators to improve win rates and effectively manage risks in NASDAQ index trading.
Trading Strategies

Image Source: unsplash
Trend-Following and Breakout
When trading the NASDAQ index, you should prioritize trend-following strategies. Trend-following involves trading in the direction of the market’s primary trend. When you notice the short-term moving average crossing above the long-term moving average or candlesticks consistently making new highs, these are clear bullish signals. You can use platforms like TradingView to set trend lines and moving averages to help identify entry points.
Breakout strategies are suitable when the NASDAQ index breaks key price levels. When the price breaks historical highs or significant resistance zones, it’s often accompanied by increased volume. You can enter trades during breakouts and set stop-losses to prevent losses from false breakouts.
Tip: You can set price alerts on TradingView to receive instant notifications when the NASDAQ index breaks key levels, improving trading efficiency.
Range Trading and Arbitrage
When the NASDAQ index enters a sideways consolidation phase, you can adopt range trading strategies. You need to first identify clear support and resistance zones, buying near support and selling near resistance. This strategy is suitable when volatility narrows, and the market lacks a clear trend. You can combine Bollinger Bands and RSI to determine range boundaries, improving judgment accuracy.
Arbitrage strategies exploit price differences for profit. For example, you can observe price discrepancies between NASDAQ index futures and spot prices, executing hedged arbitrage when significant deviations occur. You can also exploit price differences between exchanges for cross-market arbitrage. These strategies require substantial capital and close monitoring of transaction costs and exchange rate fluctuations (e.g., USD to HKD) to ensure arbitrage profitability.
Left-Side vs. Right-Side Trading
Left-side trading involves entering trades before a clear market reversal, anticipating lows or highs. This strategy is riskier and suitable for experienced traders. You can combine Fibonacci retracement and support/resistance lines to find potential turning points.
Right-side trading requires waiting for a clear trend confirmation before entering. For example, you enter trades after the NASDAQ index breaks key moving averages or shows clear candlestick patterns. Right-side trading has lower risk but may miss some profits. You should choose the strategy based on your risk tolerance.
| Strategy Type | Entry Timing | Risk | Suitable For |
|---|---|---|---|
| Left-Side Trading | Anticipate Reversal | Higher | Experienced Traders |
| Right-Side Trading | Trend Confirmation | Lower | Conservative Traders |
Quantitative Strategies
You can use quantitative strategies to enhance the scientific rigor of NASDAQ index trading. Quantitative trading combines data analysis, statistical models, and algorithms to automate entry and exit decisions. Academic research shows that machine learning algorithms (e.g., XGBoost) combined with volatility clustering, applied to quantitative investment strategies, use metrics like volatility, annualized returns, maximum drawdown, information ratio, and Sharpe ratio for layered backtesting. Results indicate that machine learning outperforms traditional methods in factor synthesis and strategy backtesting, with volatility clustering significantly improving strategy performance and robustness. Although this study focused on China’s CSI 300 index, its methodology and conclusions are relevant to the NASDAQ index and other markets, supported by statistical data validating the effectiveness of quantitative strategies with algorithms.
You can use platforms like TradingView to write automated strategies with Pine Script or perform backtesting with Python. This reduces emotional interference and enhances trading discipline.
TradingView Pine Script Example
strategy("MA Crossover", overlay=true)
short_ma = ta.sma(close, 5)
long_ma = ta.sma(close, 20)
if ta.crossover(short_ma, long_ma)
    strategy.entry("Long", strategy.long)
if ta.crossunder(short_ma, long_ma)
    strategy.close("Long")
You can adjust parameters based on your needs and test strategy performance in a demo account first.
Stop-Loss and Take-Profit
In NASDAQ index trading, you must strictly implement stop-loss and take-profit. Stop-loss helps you control single-trade losses, preventing emotional trading from causing significant losses. You can set stop-loss points based on ATR (Average True Range) or a fixed percentage (e.g., 2%). Take-profit locks in profits, preventing reversals from eroding gains. You can set take-profit points based on key resistance levels or predetermined reward ratios (e.g., 1:2).
Expert Advice: You should regularly review stop-loss and take-profit strategies, flexibly adjusting based on market volatility and personal risk tolerance. Strict discipline is key to stable long-term profits.
Risk Management
Leverage and Margin
You often encounter leverage in trading. Leverage amplifies your returns but also increases risks. You should choose an appropriate leverage ratio based on your capital situation. Excessive leverage can lead to account blowouts, especially during high market volatility. When selecting leverage, calculate the maximum acceptable loss per trade first.
The margin system requires you to deposit a certain amount as a trading guarantee. When market prices move against you, the platform may require additional margin. You should regularly check margin balances to avoid forced liquidations due to insufficient funds.
Expert Advice: You can refer to Hong Kong banks’ leverage product descriptions to understand the impact of different leverage ratios on risks. Before each trade, calculate the USD amount and exchange rate fluctuations’ impact on margin to ensure fund safety.
Emotions and Discipline
In the trading process, emotional management is crucial. Market volatility can easily trigger fear or greed, affecting your judgment. You should establish a clear trading plan and strictly implement stop-loss and take-profit.
Here are methods to improve discipline:
- Set daily or weekly maximum loss limits, stopping trading once reached.
- Write down entry and exit reasons before each trade.
- Regularly review trading records to identify causes of emotional trading.
- Use automated tools to reduce subjective judgments.
You can use platforms like TradingView to set automatic alerts, helping you stay calm.
Remember, discipline is more important than short-term profits. Only by maintaining discipline long-term can you achieve stable profits in the market.
You have now grasped the key points of 2025 technical analysis. Effectively using various trading strategies and strictly implementing risk management can improve win rates. You should continue learning technical analysis and proactively review each trade. Remember, markets change rapidly, and blind trend-following should be avoided. All investment decisions must be prudently judged based on your personal circumstances.
FAQ
Is the NASDAQ index suitable for beginner investors?
You can participate in NASDAQ index investing. The NASDAQ is highly volatile, so learn basic technical analysis first and strictly set stop-losses. Beginners can consider demo trading to gain experience.
How to choose suitable technical indicators?
You should select indicators based on your trading style. Short-term traders can use candlesticks and RSI; medium- to long-term traders can use moving averages and MACD. Combining multiple indicators improves judgment accuracy.
How to control risks when trading the NASDAQ index?
You should strictly set stop-loss and take-profit, use leverage rationally. Calculate maximum acceptable loss before each trade. Invest only a portion of funds to diversify risks.
What foundation is needed for quantitative trading strategies?
You need basic statistical knowledge and programming skills. Use Python or TradingView Pine Script to write strategies. Test performance in a demo account first.
What are the main fees involved in NASDAQ index trading?
You should note trading commissions, platform fees, and exchange rate differences. Priced in USD, exchange rate fluctuations affect final returns. Compare fee structures across platforms.
The Nasdaq index’s volatility and high trading costs demand quick action to seize opportunities, while cumbersome investment processes and limited flexible savings options independently hinder fund efficiency. BiyaPay, as an all-in-one financial platform, enables real-time US and HK stock trading without complex procedures, helping you capitalize on Nasdaq opportunities. Platform remittance fees are as low as 0.5%, covering 190+ countries with same-day transfers. Its flexible savings product offers a 5.48% annualized return, with daily interest credited automatically and withdrawals anytime, supporting 30+ fiat and 200+ cryptocurrencies, secured by KYC.
Try BiyaPay now to start your global investment journey! Join BiyaPay for efficient fund management!
*This article is provided for general information purposes and does not constitute legal, tax or other professional advice from BiyaPay or its subsidiaries and its affiliates, and it is not intended as a substitute for obtaining advice from a financial advisor or any other professional.
We make no representations, warranties or warranties, express or implied, as to the accuracy, completeness or timeliness of the contents of this publication.


Contact Us
Company and Team
BiyaPay Products
Customer Services


is a broker-dealer registered with the U.S. Securities and Exchange Commission (SEC) (No.: 802-127417), member of the Financial Industry Regulatory Authority (FINRA) (CRD: 325027), member of the Securities Investor Protection Corporation (SIPC), and regulated by FINRA and SEC.
registered with the US Financial Crimes Enforcement Network (FinCEN), as a Money Services Business (MSB), registration number: 31000218637349, and regulated by FinCEN.
registered as Financial Service Provider (FSP number: FSP1007221) in New Zealand, and is a member of the Financial Dispute Resolution Scheme, a New Zealand independent dispute resolution service provider.