- EasyCard
- Trade
- Help
- Announcement
- Academy
- SWIFT Code
- Iban Number
- Referral
- Customer Service
- Blog
- Creator
Comparing the 2025 Market Crash to Previous Financial Crises


Image Source: unsplash
The 2025 stock market crash shows both familiar patterns and new challenges compared to past events. Major indices fell sharply, with the S&P 500 dropping 6.65% and the Dow Jones falling 5.5% in early April. These losses echo the panic seen in previous crashes, such as the 22% plunge on Black Monday in 1987.
New tariff policies pushed the average rate to historic highs, while stagflation risks increased market uncertainty. Many now ask, why is the market crashing so suddenly? By studying each crash, investors can see patterns and find hope for recovery.
Key Takeaways
- The 2025 market crash is driven mainly by new tariffs and stagflation risks, which raise costs and create uncertainty for businesses and consumers.
- Tariff increases have caused job losses, supply chain changes, and sharp stock price drops, making investors worry about the future.
- Stagflation means prices rise while economic growth slows, hurting profits and pushing investors toward safer assets like gold and bonds.
- Unlike past crashes, the 2025 event is unique due to policy-driven shocks and a strong labor market, requiring investors to adapt their strategies.
- Staying calm, diversifying investments, and understanding market patterns help investors manage risk and prepare for recovery after crashes.
Why Is the Market Crashing in 2025?
Tariff Uncertainty
Many investors ask, “why is the market crashing” in 2025? One major reason is the sudden change in U.S. tariff policies. The government raised tariffs on many imported goods, which made products more expensive for both consumers and businesses. This move led to a sharp increase in the average effective tariff rate, jumping from 2.2% to as high as 17.0% in some scenarios. The impact of these tariffs spread quickly across the market.
| Evidence Aspect | Empirical Finding / Data Point |
|---|---|
| Tariff Pass-Through Rate | Near 100%, indicating tariffs largely affect domestic consumers and firms rather than foreign exporters. |
| Firms Citing Tariffs as Top Concern | Increased from 8.3% to over 30% in one quarter, showing rising business concern over tariffs. |
| Average Effective Tariff Rate (AETR) | Projected increase from 2.2% to as high as 17.0% under aggressive tariff scenarios. |
| Employment Impact | Net job losses of about 220,000 in import-dependent industries; total employment reduction up to 2.6% (~320,000 jobs) when including retaliatory tariffs. |
| Regional Vulnerability | Midwest and Southeast states (e.g., Michigan, Ohio, Indiana) and Pacific Northwest face heavy tariff burdens due to manufacturing and resource trade ties. |
| Firm Responses | Over 50% of manufacturing firms plan supply chain diversification; ~32% reducing hiring; ~29% cutting capital spending. |
| Industry Impact | Manufacturing, mining, construction, and utilities sectors report significant disruptions and tariff exposure. |
Tariffs do not just raise prices. They also create uncertainty. When companies do not know what trade rules will look like next month, they hesitate to invest or hire new workers. Over 30% of firms now list tariffs as their top concern, up from just 8.3% a few months ago. This uncertainty makes the market more volatile. Stock prices react sharply to tariff news, with major indices like the S&P 500 and Dow Jones showing significant drops after tariff announcements. Tariffs and trade policy uncertainty explain up to 7.9% of the S&P 500’s forecast error variance, and nearly 10% for the Dow Jones.
Tariff uncertainty has a long history of causing market swings. For example, the Smoot-Hawley Tariff Act in 1930 led to a collapse in global trade and deepened the Great Depression. More recently, tariffs in 2018 caused market volatility and supply chain disruptions. In 2025, similar patterns have emerged, with tariffs causing both direct and indirect shocks to the market.
When people wonder why is the market crashing, they should look at how tariffs disrupt business planning, raise costs, and trigger job losses. These effects ripple through the market, leading to a stock market crash.
Stagflation Risks
Another key reason why is the market crashing in 2025 is the return of stagflation. Stagflation means the economy faces both high inflation and slow growth at the same time. This combination is rare but very damaging for the market.
- Inflation remains high, with consumer prices rising 3.1% year-over-year and core inflation above 3.5%, especially in services.
- Real GDP shrank by 0.3% in the first quarter of 2025, showing that economic growth has stalled.
- Unemployment climbed to 4.1% in April, with over 220,000 layoffs in tech, retail, and logistics.
- The Federal Reserve kept interest rates high at 5.25–5.50%, the highest since 2001, and the yield curve stayed inverted, which often signals a recession.
- The NFIB Small Business Optimism Index dropped to 88.2, the lowest since the pandemic, showing that business owners feel less confident.
- The S&P 500 index fell 8.7% below its peak, and the VIX volatility index hit a five-year high after tariff announcements.
- Tariffs and trade tensions are estimated to reduce GDP by up to 1.2%, adding to inflation and slowing the economy.
Stagflation puts pressure on both consumers and businesses. Prices go up, but wages and jobs do not keep pace. Investors see falling profits and rising costs, which leads to a stock market crash. During past periods of stagflation, such as the late 1970s, equities suffered the most, while gold and U.S. Treasury bonds performed better as people looked for safer investments.
| Asset Class | Performance During Stagflation (1973-2021) | Notes |
|---|---|---|
| Equities | Suffered the most | Negative impact due to margin compression and lower growth expectations |
| Gold | Top performer | Defensive real asset, benefits from inflation and uncertainty |
| US Treasury Bonds | Annualized average adjusted return ~9.6% | Benefited from flight to safety despite inflation pressures |
| Corporate Bonds | Worse than Treasuries but resilient | Credit spreads widened marginally due to inflation and risk aversion |
The 2025 stock market crash stands out because it combines tariff shocks with stagflation risks. This mix creates a perfect storm for the market. Investors face both policy uncertainty and a tough economic environment. The result is a sharp downturn, with many asking why is the market crashing now. History shows that when inflation, slow growth, and trade barriers hit together, the market struggles to recover quickly. The risk of recession grows, and the path to recovery becomes more uncertain.
What Is a Stock Market Crash?
Crash vs. Correction
A stock market crash happens when stock prices fall very quickly, usually by 20% or more, in a short time. For example, the S&P 500 lost 28.5% during the 1987 crash and 23.7% in 2008. These sharp drops can cause panic and big losses for investors. In contrast, stock market corrections are smaller declines. They happen when prices drop at least 10% but less than 20%. Corrections are common. About half of all years from 2002 to 2021 saw at least one correction. The average pullback during corrections is around 15%. Most corrections do not lead to a full stock market crash. Instead, they often help the market reset and can be followed by a rebound.
Some key differences between market corrections versus crashes include the speed and depth of the decline. Crashes are fast and deep, while corrections are usually shorter and less severe. Corrections rarely cause firm-level financial distress or bankruptcy risk. Crashes, however, often hit companies with high debt, high market risk, or low liquidity the hardest.
- Stock market crash: 20%+ drop, rapid, severe, can last years
- Stock market corrections: 10–20% drop, shorter, often recover in months
Common Triggers
Many factors can trigger a stock market crash. These include sudden changes in economic data, new government policies, or unexpected global events. Crashes often follow long periods of rising prices and high optimism. When investors start to copy each other’s moves, this herd behavior can make the market more unstable. High price-to-earnings ratios, heavy use of borrowed money, and risky trading strategies also increase the chance of a crash.
Researchers have found that warning signs often appear before a crash. These include rising debt levels, falling company profits, and more investors using leverage. Sometimes, new technology or trading methods, like program trading in 1987, can add to the risk. Crashes are rare, but they can change the market for years. Stock market corrections, on the other hand, are more common and usually signal a healthy adjustment in prices.
Stock Market Crashes: Historical Overview
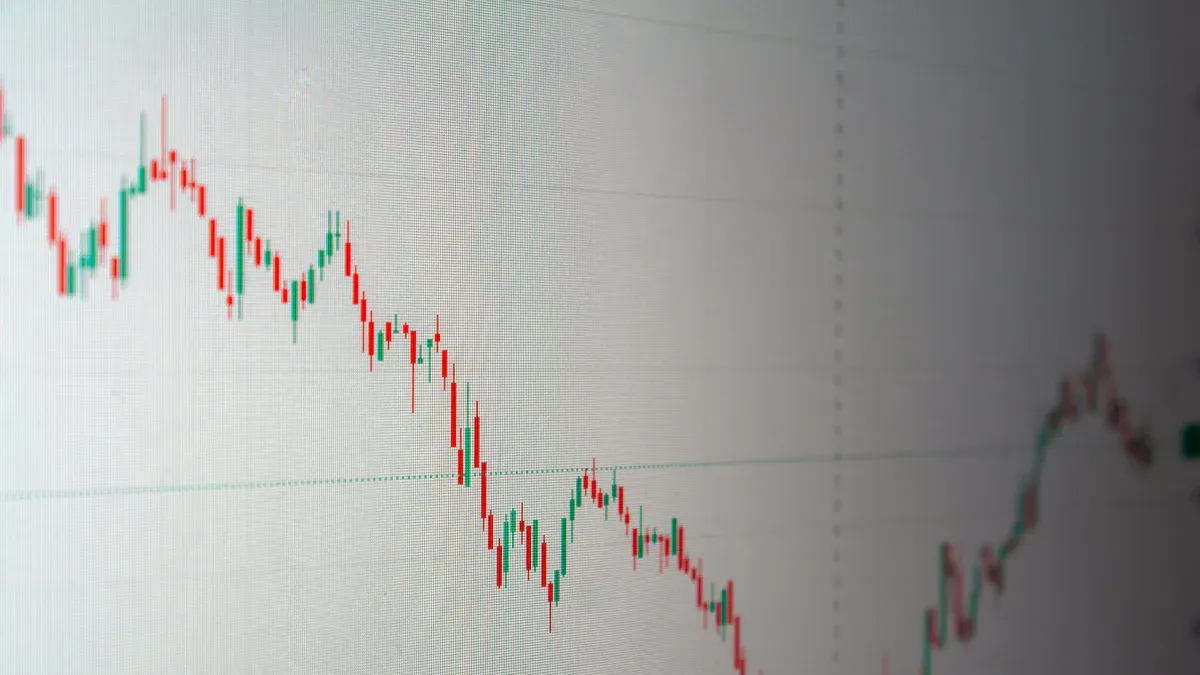
Image Source: unsplash
1929 Crash
The 1929 stock market crash marked the start of the Great Depression. The Dow Jones Industrial Average had climbed tenfold over nine years, peaking in September 1929. Many investors bought stocks on margin, borrowing money to invest. Warnings appeared, such as Roger Babson’s prediction of a coming crash and the jailing of Clarence Hatry for fraud. Despite these signs, most investors stayed optimistic. The Federal Reserve raised interest rates in August 1929, but the action came too late. Black Monday and Black Tuesday saw drops of nearly 13% and 12%. By 1932, the Dow had lost almost 89% of its value.
1987 Crash
The 1987 crash, known as Black Monday, remains the largest single-day percentage drop in history. On October 19, the Dow Jones fell 22.6%. Before the crash, stock prices had surged, with the market up 35.5% year-to-date. International investors became more active, and new trading strategies like portfolio insurance made the market more unstable. When prices started falling, automated selling made the decline worse. After the crash, regulators introduced circuit breakers to pause trading during sharp drops. The market recovered to pre-crash levels within two years, showing how reforms can help after severe stock market crashes.
2008 Crash
The 2008 stock market crash began with problems in the shadow banking sector. The Dow fell more than 50% from its 2007 peak over about a year and a half. Shadow banks used high leverage, which made the system fragile. When the crisis hit, the probability of a financial run peaked, causing a sharp drop in economic output. Real GDP per capita stayed 5%–6% lower six years after the crash. The crisis showed that financial instability can have long-lasting effects on the economy. Stock market crashes like this one highlight the risks of complex financial systems.
2020 Crash
The 2020 crash happened faster than any previous market crashes. The COVID-19 pandemic triggered a sharp decline, with the S&P 500 dropping over 30% in just weeks. U.S. corporate share values fell by 20% in March 2020. The World Bank called it the worst global recession since World War II. Economic growth in the U.S. dropped by 3.8%. Researchers found that the market had already formed bubbles before the pandemic, so the virus acted as a trigger. Quick government action helped the market rebound, but the event showed how quickly a stock market crash can unfold in a global crisis.
| Event | Duration | Index | Percentage Decline |
|---|---|---|---|
| Wall Street Crash of 1929 | Oct 1929 – Jul 1932 | Dow | ~89% decline |
| Black Monday (1987) | Single day: Oct 19, 1987 | Dow | 22.6% decline |
| Great Recession (2008) | Oct 2007 – Mar 2009 | Dow | ~50% decline |
| COVID-19 Crash (2020) | March 2020 (weeks) | Dow | ~37% decline |
These events show how stock market crashes can happen for different reasons. Each crash changed the market and shaped future rules. By studying historical market trends, investors can better understand risks and prepare for the future.
2025 Crash Factors vs. Past Crashes

Image Source: unsplash
Policy Changes
Policy changes have played a major role in shaping stock market crashes throughout history. In 2025, new tariff policies and trade barriers caused a sharp reaction in the market. These changes led to higher costs for businesses and consumers, making companies rethink their investments and hiring plans. The sudden rise in tariffs reminded many investors of past events, such as the Smoot-Hawley Tariff Act in 1930, which deepened the Great Depression.
A look at past policy events shows that markets often react quickly to big announcements. For example, during the COVID-19 crisis, lockdowns and interest rate cuts caused immediate drops in stock prices. The table below shows how different policy events affected stock index returns:
| Policy Event | Coefficient (Stock Index Return) | Significance Level | Interpretation |
|---|---|---|---|
| Lockdown | -1.23 to -1.93 | *** (p < 0.01) | Immediate negative market reaction |
| Post Lockdown Period | +0.5 to +0.57 | * (p < 0.1) | Slight positive effect after lockdown |
| Interest Rate Cut | -1.86 to -2.61 | *** (p < 0.01) | Stronger immediate negative market reaction |
| Post Interest Cut | -2.58 to -2.61 | *** (p < 0.01) | Continued negative effect after rate cut |
| DID_Interest Rate Cut | +1.93 to +1.96 | *** (p < 0.01) | Positive effect indicating market recovery |
The 2025 stock market crash stands out because policy changes, especially tariffs, acted as the main trigger. Unlike previous crashes driven by financial system failures or health crises, the 2025 event came from government actions that changed the rules for trade and business. This difference helps explain why the market reacted so quickly and why recovery patterns may not follow past trends.
Market Volatility
Stock market volatility measures how much prices move up and down. In 2025, the market saw a fast double-digit decline over just a few days. This speed matched the 1987 crash, but the reasons were different. The VIX, a key measure of volatility, reached 25 in early 2025. This number is higher than the 10-year average of 15.2 but much lower than the peaks seen in 2008 and 2020, when the VIX went above 50.
The 2025 decline is close to the 20% drop that defines a bear market. Since 1932, the S&P 500 has had 14 bear markets, about one every 6–7 years. Most bear markets end with a recovery and new highs. Investors who stay calm during these times often see gains when the market rebounds.
Historical data shows that corrections linked to recessions last about 14 months with average drops near 36%. Corrections not tied to recessions usually last four months with average declines of 16.4%. The 2025 correction, with an 18.9% drop, is unusual. Interest rates and unemployment did not rise much, so policy uncertainty and tariffs likely drove the volatility. This pattern sets 2025 apart from other stock market crashes, where economic weakness or financial stress played a bigger role.
The table below compares the size and recovery time of major crashes:
| Market Crash | Magnitude of Decline | Duration to Recovery | Notable Recovery Pattern or Dynamics |
|---|---|---|---|
| 1929 Crash | 79% drop by 1932 | Years | Severe, long decline with slow rebound |
| 1987 Crash | 22% single-day drop | Nearly 2 years | Fastest single-day drop, quicker recovery |
| 2020 Crash | >10% drops in weeks | Months | Rapid fall and rebound during pandemic |
| 2025 Crash | Double-digit in <5 days | Ongoing; some rebound | Driven by tariffs and policy uncertainty, unique speed |
Unique 2025 Elements
Several factors make the 2025 stock market crash different from earlier events. The insurance market saw more competition and new carriers, which increased capacity and pushed prices down. The U.S. commercial insurance market grew, with the excess and surplus segment reaching about 34% of the total and $115 billion in premiums by 2023. New policy types, such as longer-term coverage and earlier renewal quotes, also appeared.
Rising interest rates gave insurance companies more income from cash deposits, a change from the near-zero rates of past years. This “free lift” improved profits for carriers in 2025. The labor market stayed strong early in the year, with 151,000 jobs added in February and unemployment at 4.1%. However, risks grew as tariffs threatened multiple sectors, and public sector layoffs could reach up to 1 million. Construction faced labor shortages due to new policies.
| Unique Quantifiable Factor | Description | Quantitative Detail |
|---|---|---|
| Insurance Market Capacity | More carriers, MGAs, and reinsurance capital | New entrants, higher capacity, lower prices |
| E&S Market Growth | Larger share of U.S. commercial business | 34% share, $115B premium, 11.5x growth since 2003 |
| Interest Rate Environment | Higher rates boost carrier income | Extra income from cash deposits in 2024–2025 |
| Policy Innovations | Longer-term policies, earlier renewals | Policies >12 months, earlier quotes |
| Macroeconomic Factor | Description | Quantitative/Qualitative Detail |
|---|---|---|
| Employment Status | No immediate recession signs | 151,000 jobs added, 4.1% unemployment |
| Policy-Driven Risks | Multiple sectors face contraction | Tariffs like Smoot-Hawley, up to 1M layoffs |
| Unique Recession Profile | Stagflation risk, labor shortages, trade wars | New mix of risks not seen in past crashes |
These unique elements show that the 2025 crash did not follow the same path as earlier stock market crashes. The mix of policy-driven shocks, strong insurance market changes, and a different labor market profile created a new kind of risk. Investors and analysts must study these differences to understand how the market may recover and what lessons to take from this event.
Stock Market Corrections and Recoveries
Recovery Patterns
Stock market corrections happen when prices drop by 10% or more from recent highs. These events can cause worry, but history shows that the market often bounces back. After a sharp fall, the market usually starts to recover within months. For example, in 2020, the S&P 500 dropped quickly but reached a new high just six months later. Smaller corrections, such as those between September 2020 and August 2021, lasted only a few weeks. The market tends to recover faster when the drop is not linked to a recession. Experts say that patience and staying invested help investors benefit from the next market recovery.
Duration and Frequency
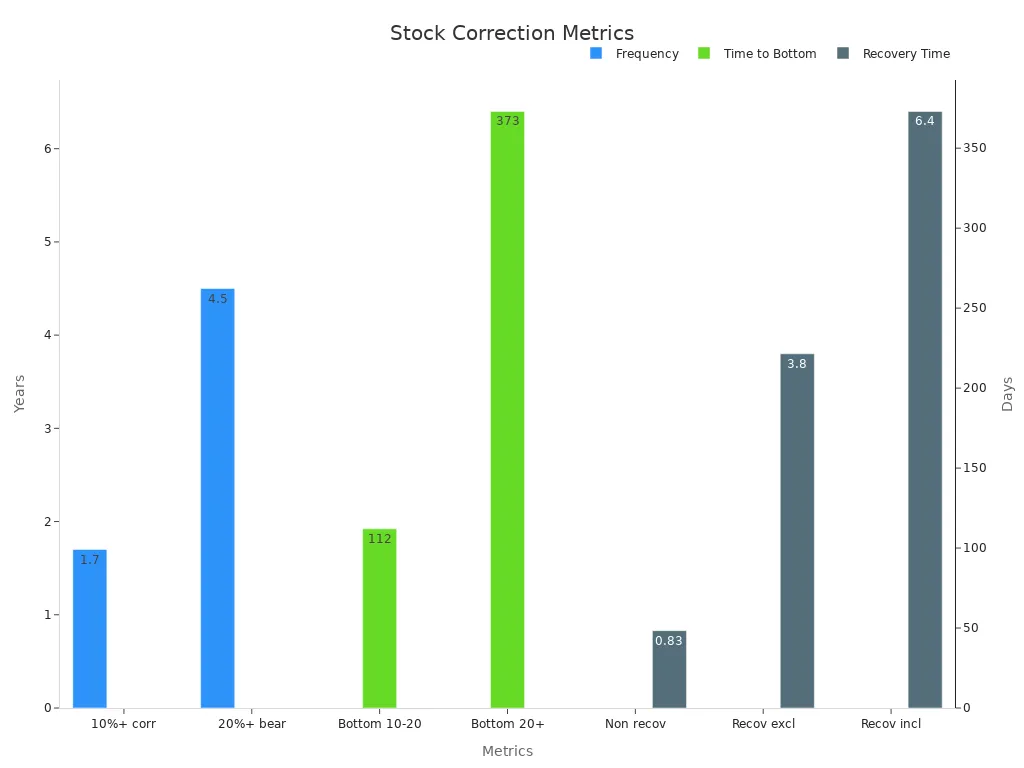
Stock market corrections are common. On average, a correction of 10% or more happens every 1.7 years. Bear markets, which are drops of 20% or more, occur about every 4.5 years. The time it takes for the market to hit bottom during a correction is usually around four months. If the correction turns into a bear market, the decline can last about a year. The table below shows these averages:
| Metric | Value (Average) | Notes/Context |
|---|---|---|
| Frequency of 10%+ corrections | Every 1.7 years | Based on 53 corrections over 90 years |
| Frequency of 20%+ bear markets | Every 4.5 years | 20 bear markets since 1928 |
| Time to bottom (10-20% drop) | 112 days (~4 months) | Time to reach lowest point |
| Time to bottom (20%+ drop) | 373 days (~1 year) | Time to reach lowest point |
| Recovery time (non-recession) | ~10 months | Time to regain previous peak |
| Recovery time (recession) | 3.8 years (excluding Great Depression) | Time to regain previous peak |
Fastest Recoveries
Some stock market corrections end quickly. The COVID-19 crash in 2020 was the shortest recession on record, lasting only two months. The market lost over 30% in weeks but recovered most losses in half a year. In milder recessions, such as those in 1957 and 1980, the market took one to two years to recover. The average recovery time for non-recession corrections is about 10 months. When the economy stays strong, the market can bounce back even faster. Investors who understand these patterns can feel more confident during future corrections.
Lessons from Stock Market Crashes
Investor Strategies
Investors can learn important lessons from past market crashes. Many financial professionals adjust their risk-taking when the market becomes unstable. During the COVID-19 crash, professionals reduced their investments in risky assets by 9 percentage points. This change happened even though their beliefs about future returns did not shift. Professionals saw risky assets as less attractive during the crash, showing that experience helps guide decisions in tough times.
A well-diversified portfolio can help investors manage risk. Portfolios that include bonds, alternative investments, and international stocks often perform more steadily during downturns. Bonds and alternative investments, such as real estate or commodities, can provide stability when the market drops. Balanced portfolios tend to recover faster than those focused only on stocks. Investors should also review and rebalance their portfolios regularly to keep up with changing market conditions.
Tip: Holding some cash can reduce immediate risk, but waiting too long to reinvest may hurt long-term growth.
Learning from History
History shows that not all investment strategies work the same during every market downturn. Research found that most timing strategies do not beat a simple buy-and-hold approach over the long term. Many popular predictive tools lose their power as the market changes. However, diversification stands out as a strong strategy. Firms with more diversified investments kept up or even increased their research and development spending during the 2008 crisis. This helped them stay competitive and flexible.
Long-term asset allocation strategies that adjust for risk can also outperform basic benchmarks. These strategies adapt to shifts in market sentiment and help investors stay resilient during uncertain times. Case studies from past crises show that quick and coordinated policy responses can limit economic damage. For example, during the Great Recession, strong policy actions reduced GDP decline by about 70% and kept unemployment lower than it could have been.
| Lesson | Description |
|---|---|
| Diversification | Spreads risk and supports recovery |
| Regular Rebalancing | Keeps portfolios aligned with goals |
| Policy Awareness | Helps investors respond to changes in the market |
| Data Monitoring | Watching trends, like search data, can offer insights |
The 2025 stock market crash shares features with past events, such as sharp declines and investor fear, but stands out due to tariff shocks and stagflation risks. Understanding these triggers helps investors prepare for future corrections.
Key strategies include:
- Combining technical and fundamental analysis improves decision-making.
- Monitoring investor sentiment can reveal turning points.
- Using risk management tools, like stop-losses and options, limits losses.
| Portfolio Focus | Market Phase | Outcome |
|---|---|---|
| Defensive factors | Corrections | Greater stability |
| Growth factors | Recoveries/Bull run | Higher returns |
Staying informed and flexible empowers investors to navigate market cycles with confidence.
FAQ
What causes a stock market crash?
A stock market crash happens when prices fall quickly. Common causes include new government policies, economic problems, or sudden global events. Investors may panic and sell their stocks, which makes prices drop even more.
How do tariffs affect the stock market?
Tariffs raise the cost of imported goods. Companies pay more for supplies, and consumers pay higher prices. This can lower profits and slow economic growth. Investors often react by selling stocks, which can lead to a market decline.
What is stagflation and why is it a problem?
Stagflation means high inflation and slow economic growth at the same time. Prices go up, but jobs and wages do not improve. This makes it hard for families and businesses to keep up with costs.
How long does it take for the market to recover after a crash?
Recovery times vary. Some markets bounce back in months, while others take years. For example, after the 2020 crash, the market recovered in about six months. Past crashes, like in 1929, took much longer.
What can investors do during a market crash?
Investors can stay calm and avoid panic selling. Diversifying investments and keeping a long-term plan helps reduce risk. Many experts suggest reviewing portfolios and seeking advice from financial professionals during uncertain times.
The 2025 market crash, driven by tariff policies and stagflation risks, fuels business uncertainty and heightened volatility. BiyaPay offers a seamless solution with remittance fees as low as 0.5%, covering 190+ countries for swift transfers, and supports fee-free conversion of 200+ digital currencies (like USDT) to USD, HKD, and JPY, alongside U.S. and Hong Kong stock investments. A 1-minute BiyaPay registration streamlines global fund management, reducing uncertainty and enhancing trading efficiency.
Navigate market turbulence with confidence! Join BiyaPay.
*This article is provided for general information purposes and does not constitute legal, tax or other professional advice from BiyaPay or its subsidiaries and its affiliates, and it is not intended as a substitute for obtaining advice from a financial advisor or any other professional.
We make no representations, warranties or warranties, express or implied, as to the accuracy, completeness or timeliness of the contents of this publication.


Contact Us
Company and Team
BiyaPay Products
Customer Services


is a broker-dealer registered with the U.S. Securities and Exchange Commission (SEC) (No.: 802-127417), member of the Financial Industry Regulatory Authority (FINRA) (CRD: 325027), member of the Securities Investor Protection Corporation (SIPC), and regulated by FINRA and SEC.
registered with the US Financial Crimes Enforcement Network (FinCEN), as a Money Services Business (MSB), registration number: 31000218637349, and regulated by FinCEN.
registered as Financial Service Provider (FSP number: FSP1007221) in New Zealand, and is a member of the Financial Dispute Resolution Scheme, a New Zealand independent dispute resolution service provider.