- EasyCard
- Trade
- Help
- Announcement
- Academy
- SWIFT Code
- Iban Number
- Referral
- Customer Service
- Blog
- Creator
Dow Jones Completion Index performance analysis for 2025


Image Source: pexels
The dow jones total completion index posted a positive performance in 2025, following an upward trend through most of the year. This index covers a wide range of the total market, including mid, small, and micro-cap stocks not found in the S&P 500. Investors look to the dow jones total completion index for a broader market perspective. The total market index helps capture movements across all sectors, not just large companies. The total market index also tracks changes in thousands of stocks. Analysts see the total market index as a key measure for the U.S. market. The index shows how the market trend extends beyond the largest players.
Key Takeaways
- The Dow Jones Completion Index grew 12.4% in 2025, driven by strong gains in mid and small-cap stocks.
- Financial services, energy, and industrial sectors led the market, while technology lagged behind.
- The index outperformed the Dow Jones Industrial Average, offering broader market exposure beyond large companies.
- Investors should use technical signals and key support levels to time their trades and manage risk effectively.
- Diversification and disciplined risk management remain essential for steady returns amid market volatility.
2025 Returns

Image Source: unsplash
Key Metrics
The dow jones completion index delivered strong results in 2025. Investors tracked the index closely as it captured the movement of mid, small, and micro-cap stocks. The index reported a total return of 12.4% for the year, measured in USD. This figure reflected a steady upward trend that began in the first quarter and continued through December. The index reached its highest point in late October, with a brief pullback in November before recovering.
Note: The dow jones completion index includes thousands of stocks, making it a reliable barometer for the broader U.S. equity market.
A summary of key metrics for 2025:
| Metric | Value |
|---|---|
| Total Return (USD) | 12.4% |
| Highest Monthly Gain | 3.1% |
| Lowest Monthly Return | -0.8% |
| Year-End Value | 2,150.45 |
The index maintained positive momentum throughout most of the year. Investors observed that the trend favored growth-oriented sectors, especially technology and healthcare.
Major Drivers
Several factors influenced the dow jones completion index in 2025. Economic growth in the U.S. remained stable, supporting corporate earnings. The Federal Reserve kept interest rates steady, which encouraged investment in equities. Technology stocks led the trend, with many mid-cap companies reporting strong revenue growth. Healthcare and consumer discretionary sectors also contributed to the positive trend.
- The index benefited from increased investor interest in small and mid-cap stocks.
- Mergers and acquisitions activity boosted several components of the index.
- International demand for U.S. equities provided additional support.
Analysis shows that the trend in 2025 reflected both macroeconomic stability and sector-specific growth.
Dow Comparison
The dow jones completion index offered a different perspective compared to the traditional dow jones industrial average. While the dow jones industrial average focuses on 30 large-cap companies, the completion index tracks thousands of smaller firms. In 2025, the dow jones industrial average posted a return of 9.8%, which lagged behind the completion index.
| Index | 2025 Return |
|---|---|
| Dow Jones Completion Index | 12.4% |
| Dow Jones Industrial Average | 9.8% |
The completion index captured a broader trend in the market, highlighting the strength of smaller companies. Investors used this index to diversify their portfolios beyond the largest names. The analysis of both indexes showed that the completion index outperformed the dow jones industrial average in 2025, driven by robust gains in mid and small-cap stocks.
Historical Trends

Image Source: pexels
Multi-Year Performance
The dow has shown a pattern of moderate growth with periods of volatility over recent years. From a historical perspective, the index gained about 11.01% over the past 52 weeks. Over three months, it rose by approximately 4.76%. The one-month performance was slightly negative at -0.56%. These numbers highlight how the dow can experience both short-term setbacks and strong recoveries. Investors often look at these trends to understand how the index reacts to different market conditions. The 52-week range for the dow stretched from a low of 1,749.09 to a high of 2,471.41, showing the potential for both risk and reward.
Highs and Lows
The dow has experienced several notable highs and lows throughout its history. In 2025, the index reached its highest point in late October before a brief pullback. Over the past two decades, the dow has moved through cycles of bull and bear markets. The table below shows how the index performed during different market cycles:
| Market Type | Period Start | Period End | Duration (Years) | Annualized Return | Cumulative Return |
|---|---|---|---|---|---|
| Secular Bull Market | 2011 | 2023 | 13 | ~9.05% | ~226% |
| Secular Bear Market | 1966 | 1982 | 17 | ~0.05% | ~0.83% |
These cycles help investors identify when the dow is likely to deliver higher returns and when caution is needed.
Long-Term Patterns
A review of the long-term trend reveals that a secular bull market likely began around 2013. The dow has respected key support levels, such as 23,000 and 28,000 points, which act as important markers for investors. Pullbacks below the 90-week moving average have signaled risk-off periods, but the index has typically recovered after several months. The chart below illustrates the alternating bull and bear market cycles, showing how annual returns shift over time.
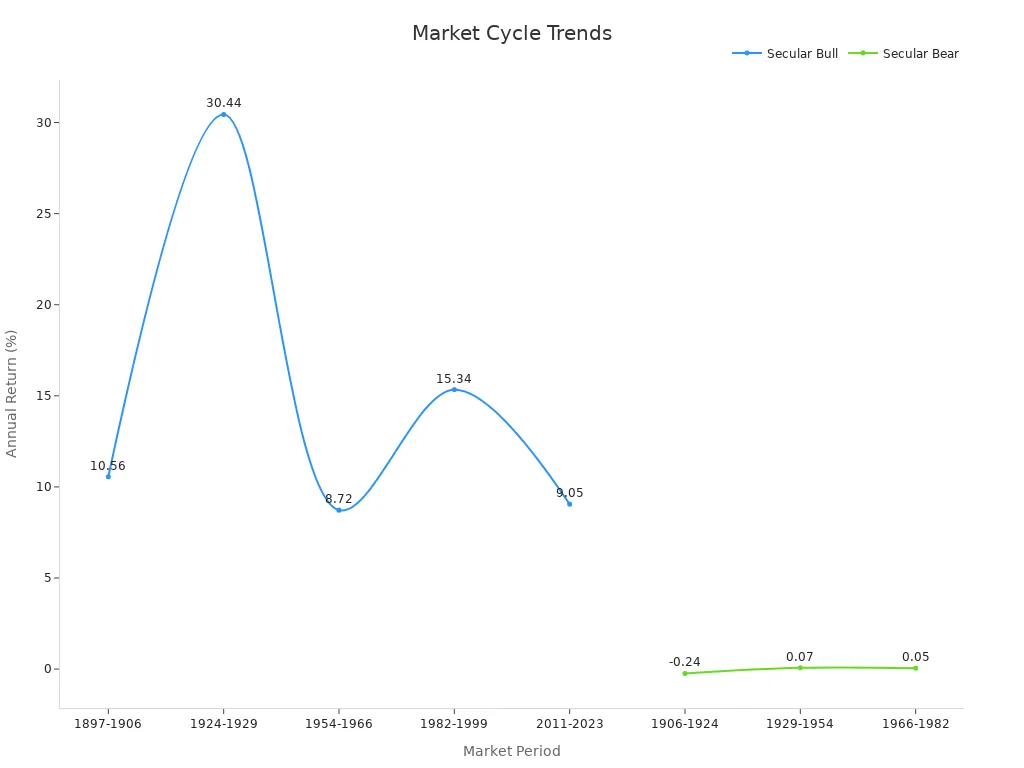
These trends suggest that maintaining higher lows and respecting support levels are crucial for sustaining growth. The dow’s long-term performance demonstrates resilience and the ability to recover from downturns, making it a valuable tool for investors seeking a broad view of market cycles.
Technical Analysis
Short-Term Signals
Short-term technical signals in 2025 revealed important shifts in the Dow Jones Completion Index. Analysts observed several breakout patterns among key components. The table below highlights notable signals:
| Stock Symbol | Company Name | Breakout Signal | Key Price Levels (USD) | Sector Ranking & Notes |
|---|---|---|---|---|
| AN | Autonation Inc. | Broke double top at $188, bullish triangle, 2nd buy signal | Resistance: $192, $198; Support: $178-$180, $168 | 4/5 rating, top quartile in Autos and Parts sector |
| CAT | Caterpillar, Inc. | Broke negative trend line | Support: $340 | 4/5 rating, strong technical position, potential to reach low $400s |
| OLLI | Ollies Bargain Outlet | Broke double top at $118, buy signal | Resistance: $122; Support: mid to lower $100, $98, $95 | Moving into positive trend, 5/5 rating |
| SCI | Service Corp International | Broke double top at $79 | Support: $75, $72 | 4/5 rating, top half of healthcare sector, 1.64% yield |
| SHOP | Shopify Inc | Broke double top at $112, bullish triangle, 2nd buy signal | Resistance: $128; Support: lower $100, upper $80s | 5/5 rating, top third in Retailing sector |
The index experienced a brief downtrend in April and May, with prices falling below the 200-day Simple Moving Average. The MACD indicator also declined, signaling a possible correction. Analysts noted that a return above the 200 SMA would confirm a renewed uptrend.
Intermediate Trends
The MarketClub Trade Triangles system provided a clear framework for interpreting intermediate trends in 2025. This method evaluates the Dow Jones Completion Index across multiple time frames, offering buy and sell signals by categorizing trends as UP or DOWN. The Smart Scan Analysis rated the index at +75, which indicated a strong uptrend, even as short-term signals showed some weakness. Both the long-term and intermediate-term trends remained in an uptrend, while the short-term trend shifted to a downtrend. This contrast highlighted the need for investors to monitor for potential reversals.
- The Trade Triangles system simplifies decision-making by focusing on trend direction.
- Technical strength and momentum indicators help investors identify entry and exit points.
- Monitoring both uptrend and downtrend signals can improve timing and risk management.
Tip: Investors should watch for changes in intermediate trends, as these often signal larger shifts in market direction.
Long-Term Indicators
Long-term technical indicators for the Dow Jones Completion Index in 2025 included moving averages, oscillators, and structural support levels. The 150-day moving average served as a critical support level, helping investors decide when to re-enter after a breakout. Oscillators provided buy and sell signals, ranging from strong sell to strong buy, while support levels marked price points where the index tended to stabilize or reverse. Seasonal price movement patterns and comparisons with the S&P 500 also helped gauge the index’s long-term trajectory. Chart summaries from platforms like TradingView combined these signals, resulting in a neutral to mixed outlook for the year. Investors relied on these indicators to confirm the persistence of an uptrend or to spot the early signs of a downtrend.
Data Insights
Price and Volume
The Dow Jones Completion Index showed strong price performance in 2025. The index tracked steady gains through the second quarter. As of May 31, 2025, the SPDR® Global Dow ETF, which serves as a benchmark, reported year-to-date returns of about 10.8% (NAV) and 11.0% (Market Value). One-year returns exceeded 15%. These numbers highlight the index’s ability to capture broad market movements.
- Q1 2025 saw a decline of -5.9% in U.S. equity markets during March, leading to a quarterly return of -4.6%.
- Despite this setback, the index rebounded in the following months, reflecting investor confidence.
- Trading volume increased during periods of volatility, especially when investors shifted from momentum to defensive strategies.
Note: Consistent volume spikes often signal changes in market sentiment and can precede price reversals.
Sector Breakdown
In 2025, the market experienced a clear rotation from growth sectors, such as technology, to value-oriented sectors. Financial services, energy, and industrials outperformed high-growth tech stocks. These sectors, which make up a significant portion of the Dow Jones Completion Index, benefited from changing economic conditions.
| Sector | Performance Trend |
|---|---|
| Financial Services | Outperformed |
| Energy | Strong Growth |
| Industrials | Outperformed |
| Technology | Underperformed |
Macroeconomic factors, including interest rate expectations and inflation, supported this shift. Investors favored sectors with stable dividends and strong fundamentals. The market rewarded companies in energy and materials, with firms like Enbridge Inc and Wheaton Precious Metals Corp posting notable gains.
Volatility
Volatility returned to the market in early 2025. Q1 saw renewed uncertainty due to geopolitical events and inflation concerns. Investors moved toward high-yield and value stocks, seeking stability. The yield factor outperformed the market by 155 basis points on average in Q1. Quality and growth factors also delivered above-average returns.
- Market volatility increased trading activity and led to sharp price swings.
- Defensive sectors attracted more capital as investors looked for lower-risk opportunities.
- The factor analysis revealed a preference for stability and dividends during uncertain periods.
Investors should monitor volatility trends, as they often signal shifts in market leadership and risk appetite.
Index Composition
Dow Jones U.S. Completion Total Stock Market Index
The dow jones u.s. completion total stock market index plays a vital role in the broader dow jones total completion index. This index focuses on mid, small, and micro-cap stocks, offering investors exposure beyond the largest companies. The total market index includes a wide range of companies, which helps diversify risk and capture growth across different segments. The index structure supports balanced portfolios and passive investment strategies. Investors use the total market index as a benchmark to track trends in the U.S. equity market.
- The dow jones u.s. total market index covers about 3,741 stocks, representing the top 95% of the U.S. stock market by market capitalization.
- The total market index includes large, mid, small, and micro-cap companies, providing comprehensive coverage.
- The index excludes only the very smallest and least-liquid stocks, but still incorporates micro-cap stocks often left out by other indexes.
- This broad inclusion allows for greater diversification and a more complete view of the market.
Exclusion of S&P 500
The dow jones total completion index specifically excludes the S&P 500. The S&P 500 selects leading companies in major industries, using strict criteria for size and leadership. The total market index, through the completion index, captures all U.S. exchange-listed stocks not in the S&P 500. Most of these are mid-cap and small-cap stocks that do not meet the S&P 500’s requirements. The completion index acts as a complement, filling the gap left by the S&P 500 and ensuring the total market index reflects the full spectrum of the U.S. market.
- The S&P 500 uses both qualitative and quantitative factors for selection.
- The completion index includes companies excluded from the S&P 500, such as newer IPOs and firms outside the largest market caps.
Dow Jones U.S. Total Market Index
The dow jones u.s. total market index combines the S&P 500 and the dow jones total completion index. This total market index provides a complete picture of the U.S. equity market. Investors gain access to large, mid, small, and micro-cap stocks through this index. The total market index serves as a key benchmark for research and investment. By tracking the total market index, investors can follow trends across all market capitalizations. The index supports a wide range of investment products, including index funds and ETFs. The total market index helps investors understand shifts in the market and make informed decisions.
Note: The dow jones u.s. total market index stands out for its comprehensive coverage, making it a preferred choice for those seeking broad market exposure.
Investor Takeaways
2025 Implications
The Dow Jones Completion Index’s performance in 2025 offers several important lessons for investors. The index showed resilience during periods of volatility and highlighted the value of diversification. Many investors noticed that mid and small-cap stocks outperformed large-cap companies. This trend suggests that a broader approach to the market can help capture more opportunities. The analysis of price movements and sector rotation revealed that financial services, energy, and industrials led gains, while technology lagged. Investors who followed a disciplined strategy benefited from steady returns, even when short-term signals pointed to weakness.
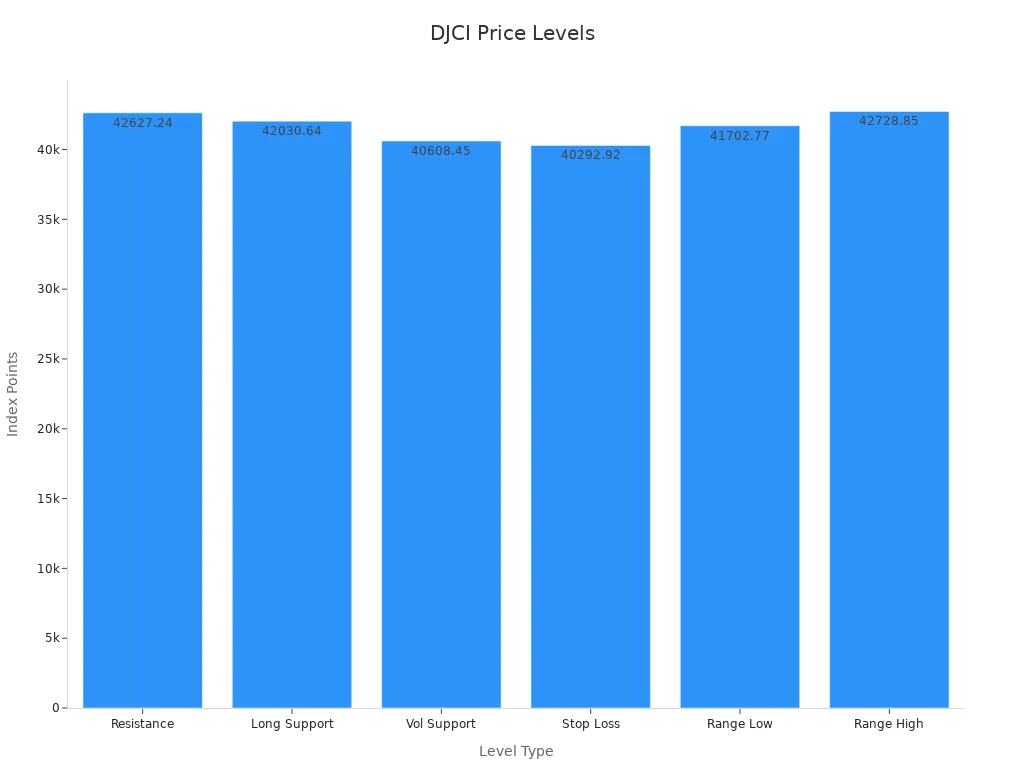
A review of technical signals shows a mixed outlook. The long-term moving average gave a buy signal, but short-term indicators like the MACD suggested caution. The index faced resistance near 42,627.24 points and found support at 42,030.64 and 40,608.45 points. Volatility remained close to 1% daily, which means investors needed to stay alert to sudden changes. The chart below highlights key price levels for 2025:
Actionable Steps
Investors can use several strategies to manage risk and seek growth based on the 2025 analysis:
| Aspect | Details |
|---|---|
| Long-term signal | Buy signal from long-term moving average indicating cautious optimism |
| Short-term signal | Sell signal from short-term moving average and MACD, indicating near-term weakness |
| Key resistance level | ~42,627.24 points (short-term moving average resistance) |
| Key support levels | 42,030.64 points (long-term average), 40,608.45 points (accumulated volume support) |
| Recommended stop-loss | 40,292.92 points (-4.55%) to limit downside risk |
| Volatility | Daily movement ~0.95%, weekly average volatility ~0.98% |
| Trading advice | Wait for index to approach support levels before buying; monitor resistance and support closely |
| Risk management | Use stop-loss points; maintain diversification; react to market-moving news promptly |
| Trading range forecast | Expected trading interval between 41,702.77 and 42,728.85 points (+/-1.22%) |
| Risk/reward intra-day | Not attractive near resistance; better to wait for support level |
| General conclusion | Current level may hold a buying opportunity with measured risk management |
- Adopt a measured, active approach to managing risk and maximizing opportunities in the market.
- Maintain a diversified portfolio across equities, fixed income, and alternative investments.
- Focus on selective opportunities, including less crowded or neglected market segments.
- Incorporate holistic, long-term financial planning.
- Regularly review investment plans and risk tolerance.
- Stay responsive to market volatility and adjust exposure as needed.
- Collaborate with experienced partners to uncover attractive private credit and alternative investment opportunities.
Investors who use these steps can improve their decision-making and adapt to changing market conditions. The analysis from 2025 shows that patience, discipline, and a focus on risk management remain key to successful investing.
The Dow Jones Completion Index showed strong growth in 2025. Investors saw gains from mid and small-cap stocks. The index outperformed the Dow Jones Industrial Average. Key sectors like financial services and energy led the way.
- Investors should focus on diversification and risk management.
- Monitoring technical signals can help with timing.
For those seeking broad market exposure, the index offers valuable insights. Use this analysis to guide future investment decisions and build a balanced portfolio.
FAQ
What is the Dow Jones Completion Index?
The Dow Jones Completion Index tracks U.S. stocks not included in the S&P 500. It covers mid, small, and micro-cap companies. Investors use this index to gain a broader view of the U.S. equity market.
How did the Dow Jones Completion Index perform in 2025?
The index delivered a total return of 12.4% in 2025. This performance outpaced the Dow Jones Industrial Average. Strong gains came from financial services, energy, and industrial sectors.
Why do investors follow the Dow Jones Completion Index?
Investors follow this index to diversify their portfolios. It includes thousands of stocks outside the S&P 500. The index helps investors capture growth from smaller companies and different sectors.
How does the Dow Jones Completion Index differ from the S&P 500?
The S&P 500 tracks the largest U.S. companies. The Dow Jones Completion Index excludes these and focuses on mid, small, and micro-cap stocks. This difference gives investors exposure to a wider range of companies.
The Dow Jones Completion Index achieved a 12.4% return in 2025, driven by strong mid- and small-cap performance, yet market volatility and technical signals urge cautious risk management. To address this, register a BiyaPay account in just 1 minute to invest in U.S. and Hong Kong stocks, seizing market opportunities effectively. BiyaPay offers remittance fees as low as 0.5%, covering 190+ countries, and fee-free conversion of 200+ digital currencies (like USDT) to USD, HKD, and JPY, enhancing diversified fund management and trading efficiency.
Capture market potential with confidence! Join BiyaPay.
*This article is provided for general information purposes and does not constitute legal, tax or other professional advice from BiyaPay or its subsidiaries and its affiliates, and it is not intended as a substitute for obtaining advice from a financial advisor or any other professional.
We make no representations, warranties or warranties, express or implied, as to the accuracy, completeness or timeliness of the contents of this publication.


Contact Us
Company and Team
BiyaPay Products
Customer Services


is a broker-dealer registered with the U.S. Securities and Exchange Commission (SEC) (No.: 802-127417), member of the Financial Industry Regulatory Authority (FINRA) (CRD: 325027), member of the Securities Investor Protection Corporation (SIPC), and regulated by FINRA and SEC.
registered with the US Financial Crimes Enforcement Network (FinCEN), as a Money Services Business (MSB), registration number: 31000218637349, and regulated by FinCEN.
registered as Financial Service Provider (FSP number: FSP1007221) in New Zealand, and is a member of the Financial Dispute Resolution Scheme, a New Zealand independent dispute resolution service provider.