- EasyCard
- Trade
- Help
- Announcement
- Academy
- SWIFT Code
- Iban Number
- Referral
- Customer Service
- Blog
- Creator
Dow Jones, S&P 500, and Nasdaq Who Led Today’s Market Decline


Image Source: unsplash
Today’s stock market saw the nasdaq fall 2.1%, leading the decline with a loss of 370 points. The s&p 500 dropped 1.4%, and the dow slipped 0.8%. This performance shows the nasdaq faced the sharpest pressure, signaling rising caution among investors. The s&p and dow also posted notable losses, but technology and growth stocks in the nasdaq drove the steepest drop. Investors now ask, why is dow down today, and how does this market shift affect their strategies?
Key Takeaways
- The Nasdaq led today’s market decline with the largest drop, mainly due to losses in technology and growth stocks.
- The S&P 500 and Dow also fell, but their declines were smaller, reflecting broader market caution and more stable traditional sectors.
- Geopolitical tensions and rising interest rates caused investor worries, pushing many to sell stocks and seek safer investments.
- Different sectors reacted differently; technology and growth stocks fell sharply, while some sectors like food and transportation showed gains.
- Investors should watch interest rates, global events, and sector trends closely to adjust their strategies and manage risk effectively.
Market Performance Overview
Image Source: unsplash
The stock market indexes showed clear differences in performance today. The dow jones industrial average, s&p 500, and nasdaq composite all moved lower, but the scale of their declines varied. Investors tracked each index closely to understand the broader market sentiment.
Dow Performance Today
The dow closed down 0.8%, reflecting a loss of 270 points. This performance of the dow showed relative stability compared to the other major indexes. Many blue-chip stocks in the dow faced selling pressure, but the index avoided the sharper declines seen elsewhere. The dow’s movement often signals how traditional industries respond to market stress.
S&P 500 Performance
The s&p 500 dropped 1.4% today. This index tracks a wide range of companies, so its performance gives a broad view of the market. The performance of the s&p 500 pointed to widespread caution among investors. Sectors like technology, healthcare, and consumer goods all contributed to the decline. The s&p remains a key benchmark for overall market health.
Nasdaq Performance
The nasdaq fell 2.1%, losing 370 points. This marked the steepest drop among the three indexes. The performance of the nasdaq reflected heavy losses in technology and growth stocks. The nasdaq composite is heavily weighted toward tech companies, which make up nearly half its value. When investors worry about future growth, the nasdaq often leads declines.
The table below compares the recent percentage changes for each index, highlighting the nasdaq’s sharper moves:
| Index | Nominal % Change (Apr-May 2025) | Inflation-Adjusted % Change |
|---|---|---|
| S&P 500 | 6.2% | 5.8% |
| Dow 30 | 3.9% | 3.6% |
| Nasdaq | 9.6% | 9.2% |
The nasdaq’s history of sharper drops comes from its focus on technology stocks. These stocks depend on future earnings, so they react more strongly to economic changes. The performance today fits this pattern, with the nasdaq leading the market lower.
Who Led the Decline
Nasdaq Leads Drop
The Nasdaq led today’s market decline with the sharpest percentage fall among the major indexes. On August 2, 2024, the Nasdaq Composite dropped 2.43%, losing 417.98 points to close at 16,776.16. This drop was not only the largest for the day but also pushed the Nasdaq more than 10% below its July closing high. That move confirmed the index entered correction territory. Reuters market data confirmed the Nasdaq’s decline was the steepest among the three major indices.
The Nasdaq’s performance stands out because technology and growth stocks make up a large part of the index. When investors grow cautious, these stocks often see the biggest losses. The table below shows the exact figures for each index’s decline:
| Index | Percentage Fall | Points Lost | Closing Value |
|---|---|---|---|
| Nasdaq Composite | 2.43% | 417.98 | 16,776.16 |
| S&P 500 | 1.84% | 100.12 | 5,346.56 |
| Dow Jones | 1.51% | 610.71 | 39,737.26 |
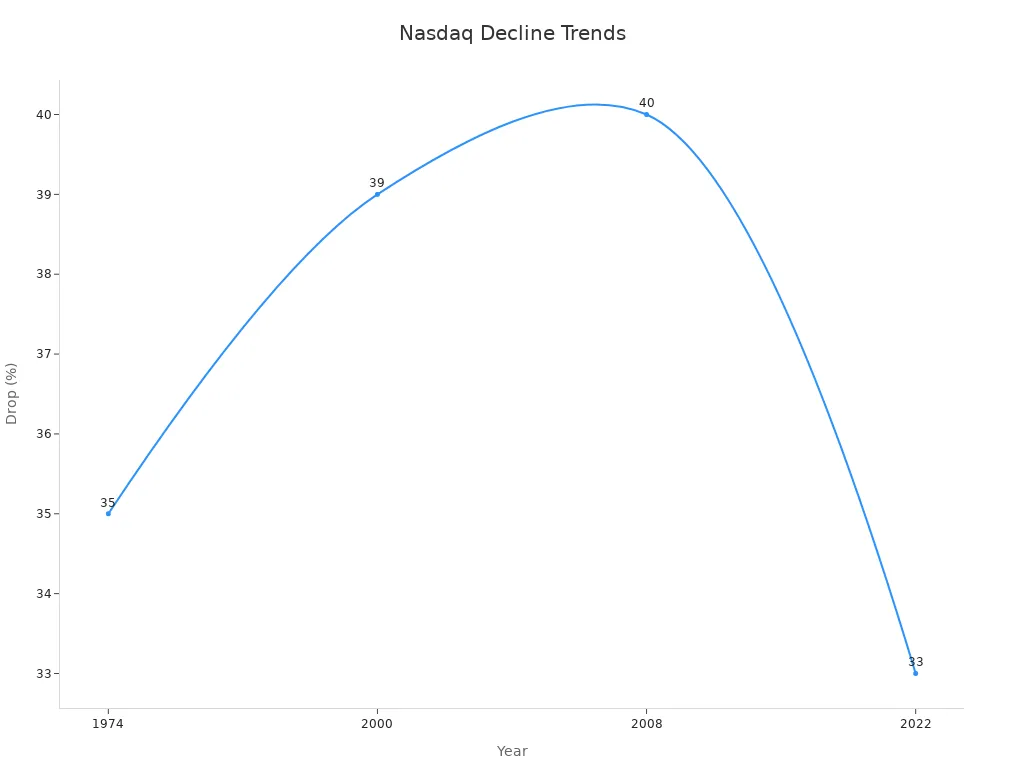
The Nasdaq’s drop was the most severe, both in percentage and in the context of recent market trends. Over the past several months, the Nasdaq Composite has shown a larger percentage decline compared to the Dow Jones and S&P 500. For example, from its November high, the Nasdaq fell 36.40%, while the Dow dropped 18.78% over a similar period. This pattern highlights the greater risk and volatility in technology-heavy indexes.
S&P 500 vs Dow
The S&P 500 also posted a significant loss, falling 1.84% and shedding 100.12 points. This index tracks a wide range of companies, so its decline signals broad-based selling across the market. The S&P 500’s performance sits between the Nasdaq and the Dow, reflecting losses in both technology and traditional sectors.
The Dow dropped 1.51%, losing 610.71 points. While this point loss appears large, the Dow’s percentage decline was the smallest of the three. The Dow includes many established companies, which often show more stability during market stress. However, even these blue-chip stocks could not avoid the negative sentiment today.
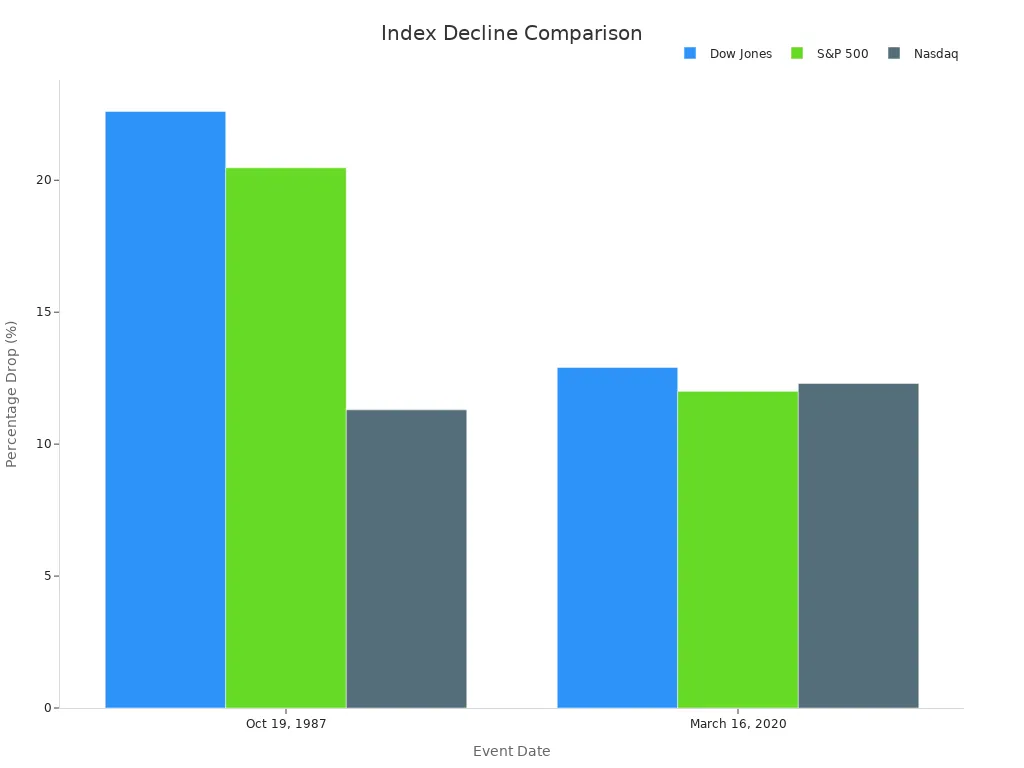
A side-by-side analysis shows the severity of the declines:
- Nasdaq: Largest percentage drop, led by technology and growth stocks.
- S&P 500: Moderate decline, reflecting broad market weakness.
- Dow: Smallest percentage drop, but still affected by overall market pressure.
The data confirms that the Nasdaq led the decline, with the S&P 500 and Dow following behind. This pattern matches previous periods of market stress, where technology stocks react more strongly to changes in investor sentiment.
Why Is Dow Down Today
Geopolitical Fears
Many investors ask, why is dow down today? Geopolitical fears played a major role in today’s market decline. Tensions in the Middle East and ongoing trade disputes between the United States and China increased concerns about global stability. Investors watched news from these regions and reacted quickly to any signs of escalation. When headlines suggested new risks, markets responded with sharp moves lower.
Why is dow down today? The answer often starts with investor concerns about how global events might affect the economy. Rising oil prices and supply chain disruptions added to the worries. These concerns made investors more cautious. They moved money out of stocks and into safer assets like U.S. Treasury bonds. The dow jones industrial average, along with the s&p 500 and Nasdaq, all felt the impact of these fears.
Interest rates also played a part. Central banks signaled that interest rates might stay higher for longer. This news increased concerns about borrowing costs and future growth. Why is dow down today? Higher interest rates can slow business investment and consumer spending. Investors saw these risks and adjusted their portfolios.
Sector Impact
Why is dow down today? The answer also lies in how different sectors reacted to the day’s news. Technology and growth stocks, which make up a large part of the Nasdaq, faced the biggest losses. These stocks often fall harder when concerns about interest rates and global events rise. The s&p 500 also dropped, showing that worries spread across many industries.
Industrials, financials, and consumer goods companies in the dow saw declines. These sectors depend on steady economic growth. When concerns about the future increase, investors sell shares in these companies. Why is dow down today? The broad impact across sectors shows that investor concerns reached every corner of the market.
Note: Investors should watch for updates on geopolitical tensions and interest rates. These factors will likely continue to drive market moves in the coming days.
Sector and Stock Highlights
Image Source: unsplash
Tech and Growth Stocks
Technology and growth stocks played the biggest role in today’s market decline. The Nasdaq, which holds many technology companies, saw the largest drop. Companies like Apple, Microsoft, and Nvidia lost significant value. Investors reacted to concerns about future earnings and rising costs. Technology stocks often show high price swings when market conditions change.
- Technology stocks have high price-earnings multiples. This makes them sensitive to changes in interest rates and economic news.
- Oil price increases can raise costs for tech companies, especially those that rely on shipping and data centers.
- Studies show that technology stocks react strongly to changes in oil prices, inflation, and interest rates. These factors increase volatility and lead to bigger drops during market stress.
- Growth stocks, which depend on strong future earnings, also fell sharply. Investors worry that higher borrowing costs will hurt these companies’ ability to grow.
Technology and growth stocks in the Nasdaq often lead market declines because they depend on strong earnings growth and are more sensitive to economic shocks.
Industrial and Broader Market
Industrial stocks and other sectors in the Dow and S&P 500 also contributed to the decline. Sectors like insurance, real estate, and energy faced direct impacts from recent economic disruptions. These sectors showed significant drops in stock prices.
| Sector | Impact Type | Market Reaction |
|---|---|---|
| Insurance | Direct | Large declines |
| Real Estate | Direct | Large declines |
| Energy | Resilience/Mixed | Declines, some mixed |
| Utilities | Resilience/Mixed | Mixed responses |
| Food | Indirect | Some gains |
| Transportation | Indirect | Some gains |
- Insurance and real estate stocks dropped due to increased claims and property damage.
- Energy stocks fell as supply disruptions and regulatory issues grew.
- Food and transportation stocks showed some gains, reflecting supply chain changes and higher demand.
- Tourism stocks dropped at first but later recovered, showing a complex pattern.
These sector-specific moves amplified the overall decline in the major indices. The varied responses show that each sector reacts differently to market shocks. Investors need to watch sector trends closely, as aggregate indices can hide these important details.
What It Means for Investors
Market Sentiment
Today’s stock market decline has shifted investor sentiment toward caution. Many investors now focus on risks tied to interest rates, economic data, and global concerns. The VIX, often called the fear gauge, has risen, showing that traders expect more volatility. High trading volume in the s&p 500 and Nasdaq signals strong reactions to recent news. Survey-based indices and closed-end fund discounts also point to growing uncertainty.
Market sentiment changes quickly. Short-term traders often react to headlines and sudden moves in the s&p 500. Long-term investors look at fundamentals, such as sector performance and economic data, before making decisions. The table below shows how different indicators reflect market sentiment and guide strategies:
| Market Data / Indicator | Role as Sentiment Proxy or Indicator | Strategic Implication |
|---|---|---|
| Trading volume | Shows investor enthusiasm and sentiment; higher volume often means more price swings. | Short-term traders use volume spikes to spot opportunities. |
| VIX (Volatility Index) | Measures expected market volatility, acting as a fear gauge. | Helps manage short-term risk and timing. |
| Dividend premium | Reflects optimism through valuation differences. | Long-term investors assess growth expectations. |
| Survey-based indices | Track consumer and investor confidence. | Useful for both short- and long-term outlooks. |
Next Steps
Investors face important choices after today’s performance. Short-term strategies may include reducing exposure to sectors most affected by interest rates and global concerns. High-frequency traders and technical investors often adjust positions quickly when volatility rises. Long-term investors may focus on sectors with strong fundamentals, such as industrials, which have broad participation across the global stock market.
The table below highlights the scale and diversity of major sectors, helping investors identify areas of strength:
| Sector | Market Cap (USD Trillions) | Global Market Share | Number of Firms | Concentration (Top 10 Firms) |
|---|---|---|---|---|
| Information Technology | 25.7 | 21% | 2,340 | 77% |
| Financials | 21.1 | 17% | 6,120 | 54% |
| Industrials | 15.3 | 12% | 8,780 | 36% |
Investors should monitor interest rates, economic data, and sector trends. Short-term strategies require agility to manage volatility. Long-term strategies benefit from analysis of sector fundamentals and market cycles. By understanding how sentiment and performance shift, investors can adapt to changing conditions and reduce risk.
Note: Staying informed about interest rates and economic data helps investors make better decisions in both the short and long term.
The Nasdaq led today’s market decline, with the S&P 500 and Dow also posting losses. Technology and growth stocks drove the sharpest drop. Geopolitical risks and interest rate concerns shaped investor sentiment. Investors can consider these next steps:
- Reassess financial goals as market conditions change.
- Explore fixed income options, which remain attractive with high interest rates.
- Expect equities to outperform bonds, but with a smaller margin.
- Monitor U.S. economic growth, forecasted at 2% real GDP over the next decade.
Will the market stabilize or see more volatility ahead? Investors should stay alert and review their strategies regularly.
FAQ
What caused the Nasdaq to lead today’s decline?
The Nasdaq dropped the most due to heavy selling in technology and growth stocks. Investors worried about higher interest rates and global tensions. These factors hit tech companies hardest, causing the index to fall more than the Dow or S&P 500.
How do geopolitical events affect the stock market?
Geopolitical events create uncertainty. Investors often sell stocks and move money to safer assets. Tensions in regions like the Middle East or trade issues with China can trigger sharp market declines, especially in sensitive sectors such as technology and energy.
Which sectors performed worst today?
Technology and growth sectors saw the largest losses. Insurance, real estate, and energy stocks also declined. The Dow’s industrial and financial companies faced pressure, but technology stocks in the Nasdaq experienced the steepest drops.
Should investors change their strategies after today’s decline?
Investors should review their portfolios. Many shift to sectors with stable earnings or consider fixed income options when volatility rises. Monitoring interest rates and global news helps guide decisions. Long-term investors often stay focused on fundamentals.
How does the S&P 500 reflect overall market health?
The S&P 500 tracks 500 large companies across many sectors. Its performance gives a broad view of the U.S. stock market. A decline in the S&P 500 signals widespread caution among investors, not just weakness in one sector.
Today’s market saw the Nasdaq drop 2.1% (370 points), leading the decline, driven by steep losses in technology and growth stocks. The S&P 500 fell 1.4%, and the Dow dipped 0.8%, reflecting investor caution amid geopolitical tensions and rising interest rates. Tech-heavy Nasdaq bore the brunt due to its sensitivity to economic shifts, while the Dow’s blue-chip stocks showed relative resilience. Ready to navigate these market swings? Sign up for BiyaPay in just 1 minute to invest in U.S. and Hong Kong stocks, empowering you to adapt swiftly. With BiyaPay, enjoy remittance fees as low as 0.5% across 190+ countries and fee-free conversion of 200+ digital currencies (e.g., USDT) to USD, HKD, and JPY. Stay vigilant on interest rates, global events, and sector trends to seize market opportunities.
Start your investment journey now! Join BiyaPay.
*This article is provided for general information purposes and does not constitute legal, tax or other professional advice from BiyaPay or its subsidiaries and its affiliates, and it is not intended as a substitute for obtaining advice from a financial advisor or any other professional.
We make no representations, warranties or warranties, express or implied, as to the accuracy, completeness or timeliness of the contents of this publication.


Contact Us
Company and Team
BiyaPay Products
Customer Services


is a broker-dealer registered with the U.S. Securities and Exchange Commission (SEC) (No.: 802-127417), member of the Financial Industry Regulatory Authority (FINRA) (CRD: 325027), member of the Securities Investor Protection Corporation (SIPC), and regulated by FINRA and SEC.
registered with the US Financial Crimes Enforcement Network (FinCEN), as a Money Services Business (MSB), registration number: 31000218637349, and regulated by FinCEN.
registered as Financial Service Provider (FSP number: FSP1007221) in New Zealand, and is a member of the Financial Dispute Resolution Scheme, a New Zealand independent dispute resolution service provider.