- EasyCard
- Trade
- Help
- Announcement
- Academy
- SWIFT Code
- Iban Number
- Referral
- Customer Service
- Blog
- Creator
Stock Market Forecast: Risks and Opportunities for Investors


Image Source: unsplash
The stock market forecast for the next six months suggests investors should prepare for continued volatility and a possible trading range. Recent data shows that the S&P 500 is near its February record high, while the Russell 2000 reveals bullish signals if resistance breaks.
- May U.S. CPI rose less than expected, but wage pressures remain high.
- GDP growth could exceed 3% in Q2 2025, and unemployment holds steady at 4.2%.
- Market volatility measures, such as the VIX and GARCH models, highlight ongoing risk but also early opportunity signals.
These trends from the first six months offer both caution and optimism for the stock market, setting the stage for careful analysis in the first six months ahead.
Key Takeaways
- The stock market will likely stay volatile but within a defined trading range over the next six months.
- Rising interest rates and inflation pose risks, especially for certain sectors, so investors should watch these closely.
- Earnings growth, especially in technology, offers promising opportunities despite some uncertainty.
- Diversifying investments across sectors and international markets helps reduce risk and improve returns.
- Using risk management tools and staying informed with real-time data can help investors navigate market changes successfully.
Stock Market Forecast

Image Source: pexels
Recent Trends
The stock market forecast for the next six months draws on a variety of recent trends and statistical signals. Analysts have observed that stock market benchmarks rebounded sharply after tariff-related declines, which demonstrates market resilience. Investors track market trends, sector leaders, and stock lists to understand momentum and sector performance. Rising profit estimates support a positive outlook for earnings, while relative strength at new highs signals strong stock performance and potential leadership.
- Stock market benchmarks have shown resilience after periods of volatility.
- Tracking sector leaders and stock lists helps investors spot momentum shifts.
- Psychological indicators provide insight into investor sentiment and market psychology.
- Rising profit estimates point to a favorable earnings outlook.
- Relative strength at new highs highlights potential market leadership.
- Research tools such as stock checkups, earnings previews, and industry snapshots are essential for ongoing analysis and risk assessment.
Empirical analysis of financial markets reveals that trending and reversion regimes depend on the time scale. Markets often trend over periods from hours to years, driven by investor herding. Shorter and longer time frames show reversion to intrinsic values. During the COVID-19 pandemic, both the USA and UK experienced sharp declines followed by recovery, with increased volatility and herding behavior. Advances in econometric methods, including machine learning and big data analytics, have improved the ability to analyze and forecast market dynamics. Recent increases in trading activity, especially from institutional investors and quantitative strategies, have led to higher turnover and improved market efficiency.
Trading Range Expectations
The stock market forecast also highlights the likelihood of a defined trading range in the coming months. Pre-market futures trading ranges, combined with the previous day’s official market range, give traders a framework to anticipate intraday price boundaries. However, these ranges are not definitive predictors, as news, economic releases, and earnings reports can influence daily outcomes.
- Bollinger Bands and Average True Range (ATR) help identify stable trading ranges by providing dynamic support and resistance levels.
- A stable trading range is indicated when Bollinger Bands move in parallel and ATR remains flat.
- Volume analysis at range boundaries confirms the strength of support and resistance.
- Stop-loss orders are placed outside the trading range based on ATR to manage risk.
- Profit targets are set within the range, respecting support and resistance.
- Psychological discipline is essential to avoid impulsive trades outside the range.
- Traders monitor for breakouts or fakeouts and adapt strategies as needed.
- Pre-market futures and previous day’s trading ranges offer practical intraday references, though they remain sensitive to external events.
Empirical evidence from China shows that after adjustments to the trading range, there are immediate increases in price delay and idiosyncratic volatility, along with reductions in price synchronicity. These changes support the expectation that stocks operate within defined trading ranges, although external factors can cause shifts. Investors should remain alert to potential breakouts or breakdowns, as these can signal changes in the broader stock market forecast.
Key Risks
Interest Rates
Interest rates play a critical role in shaping stock market performance. When interest rates rise unexpectedly, stock returns often decline, especially in sectors like Consumer Staples, Health Care, and Utilities. These sectors show a strong negative relationship with sudden increases in both nominal and real interest rates. Some industries, such as Integrated Oil and Gas or Diversified Metals and Mining, may benefit from rising rates, serving as potential safe havens. The relationship between interest rates and stock returns depends on economic conditions and sector characteristics. Investors should monitor interest rate trends closely, as higher rates can increase recession risk and lead to greater portfolio fluctuations.
Inflation
Inflation remains a persistent concern for investors. Recent data shows consumer inflation at 2.8%, above the Federal Reserve’s 2% target. This elevated level reduces the value of future earnings and increases market volatility. Companies face tough pricing decisions, which can squeeze profit margins and cause stock prices to fluctuate. High inflation often leads to higher interest rates, further decreasing stock valuations. Investor sentiment weakens as inflation rises, increasing the risk of unpredictable market movements. Inflation, combined with other macroeconomic factors, can heighten recession risk and challenge portfolio stability.
Geopolitics
Geopolitical risks have a direct impact on market performance. Events such as global trade protectionism, regional conflicts, and cyber attacks can trigger sharp declines in equity markets. BlackRock’s Geopolitical Risk Dashboard tracks the top risks affecting assets and provides a scenario-based framework for assessing their impact. Empirical studies show that actual geopolitical acts, like the Russia–Ukraine conflict, cause significant volatility and capital flight, especially in regions with high energy dependence or economic uncertainty. These risks can also affect currency values and international investment flows, making geopolitical awareness essential for investors.
Sector Volatility
Sector volatility contributes significantly to overall market risk. Different industries respond uniquely to economic and geopolitical shocks. For example, energy consumption patterns and industrial activity can drive volatility in specific sectors. Research shows that sector-specific volatility, shaped by factors like inflation and geopolitical events, aggregates to influence broader market risk. Investors should use high-quality market data to track these changes and adjust their portfolios accordingly. Understanding sector volatility helps investors manage exposure and respond to shifting market conditions.
Opportunities Next Six Months
Image Source: pexels
Earnings Growth
Analysts expect positive earnings growth to continue as a key opportunity for investors. Management guidance for earnings before interest and taxes (EBIT) often shows a strong link to actual results. Statistical models reveal that realized EBIT growth usually exceeds management forecasts, with a coefficient of 1.4 and a t-statistic of 65, indicating a significant relationship. However, these models also show that much of the variation in earnings remains unexplained, highlighting the need for caution. Market data, such as South Korean export activity, supports forecasts for high-single-digit earnings growth in technology and other leading sectors. The technology sector is projected to drive about half of the S&P 500’s earnings per share growth in 2025. Analysts predict mid-to-high single-digit earnings growth for the S&P 500, slightly below consensus, reflecting both optimism and uncertainty. Statistical methods, including regression analysis, help separate true growth signals from noise, giving investors a more reliable outlook.
Note: While forecasts provide useful signals, investors should remember that earnings growth does not always translate directly into stock returns.
Value and Growth Sectors
The first six months of the year have shown that both value and growth sectors offer unique opportunities. Value stocks, often priced lower than the market, tend to have lower price-to-earnings ratios and pay higher dividends. Growth stocks, on the other hand, usually have higher earnings growth rates and greater volatility. Historical data shows that value stocks outperformed growth stocks over long periods, especially during bear markets and recessions. In contrast, growth stocks excelled during bull markets and economic expansions. For example, a small-cap growth fund consistently outperformed the Russell 2000 Growth Index in every five-year rolling period since its inception. Investors can use the table below to compare key features:
| Aspect | Value Stocks | Growth Stocks |
|---|---|---|
| Price | Typically undervalued, priced lower than market | Often overvalued, priced higher than market |
| Earnings | Lower price-to-earnings (P/E) ratios | Higher earnings growth rates |
| Risk and Volatility | Generally lower risk and volatility | Higher risk and volatility |
| Dividends | Tend to pay higher dividends | Usually pay low or no dividends |
Market cycles influence which sector performs better, so investors should monitor trends and adjust their portfolios as needed.
International Diversification
International diversification remains a powerful tool for reducing portfolio risk. Research shows that spreading investments across major markets like the U.S., Japan, and the U.K. increases risk-adjusted returns. This benefit is especially strong for investors in developing countries or those facing high country risk. Diversification helps avoid large losses from local economic or political downturns. Even as market correlations rise, international diversification still offers advantages if investors measure correlations accurately and optimize their portfolios. Emerging and regional markets also provide extra benefits, further lowering risk.
- Diversification across countries and regions reduces exposure to country-specific shocks.
- Empirical studies confirm that international diversification improves risk-adjusted returns.
- Investors gain the most when they include markets with different risk profiles.
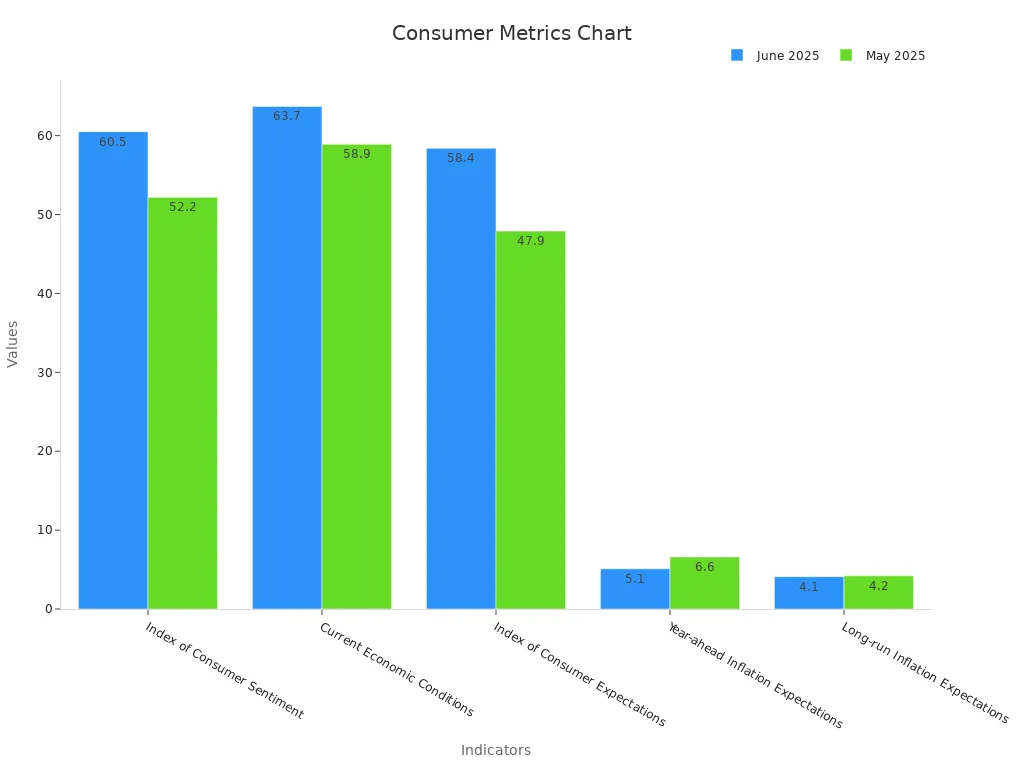
The first six months of the year have highlighted the value of a global approach, as economic optimism and consumer sentiment improved across several regions. Investors who diversify internationally position themselves to capture growth and reduce risk in the next six months.
Economic Indicators
Fed Policy
Federal Reserve policy decisions shape the direction of financial markets. The Atlanta Fed’s Market Probability Tracker offers daily insights into market expectations for future interest rate moves. This tool uses options prices linked to the Secured Overnight Financing Rate (SOFR) to reflect investor sentiment. The Federal Reserve has shifted from providing explicit forward guidance to making decisions on a meeting-by-meeting basis. Chair Jerome Powell explained this change as a response to evolving economic conditions. The Fed also manages its balance sheet by adjusting monthly caps on Treasury and agency securities redemptions. For example, the Treasury cap will drop to $5 billion by April 2025. Investors expect the Fed to remain patient, with possible rate cuts in 2025 if economic data supports such moves. These policy changes influence borrowing costs, liquidity, and overall market behavior.
GDP and Jobs Data
Economic indicators such as GDP and employment figures provide a statistical basis for understanding market conditions. The U.S. Department of Commerce reports GDP quarterly, measuring economic production and standard of living. Labor market data, including nonfarm payrolls and the unemployment rate, come from the U.S. Department of Labor. Since 1948, a 1% increase in real GDP growth has led to about a 6% rise in S&P 500 earnings. Consumer spending, which makes up nearly 70% of GDP, drives economic momentum. Recent data shows slowing payroll growth and a modest rise in unemployment, signaling a normalization in the labor market. Other important economic indicators include:
- Monthly and quarterly data on construction, housing, international trade, retail, wholesale, services, and manufacturing.
- Inflation measures like the Consumer Price Index (CPI) and Producer Price Index (PPI).
- Consumer confidence indexes and retail sales data.
- Durable goods orders and Purchasing Managers’ Indexes (PMI).
These measures help investors analyze performance and make informed decisions.
Market Corrections
Market corrections, defined as declines of 10% or more, occur regularly. Since World War II, corrections have averaged about 14.3%. Markets usually recover within months, often reaching higher support levels after each correction. For example, the S&P 500 has risen an average of over 8% one month after a correction bottom and more than 24% one year later. Between 2002 and 2021, corrections happened in half of all years, with an average pullback of 15%. Despite these setbacks, stocks posted positive returns in most years. Bear markets, which involve declines of 20% or more, are less common and last about 15 months on average. Most corrections do not lead to bear markets, showing that temporary declines are part of a long-term growth trend.
Stock Market Outlook & Strategies
The stock market outlook for the next six months points to a balanced environment. Analysts expect the market to stay within a defined range, with recent highs near 6,000 and lows around 4,835. Earnings growth should remain positive but slower, with forecasts near 7% for 2025. Interest rates and rising bond yields may limit gains by putting pressure on price-earnings ratios. Risks from tariffs and higher yields could cap rallies, but fiscal support and strong market levels may help prevent sharp declines. Historical patterns show that even in a trading range, brief moves above or below these levels can occur. Investors should prepare for both upside and downside scenarios.
Diversification
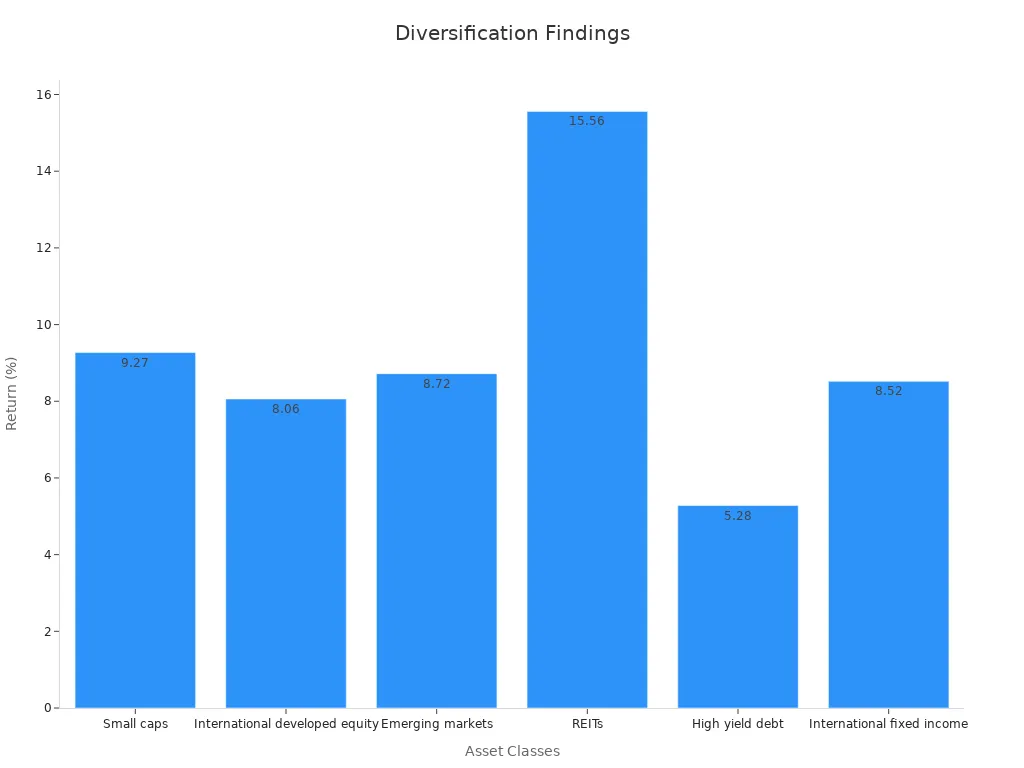
Diversification remains a core strategy for managing risk in the stock market. Research from DALBAR and J.P. Morgan Asset Management shows that investors who try to time the market often miss rebounds and underperform. Diversified portfolios help reduce the urge to sell during downturns, leading to better long-term results. Adding different asset classes, such as small caps, international stocks, and real estate, can improve returns and lower risk. For example, in a recent quarter, small caps gained 9.27%, international developed equity rose 8.06%, and REITs climbed 15.56%. Diversification also reduces sector and individual stock risk, helping investors avoid large losses from one area.
Tip: Diversification works best when investors combine it with disciplined asset allocation and avoid emotional decisions.
Sector Rotation
Sector rotation allows investors to adapt to changing market conditions. Over the past ten years, the difference between the best and worst-performing sectors averaged 35-40%. In 2020, technology gained 43.9%, while energy lost 33.7%. In 2022, energy surged 59%, but communication services fell 40%. By rotating into leading sectors, investors can capture gains and reduce losses. Defensive sectors like utilities and healthcare often outperform during downturns, while consumer discretionary and technology lead in recoveries. Models like the iQ Sector Rotation Model select sectors with the lowest drawdowns, helping protect capital and improve returns.
| Year | Top Sector (%) | Bottom Sector (%) | Spread (%) |
|---|---|---|---|
| 2020 | Technology (+43.9) | Energy (-33.7) | 77.6 |
| 2022 | Energy (+59) | Communication Services (-40) | 99 |
Risk Management
Robust risk management is essential for portfolio resilience. Advanced metrics, such as AlphaSharpe, improve risk-adjusted returns by considering downside risk and adapting to market changes. Studies show that portfolios using these metrics achieve Sharpe Ratios up to 100% higher than traditional methods. Risk management frameworks use tools like stop-loss orders, hedging, and robust optimization to protect capital. These approaches help investors handle uncertainty and maintain stable returns, even in volatile markets. Selecting the right risk measures and updating strategies regularly can make portfolios stronger and more adaptable.
The next six months present both risks and opportunities for investors.
- Investor’s Business Daily offers trend data, curated stock lists, and actionable insights to help identify market opportunities.
- Scientific research shows that geopolitical and climate risks drive volatility, making market conditions unpredictable.
Staying informed and flexible remains essential.
- Real-time data and analytics support timely decisions.
- Portfolio monitoring and risk management tools help investors adapt strategies.
- Scenario analysis prepares investors for changing market conditions.
Investors who use these resources can better navigate uncertainty and pursue long-term growth.
FAQ
What is a trading range in the stock market?
A trading range describes the price area where a stock or index moves between support and resistance. Investors use tools like Bollinger Bands to identify these levels. This helps them set buy and sell points.
How do interest rates affect stock prices?
Higher interest rates often lower stock prices. Companies face higher borrowing costs, which can reduce profits. Sectors like Utilities and Health Care usually react more to rate changes than others.
Why is diversification important for investors?
Diversification spreads investments across different assets. This reduces risk if one area performs poorly. Investors can include stocks, bonds, and international markets for better stability.
What should investors watch for during market corrections?
Investors should monitor support levels and avoid panic selling. Market corrections happen often but usually recover. Using stop-loss orders and reviewing asset allocation can help manage risk.
How can international diversification benefit a portfolio?
International diversification lowers exposure to risks in one country. Investors who add stocks from the U.S., Japan, or China can improve returns and reduce losses from local events.
The stock market forecast for the next six months signals a mix of challenges and opportunities. Expect volatility within a trading range, with the S&P 500 near 6,000 and potential for growth if the Russell 2000 breaks resistance. Rising interest rates and 2.8% inflation pose risks, particularly for sectors like Utilities and Health Care, but technology’s earnings growth offers promise, with mid-to-high single-digit gains projected. Diversifying across sectors and international markets, like Japan and the U.K., can reduce risk and boost returns. Ready to navigate this market? Sign up for a BiyaPay account in just 1 minute to invest in U.S. and Hong Kong stocks effortlessly. With BiyaPay, enjoy low 0.5% remittance fees across 190+ countries and fee-free conversions of 200+ digital currencies (e.g., USDT to USD). Use risk management tools like stop-loss orders and stay informed to seize opportunities. Start building your resilient portfolio today!
Take control of your investments now! Join BiyaPay.
*This article is provided for general information purposes and does not constitute legal, tax or other professional advice from BiyaPay or its subsidiaries and its affiliates, and it is not intended as a substitute for obtaining advice from a financial advisor or any other professional.
We make no representations, warranties or warranties, express or implied, as to the accuracy, completeness or timeliness of the contents of this publication.


Contact Us
Company and Team
BiyaPay Products
Customer Services


is a broker-dealer registered with the U.S. Securities and Exchange Commission (SEC) (No.: 802-127417), member of the Financial Industry Regulatory Authority (FINRA) (CRD: 325027), member of the Securities Investor Protection Corporation (SIPC), and regulated by FINRA and SEC.
registered with the US Financial Crimes Enforcement Network (FinCEN), as a Money Services Business (MSB), registration number: 31000218637349, and regulated by FinCEN.
registered as Financial Service Provider (FSP number: FSP1007221) in New Zealand, and is a member of the Financial Dispute Resolution Scheme, a New Zealand independent dispute resolution service provider.