- EasyCard
- Trade
- Help
- Announcement
- Academy
- SWIFT Code
- Iban Number
- Referral
- Customer Service
- Blog
- Creator
What the Japan Stock Crash Means for Investors Worldwide


Image Source: pexels
The japan stock crash in 2024 has sent shockwaves through global markets, making many investors question how much risk they hold and where new opportunities might arise. Some worry about the direct impact on their portfolios, while others focus on the increased uncertainty. Regression studies show that Japanese stock returns drop sharply when economic policy uncertainty spikes, and global crises often link Japan’s market more closely with the US.
This chart highlights that younger investors and men have taken on more risk, especially since 2020, showing how different groups respond to market shocks.
Key Takeaways
- The Japan stock crash in 2024 was triggered by the Bank of Japan raising interest rates and the rapid unwinding of yen carry trades, causing sharp declines in Japanese and global markets.
- Global markets reacted quickly, with technology, financial, and export-sensitive sectors facing the most pressure, showing how interconnected markets can spread risk worldwide.
- Investor sentiment shifted toward caution, leading to increased selling and portfolio rebalancing toward safer assets like government bonds and gold.
- Japan’s stock market offers potential value due to low price-to-book ratios and improving corporate earnings, but investors should balance this with signs of overall market overvaluation.
- Diversifying investments across asset classes, sectors, and regions remains essential to manage risk and build resilience against future market shocks.
Global Impact

Image Source: pexels
Key Takeaways for Investors
Investors often look to history for guidance during turbulent times. Past stock market crashes show that sharp declines can happen quickly, but recovery may also follow. The table below compares major crashes and highlights important lessons:
| Crash/Event | Key Numerical Measures | Investor Takeaway Summary |
|---|---|---|
| 1987 Crash | - DJIA fell 12.8% on Black Monday- 23% cumulative drop over two days- Full recovery in 2 years- S&P 500 P/E ratio at 23 (postwar average 14.5) | Highlights severity of drop, relatively quick recovery, and overvaluation before crash |
| 2008 Financial Crisis | - BSE Sensex dropped from >21,000 to <8,000 points within 10 months | Demonstrates sharp decline magnitude and rapid market impact |
These numbers remind investors that while the immediate impact of a crash can feel overwhelming, markets have shown resilience over time. Quick drops often lead to new opportunities for those who stay informed and patient.
Market Reactions Worldwide
Stock markets around the world responded quickly to the Japan stock crash. Many investors watched global indices fall as uncertainty spread. Nasdaq’s report, “8 Charts Every Investor Needs to See When Markets Crash,” provides a detailed look at how stocks, options, ETFs, indexes, cryptocurrencies, and fixed income assets reacted. This report helps investors understand the broad impact across different asset classes.
- The Statista chart, “Trump Tariffs Cause Global Market Meltdown,” shows how global stock indices performed since January 20, 2025. The chart highlights the worldwide downturn and gives a clear picture of how international markets moved together during the crisis.
- U.S. and European markets saw increased volatility, with technology and financial stocks leading the declines.
- Investors in China and Hong Kong also felt the effects, especially in sectors tied to exports and currency movements.
These reactions underline how closely connected global markets have become. A single event in Japan can now influence portfolios and investor sentiment worldwide.
Japan Stock Crash: Causes
BOJ Rate Hike
The Bank of Japan surprised global markets in August 2024 by raising its short-term policy rate from 0.1% to 0.25%. This marked the highest level since 2008 and signaled a major shift in monetary policy. The central bank also announced plans to reduce monthly Japanese government bond purchases to 3 trillion yen by early 2026, cutting its balance sheet by up to 8%. The decision followed a 7-2 board vote and came after a combined 35 basis points increase over four months.
This unexpected move increased the cost of borrowing in Japanese yen. Companies that relied on low-cost financing faced higher interest expenses. Sectors such as real estate and export-driven industries saw immediate selloffs. Foreign institutional investors experienced declines in portfolio values as bond yields rose. The yen appreciated more than 1% to 150.61 per dollar, and short-term bond yields reached 15-year highs. Japanese bank shares surged, helping the market recover some early losses. The Bank of Japan’s governor indicated readiness for further rate hikes if inflation and economic data support the outlook.
The table below summarizes key statistics related to the rate hike and its immediate effects:
| Aspect | Quantitative Detail |
|---|---|
| Interest Rate Hike | Raised short-term policy rate by 15 basis points to 0.15%-0.25% |
| Bond Purchase Tapering | Monthly JGB purchases to be reduced to 3 trillion yen by early 2026 |
| Yen Movement | Rose over 1% to 150.61 per dollar |
| Short-term Bond Yields | Reached 15-year highs |
| Nikkei 225 Volatility | Increased sharply after announcement |
| Sector Impact | Selloffs in sectors dependent on low-cost financing |
This policy change triggered a chain reaction in the financial system. The japan stock crash began as investors adjusted to the new environment of higher rates and tighter liquidity.
Yen Carry Trade Unwind
The yen carry trade played a central role in the japan stock crash. For years, investors borrowed yen at low interest rates and invested in higher-yielding assets abroad. When the Bank of Japan raised rates, the profitability of this strategy dropped sharply. Investors rushed to unwind their positions, buying back yen and selling foreign assets. This caused the yen to appreciate quickly and led to a wave of margin calls.
The unwinding of the carry trade triggered a 12.4% drop in the Nikkei index, the largest one-day decline since 1987. Margin calls and rapid asset sell-offs created a feedback loop, amplifying volatility across global markets. The S&P Global Broad Market Index fell 3.3%, its worst day in over two years. The Tokyo Stock Price Index dropped 20% over three days, and the Bloomberg Galaxy Crypto Index tumbled 17.5%. The yen appreciated over 10% against the U.S. dollar, putting additional pressure on global markets.
- Nikkei 225 experienced its steepest one-day decline since 1987.
- The Nikkei 225 dropped 12.4% during the crisis.
- S&P Global Broad Market Index retreated 3.3%.
- Tokyo Stock Price Index fell 20% over three days.
- Bloomberg Galaxy Crypto Index dropped 17.5%.
- Margin calls and rapid asset sell-offs increased volatility.
This sequence of events echoed patterns seen in previous financial crises. The table below provides historical context for the nikkei index and its past volatility:
| Factor | Statistic / Description |
|---|---|
| Nikkei 225 Index Peak | Reached 38,921 on January 4, 1990 |
| Nikkei 225 Index Low (1990) | Dropped to 21,902 by December 5, 1990, a loss of over 43% within one year |
| Nikkei 225 Index Low (1992) | Further declined to 14,338 on August 19, 1992 |
| Stock Price Increase (1985-1989) | Nikkei 225 rose over 224% from 1985 to December 1989, driven by rising land prices and speculative activity |
| Economic Impact | Burst of bubble led to prolonged economic stagnation known as the Lost Decade |
The 2024 japan stock crash stands out as a historic meltdown, with its roots in both monetary policy shifts and the rapid unwinding of leveraged trades. The combination of higher rates and a stronger yen forced investors to reassess risk, leading to sharp declines in Japanese and global markets.
Transmission Mechanisms
Currency Volatility
Currency volatility acts as a primary channel for spreading the effects of the Japan stock crash to global markets. When the yen surged against the U.S. dollar, investors around the world faced sudden changes in asset values. Companies with international operations, especially those with exposure to China and the United States, saw their stock returns drop. This happened because global value chain linkages transmit shocks quickly across borders.
Research shows that economic and political uncertainty increases volatility in both traditional and digital currencies. For example:
- The Economic Policy Uncertainty (EPU) Index rises during market turmoil, leading to higher volatility in assets like Bitcoin.
- The Volatility Index (VIX) predicts spikes in market volatility, which often coincide with increased returns in cryptocurrencies as investors seek safe havens.
- Investor sentiment, especially during crises, links closely to risks of stock market crashes and drives currency swings.
- Political events, such as elections or regulatory changes, can further amplify currency market movements.
During the Japan stock crash, these factors combined to create sharp moves in the yen and other major currencies. Investors responded by adjusting their positions, which increased trading volumes and price swings across global markets.
Liquidity Shifts
Liquidity shifts represent another key transmission mechanism. When the Bank of Japan raised rates, funding costs in yen increased. This forced investors to unwind leveraged positions, leading to a rapid withdrawal of liquidity from both Japanese and international markets.
Effective liquidity management relies on forward-looking tools such as cash flow projections, scenario analyses, and contingency funding plans. These methods help banks and investors prepare for sudden liquidity shortfalls during stress events.
Quantitative data from sources like the BIS Locational Banking Statistics and International Debt Securities Statistics reveal how global liquidity responds to shocks. After the Japan stock crash, cross-border bank loans and international bond flows showed heightened sensitivity to global risk conditions. These shifts mirrored patterns seen during previous crises, such as the 2013 Fed taper tantrum, when liquidity dried up quickly in response to policy changes.
Global Market Selloff
Image Source: unsplash
Contagion Effects
The japan stock crash triggered a global mini-crash, spreading volatility across financial markets. Investors witnessed a rapid transmission of risk, similar to the contagion seen during the COVID-19 pandemic. When the pandemic struck in early 2020, stock markets worldwide fell sharply. Investors moved capital into resilient sectors like healthcare and technology, showing how shocks in one region can quickly affect others. The recent global market selloff followed a similar pattern, with investors unwinding positions and rotating into perceived safe havens.
Dynamic net total directional connectedness figures reveal the strength and direction of contagion between financial and commodity markets. Internal spillover effects within financial markets proved stronger than those in commodity markets. Spillover from financial markets to commodities also exceeded the reverse. The dynamic block spillover index confirmed that spillover effects within markets surpassed those between markets, highlighting the severity of contagion and cross-market interactions.
Emerging and developing economies experienced more severe contagion effects than developed economies. During periods of heightened uncertainty, such as the Delta and Omicron COVID-19 waves, financial risk contagion intensified. Effective government responses and policy measures helped contain some of these spillovers, but the overall impact remained significant.
Sector-specific events also demonstrate targeted contagion. For example, after the Space Shuttle Challenger explosion, stocks of NASA contractors dropped, especially those most reliant on NASA revenues. Industrial incidents with injuries or fatalities led to contagion across related firms, with smaller competitors facing increased volatility. These patterns show that market shocks can produce both broad and targeted contagion, depending on the nature of the event.
A global mini-crash often follows a major event like the japan stock crash. Investors react quickly, causing sharp declines in global indices. The market meltdown in Japan set off a chain reaction, with technology and financial stocks leading the declines in other regions.
Sector Impacts
The japan stock crash had a pronounced impact on specific sectors, especially those sensitive to currency movements and global trade. Technology, financials, and yen-sensitive stocks faced the most pressure during the global mini-crash. The tech sector, for example, saw a 3.8% decline, outpacing the broader market’s 3% drop. Semiconductor stocks showed mixed results, with some rising and others falling sharply as investors adjusted their portfolios.
The table below provides a snapshot of sector and regional impacts:
| Sector / Region | Key Quantitative Indicators Related to Japan Crash Impact |
|---|---|
| Motor Vehicles & Parts | Export boom in Japan; output increase >5% in scenario 2 |
| US bilateral deficit with Japan in this sector falls nearly $8 billion (one-third of US-Japan trade balance deterioration) | |
| Global sectoral trade balance increase >$26 billion in scenario 3 | |
| Machinery | Output depressed in Japan and US due to Asia crisis |
| US net exports decline by >$14 billion in machinery sector | |
| US output falls nearly 6% in scenario 3 | |
| Electronics | US output falls nearly 5% in scenario 3 |
| Services | Trade balance increases due to yen depreciation suppressing imports |
| Other Transportation | Output increases nearly 14% in scenario 3 |
| US Trade Deficit | Increases by $58 billion overall in scenario 2 |
| Japan Trade Surplus | Reduces by $33 billion due to Asian crisis (scenario 1) |
| Swings nearly $90 billion due to yen depreciation and contraction (scenario 2) | |
| Developing Asia | Trade balance improvements partly reversed by yen depreciation and Japan contraction |
Technology and electronics manufacturers in Japan and the United States faced weakness due to fears of a global economic slowdown. A stronger yen reduced earnings potential for exporter stocks, causing further declines. The Nikkei 225 index dropped sharply, with yen-sensitive sectors experiencing the most volatility. Financial stocks also suffered as macroeconomic uncertainty and interest rate shifts weighed on earnings outlooks.
Note: Despite the short-term turmoil, some investors view the selloff as a potential buying opportunity for Japanese equities, especially if long-term fundamentals remain strong.
Compared to historic crashes, the global effects of the japan stock crash were modest but still notable. The global mini-crash did not reach the scale of the 2008 financial crisis or the 1987 Black Monday, but it served as a reminder of how interconnected markets have become. Investors must remain vigilant, as even a localized market meltdown can ripple across the world and reshape sector performance.
Investor Sentiment
Risk Aversion
Investor sentiment shifted sharply after the Japan stock crash. Many investors moved from optimism to caution, reacting strongly to negative news. This change led to increased selling and amplified stock market weakness. Behavioral biases played a major role in this shift.
- Loss aversion caused investors to feel losses more deeply than gains, leading to quick selling.
- Herding behavior made many follow the crowd, increasing downward pressure on prices.
- Overconfidence bias faded, and fear took over, causing rapid changes in sentiment.
- Advanced tools like AI and big data now track real-time changes in investor mood using social media and news.
Recent data supports this trend. The Cboe VIX, a measure of market volatility, spiked to 30, its highest level since the last global market rout. Treasury yields fell as investors rushed to safer assets. Jobless claims rose, and inflation stayed above the Federal Reserve’s target, adding to uncertainty. Geopolitical tensions, such as conflicts in the Middle East and U.S.-China trade sanctions, pushed more investors toward gold and U.S. Treasuries.
| Evidence Type | Description |
|---|---|
| Survey Data | Risk premium for risky assets rose from $1,000 to $2,500 USD. Fraction of risk-averse investors jumped from 16% to 43%. |
| Wealth Channel Analysis | Larger losses led to greater risk aversion, but even those without losses became more cautious. |
| Emotion/Fear Channel (Lab) | Experiments showed fear increased risk aversion by 27%. |
Portfolio Rebalancing
As risk aversion increased, investors began to rebalance their portfolios. Many sold risky assets and shifted to safer investments. Trading volumes on the S&P 500 nearly doubled the historical average during periods of uncertainty. Investors often overweighted recent negative news, which worsened sentiment and confidence.
- Investors moved funds from growth stocks, especially in technology, to government bonds and gold.
- Diversification strategies became less effective as asset class correlations increased.
- Behavioral interventions, such as automatic contributions and pre-commitment plans, helped some investors avoid emotional decisions.
Firm-level studies found that investor sentiment had a stronger effect on short-term stock returns when uncertainty was high. Sentiment-based trading strategies performed better during these times. Historical data shows that even after sharp corrections, markets can recover, but only if investors manage their emotions and adapt to changing market conditions.
Opportunities and Risks
Valuations in Japan
Japan’s equity market presents a unique landscape for investors seeking value during turbulent times. The price-to-book ratio in Japan trades at a 70% discount compared to the United States. Historically, such a discount has signaled strong future returns. Japanese companies have shown improving profitability, with corporate earnings per share growing 185% over the last decade, outpacing the 98% growth seen in the United States. The yen remains undervalued by 40-50%, which boosts export competitiveness and supports corporate profits. Japanese corporations reported a 16.9% sales growth, while S&P 500 companies saw only 3.9%.
Japanese stocks also trade at attractive valuation multiples. The Nikkei 225 EBITDA multiple stands at 9.5x, much lower than the S&P 500’s 16.4x. This gap highlights potential for margin expansion. Ultra-low interest rates, with leveraged buyout financing costs around 2-3%, have fueled robust M&A activity. In 2024, Japan recorded over USD 230 billion in deals, marking a 44% increase and the busiest year since 1985. Corporate governance reforms, such as more outside directors and a focus on profitability, have further improved the investment climate.
However, some financial ratios suggest caution. The table below summarizes key metrics:
| Financial Ratio / Metric | Value for Japan | Historical 20-Year Mean | Valuation Zone | Expected Annual Return Contribution |
|---|---|---|---|---|
| Total Market Cap / GDP (Buffett Indicator) | 176.47% | 102.58% | Significantly Overvalued | -6.56% |
| Modified Market Cap / (GDP + Central Bank Assets) | 80.08% | 59.82% | Significantly Overvalued | -3.58% |
| Dividend Yield (ETF EWJ) | 2.29% | N/A | N/A | +2.29% |
| GDP Growth Rate | 1.28% | N/A | N/A | +1.28% |
| Expected Overall Return (Original Model) | N/A | N/A | N/A | -3.0% per year |
| Expected Overall Return (Modified Model) | N/A | N/A | N/A | ~0.0% per year |
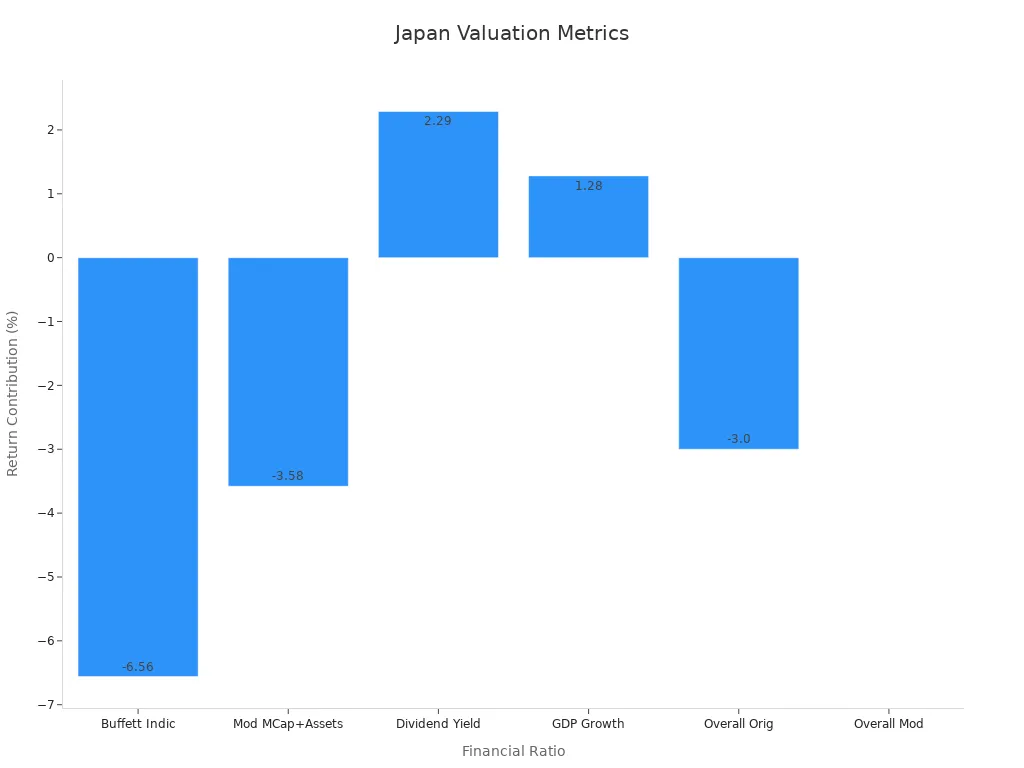
Investors should weigh both the attractive valuations and the signals of overvaluation from market-wide indicators before making decisions.
Diversification Strategies
Diversification remains a key strategy for managing risk during market crashes. Cross-asset portfolios that include the S&P 500, gold, oil, and U.S. Treasury bonds have provided strong protection in past crises, such as the dot-com bubble and the Great Recession. Gold often acts as a hedge against inflation and market downturns. Combining gold with oil can increase returns and reduce risk. U.S. Treasury securities serve as low-risk, liquid safe havens that tend to appreciate during periods of stress.
- Defensive sector diversification, such as investing in consumer staples or utilities, helps offset losses within a portfolio.
- Hard assets like real estate offer tangible value and income streams, often moving independently from stocks.
- Options strategies, including buying put options, allow investors to hedge against losses, though these require advanced knowledge and come with costs.
- Inverse ETFs can profit from market declines but suit only experienced traders.
A long-term study of U.S. firms found that both related and unrelated diversification at the corporate level significantly reduce stock price crash risk. This effect depends on factors like excess labor, inventory, and managerial ability. While international stock diversification has become less effective due to rising correlations, cross-asset and sector diversification continue to offer meaningful protection.
Building a diversified portfolio across asset classes and sectors can help investors weather market shocks and reduce the risk of large losses.
Lessons Learned
Monitoring Global Links
Investors have learned that global financial systems connect more closely than ever. A shock in one market can quickly affect others. To track these connections, experts use several indicators. Correlation coefficients measure how closely stock indices move together. Distance metrics help build network maps that show which markets link most tightly. Complex networks, such as threshold networks and minimum spanning trees, reveal the structure of these connections.
| Indicator Type | Description | Role in Monitoring Interconnected Financial Systems |
|---|---|---|
| Correlation Coefficients | Measures relationships between pairs of stock indices | Quantifies strength of market connections |
| Distance Metrics from Correlations | Converts correlations into distances for network analysis | Builds network maps and identifies key links |
| Complex Networks (MSTs, Thresholds) | Network structures from distance data | Shows market topology and closeness |
| Topological Data Analysis Tools | Tracks changes in network shape over time | Detects crisis points and systemic risk changes |
| Econometric Connectedness Measures | Measures volatility spillovers and interdependencies | Analyzes systemic risk and market interconnections |
| Geographic Aggregation Effects | Observes stable links among nearby markets | Explains regional clustering and risk spread |
These tools help investors spot early warning signs. By monitoring these indicators, investors can respond faster to global shocks and protect their portfolios.
Building Resilience
Building resilience means preparing for shocks before they happen. After the 2007-08 crisis, experts saw that strong crisis management and operational continuity kept banks running. The UK’s Banking Act 2009 introduced recovery plans, known as “living wills,” to help banks maintain key services during trouble. These reforms, along with better capital rules and deposit protection, have made banks safer and boosted investor confidence.
Resilient firms often show strong long-term performance, stable home-market positions, and simple product lines. Investors should look for these traits when choosing where to invest. Redundancy also plays a key role. For example, Toyota kept extra stocks of key parts, which helped it survive supply chain shocks during the COVID-19 pandemic.
Key benchmarks for financial resilience include:
| Metric | Recommended Benchmark | Purpose |
|---|---|---|
| Emergency Fund Coverage | 3-6 months of expenses | Provides liquidity during downturns |
| Debt-to-Income Ratio | Below 36% | Keeps debt manageable |
| Monthly Savings Rate | At least 20% of net income | Builds a financial buffer |
| Portfolio Diversity | Multiple asset classes | Reduces risk and volatility |
Investors should also watch indicators like GDP contraction, the VIX, and unemployment rates. These measures help track the severity of downturns and guide recovery strategies. By focusing on long-term stability and using these benchmarks, investors can better withstand future market shocks.
The Japan stock crash highlights the need for investors to monitor global financial systems and adapt quickly. Key performance indicators such as ROI, Sharpe Ratio, and Beta help track risk and returns.
- Stress testing and scenario analysis support better forecasting.
- Advanced technologies like AI and real-time analytics improve decision-making.
Investors can protect portfolios and find new opportunities by following these steps:
- Diversify across asset classes, sectors, and regions.
- Use risk management tools such as stop-loss orders and hedging.
- Rebalance portfolios regularly and stay alert to market changes.
Ongoing vigilance and learning from market shocks remain essential for long-term success.
FAQ
What triggered the Japan stock crash in 2024?
The Bank of Japan raised interest rates unexpectedly. Investors unwound yen carry trades. The Nikkei 225 dropped sharply. These events combined to create a rapid selloff in Japanese and global markets.
How did the crash affect global investors?
Global investors saw increased volatility in portfolios. Technology, financial, and yen-sensitive stocks fell. Many investors shifted funds to safer assets like U.S. Treasuries and gold.
Are Japanese stocks now undervalued?
Japanese stocks trade at lower price-to-book ratios than U.S. stocks. Some analysts see value opportunities. However, market-wide indicators suggest caution due to signs of overvaluation.
What steps can investors take to manage risk?
Investors can diversify across asset classes, sectors, and regions. Using risk management tools like stop-loss orders and hedging helps reduce losses. Regular portfolio reviews support better decision-making.
Did the crash impact China and other Asian markets?
Yes. China and other Asian markets experienced increased volatility. Export-driven sectors and companies with global supply chains felt the effects most. Investors in these regions adjusted strategies to manage new risks.
The Japan stock crash of 2024, mirrored by ongoing volatility in technology, energy, and consumer discretionary sectors in 2025, underscores the critical need for diversification to manage global market risks. BiyaPay empowers you to trade US stocks, HK stocks, and cryptocurrencies seamlessly through a single account, offering unmatched flexibility compared to traditional brokers. Convert USDT to USD or HKD at real-time rates to minimize exchange costs for global trading.
Backed by FinCEN, FINTRAC MSB licenses, and SEC RIA registration, BiyaPay ensures secure transactions with rapid deposits to brokers like Charles Schwab. Sign up in minutes to build a resilient portfolio, whether you’re a novice or seasoned trader. Join BiyaPay now to navigate market turbulence! Trade with BiyaPay today to seize opportunities in volatile markets!
*This article is provided for general information purposes and does not constitute legal, tax or other professional advice from BiyaPay or its subsidiaries and its affiliates, and it is not intended as a substitute for obtaining advice from a financial advisor or any other professional.
We make no representations, warranties or warranties, express or implied, as to the accuracy, completeness or timeliness of the contents of this publication.


Contact Us
Company and Team
BiyaPay Products
Customer Services


is a broker-dealer registered with the U.S. Securities and Exchange Commission (SEC) (No.: 802-127417), member of the Financial Industry Regulatory Authority (FINRA) (CRD: 325027), member of the Securities Investor Protection Corporation (SIPC), and regulated by FINRA and SEC.
registered with the US Financial Crimes Enforcement Network (FinCEN), as a Money Services Business (MSB), registration number: 31000218637349, and regulated by FinCEN.
registered as Financial Service Provider (FSP number: FSP1007221) in New Zealand, and is a member of the Financial Dispute Resolution Scheme, a New Zealand independent dispute resolution service provider.