- EasyCard
- Trade
- Help
- Announcement
- Academy
- SWIFT Code
- Iban Number
- Referral
- Customer Service
- Blog
- Creator
Which U.S. President Delivered the Best Stock Market Returns


Image Source: pexels
Joe Biden delivered the best u.s. stock market performance among presidents in recent history, with the S&P 500 rising 37.4% during his first year in office. The S&P 500 index measures the broad u.s. stock market and serves as a key benchmark for stock market performance by president chart. Data shows that, on average, a democratic president oversees stronger u.s. stock market returns, reaching about 8.35% annually. However, market trends often reflect major economic events more than who sits in the Oval Office. Investors should look beyond politics and focus on what truly drives stock market performance.
Key Takeaways
- Joe Biden had the strongest single-year stock market gain with a 37.4% rise in his first year.
- Democratic presidents generally see higher average stock market returns, but major economic events affect markets more than who is president.
- Stock market returns often improve in the third year of a president’s term and tend to be weaker during election years.
- Long-term investing and staying focused on economic fundamentals lead to better results than trying to time the market based on political changes.
- Investors should avoid reacting to short-term political news and instead use a disciplined, diversified strategy to achieve steady growth.
Stock Market Performance by President Chart

Image Source: pexels
S&P 500 Returns Overview
A stock market performance by president chart offers a clear visual comparison of how the S&P 500 index has changed under each administration. Analysts use this chart to track returns from the start to the end of each president’s term. The S&P 500, a broad measure of U.S. equities, provides a consistent benchmark for evaluating stock market performance by president chart data.
| President | Party | Annualized Return (S&P 500, incl. dividends) | Economic Context |
|---|---|---|---|
| Herbert Hoover | Republican | -13.4% | 1929 Crash, Great Depression |
| Franklin D. Roosevelt | Democrat | 9.1% | New Deal, WWII |
| Harry Truman | Democrat | 13.6% | Postwar boom |
| Dwight Eisenhower | Republican | 13.8% | 1950s expansion |
| John F. Kennedy | Democrat | 12.1% | Early 1960s growth |
| Lyndon B. Johnson | Democrat | 6.6% | Vietnam War, Great Society |
| Richard Nixon | Republican | -2.9% | Watergate, 1973-74 crash |
| Gerald Ford | Republican | 18.6% | Recovery from 1974 crash |
| Jimmy Carter | Democrat | 6.0% | Stagflation |
| Ronald Reagan | Republican | 14.2% | 1980s bull market |
| George H.W. Bush | Republican | 11.6% | Early 1990s recession |
| Bill Clinton | Democrat | 17.2% | Tech boom |
| George W. Bush | Republican | -3.0% | Dot-com bust, 2008 crisis |
| Barack Obama | Democrat | 13.8% | Recovery from Great Recession |
| Donald Trump | Republican | 13.7% | Tax cuts, pre-pandemic rally |
| Joe Biden* | Democrat | 10.5% (as of 2023) | COVID recovery, tech rally |
*Data as of 2023. Source: MacroTrends, YCharts, Dimensional Fund Advisors.
The stock market performance by president chart reveals that only three presidents since 1929 experienced negative annualized returns. The average annual return for all presidents since 1926 stands above 9.5%. Democratic presidents have generally overseen higher returns, averaging about 8.35% annually, while Republican presidents have faced more volatility, with several major market downturns occurring during their terms.
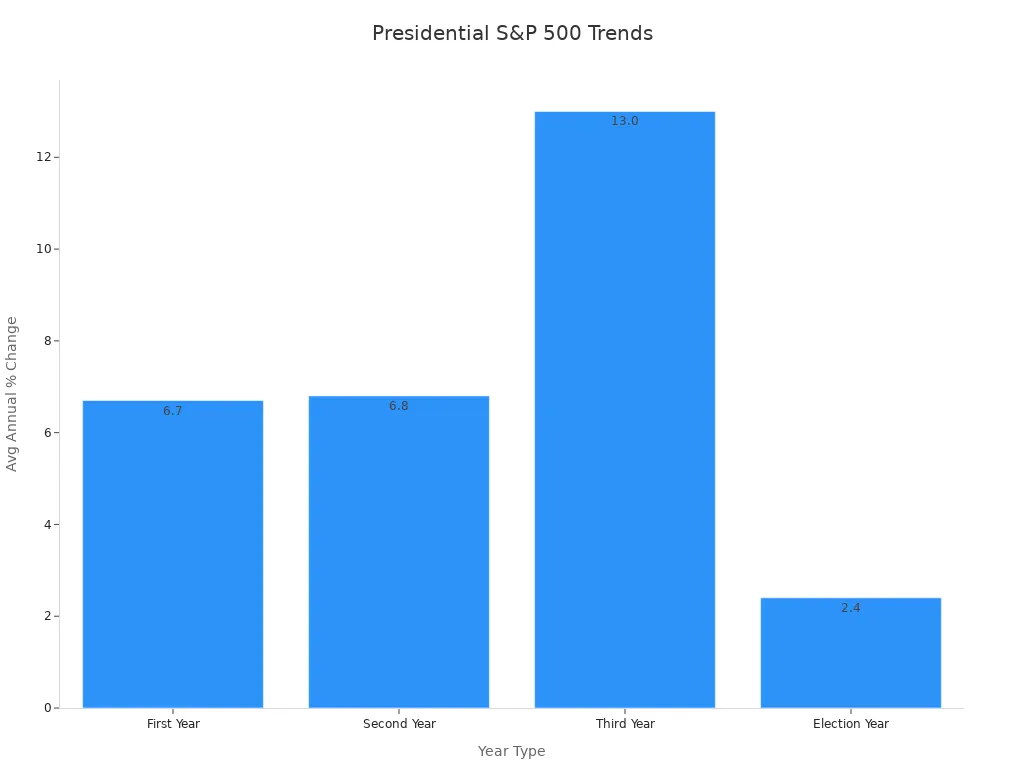
The chart above illustrates that the third year of a presidential term often delivers the strongest S&P 500 returns, with an average annual return of 13%. Election years tend to be weaker, averaging just 2.4%. This cyclical pattern appears consistently in stock market performance by president chart data.
Top Performers Highlighted
Several presidents stand out in the stock market performance by president chart. Bill Clinton led with a 17.2% annualized return, driven by the technology boom. Barack Obama and Dwight Eisenhower also posted strong returns, each above 13%. Joe Biden’s first year saw a 37.4% gain, the highest single-year return for any president in recent history. However, returns can vary widely within a term due to economic events.
- The stock market performance by president chart shows that Democratic presidents have historically delivered higher returns, especially when Congress was divided.
- Republican presidents have faced more frequent market downturns, including the 1929 crash under Hoover, the Watergate period under Nixon, and the 2008 financial crisis under George W. Bush.
- Data highlights that market lows often occur within two years after a change in presidential power, reflecting investor uncertainty during transitions.
- The S&P 500 has averaged a positive return of 0.92% on U.S. election days, with a 77% chance of closing higher, showing strong market optimism during these periods.
| Period Type | Average S&P 500 Return (%) |
|---|---|
| Presidential Election Years | +7.2 |
| Midterm Election Years | +5.9 |
| Non-Election Years | +12.5 |
| All Years Since 1950 | +9.5 |
| Year 2 of Presidential Cycle | +5.9 |
Comprehensive data from 1926 to 2023 confirms that staying invested, regardless of which party holds the White House, has produced the best long-term results. The stock market performance by president chart demonstrates that while a Democratic president often coincides with higher returns, external factors such as economic cycles, Federal Reserve policy, and global events play a larger role in shaping outcomes.
Returns by President
Best and Worst Returns
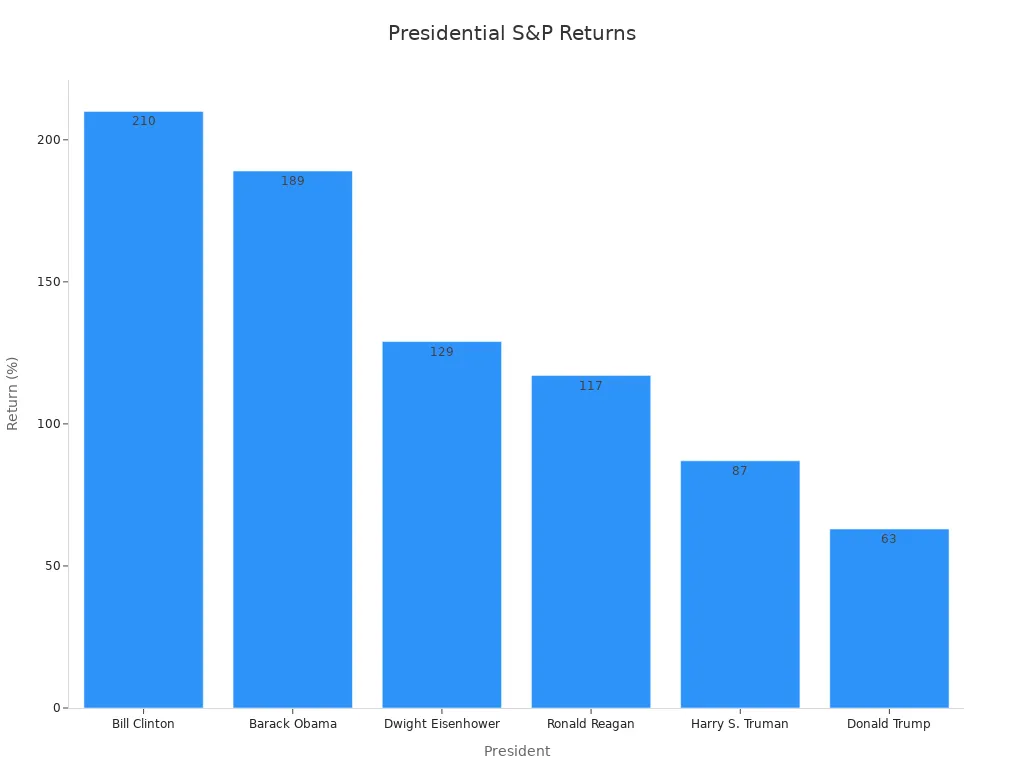
Presidential terms have produced a wide range of stock market returns. Some leaders oversaw periods of strong growth, while others faced economic challenges that led to weaker performance. The table below highlights the best and worst total S&P 500 returns during various presidencies:
| President | Term Years | Total S&P 500 Return (%) |
|---|---|---|
| Bill Clinton | 1993-2001 | +210% |
| Barack Obama | 2009-2017 | +189% |
| Dwight Eisenhower | 1953-1961 | +129% |
| Ronald Reagan | 1981-1989 | +117% |
| Harry S. Truman | 1945-1953 | +87% |
| Donald Trump | 2017-2021 | +63% |
Statistical analysis shows that both Republican and Democratic presidents have contributed to positive market returns. However, the limited number of presidencies makes it difficult to draw firm conclusions about which party is better for the market. The stock market responds more to economic fundamentals and investor sentiment than to party affiliation.
The S&P 500’s median compound annual growth rate during entire presidencies stands at about 10.2% for Republicans and 9.4% for Democrats. When measured by individual years, Democratic presidents show a higher median annual return of 12.9%, compared to 9.9% for Republicans. This difference highlights how measurement methods can affect the perception of best and worst returns.
Recent Presidents’ Market Performance
Recent presidents have faced unique economic environments that shaped their market returns. During biden’s presidency, the S&P 500 delivered strong gains, especially in the first year. The index rose 37.4% in 2021, reflecting a rapid recovery from the pandemic and a surge in technology stocks. Barack Obama also saw robust returns, with the market climbing 189% over his two terms as the economy rebounded from the Great Recession.
Donald Trump’s term produced a 63% total return, driven by tax cuts and a strong labor market before the pandemic. George W. Bush, in contrast, experienced negative returns due to the dot-com bust and the 2008 financial crisis.
Research indicates that presidential approval ratings can influence returns, especially during periods of high uncertainty. Markets tend to react more to investor confidence and economic data than to political leadership alone.
Data from nearly 100 years of S&P 500 performance shows that long-term trends remain positive regardless of administration. Investors who stay invested through different presidencies benefit from the market’s overall upward trajectory.
What Drives Returns
Economic Events
Stock market returns often reflect the impact of major economic events. Data since 1953 shows that events like the dot-com boom and bust, the 2007-2008 financial crisis, and the COVID-19 pandemic shaped market performance under different presidents. For example, the market soared during the technology boom in the 1990s and fell sharply during the 2008 crisis. These events caused volatility spikes, but the average volatility remained similar across both parties. Over the long term, holding stocks through these cycles led to significant growth. Economic growth, inflation, and employment trends all play a role, but these factors often lie outside a president’s direct control. The timing of these events can affect how market returns appear during each administration.
Presidential Policies
Presidential policies can influence short-term market behavior, especially during election cycles.
- Pre-election and election years usually bring higher stock market returns, while post-election and midterm years tend to show more volatility.
- The S&P 500 often rises on election day, but the day after, it may decline as uncertainty returns.
- Fiscal policy changes, such as tax cuts or increased government spending, can move bond yields and affect investor sentiment.
- Market lows frequently occur within two years after a new president takes office, reflecting investor adjustment to new policy directions.
These patterns show that while policy decisions matter, broader economic cycles and fundamentals have a stronger effect on long-term returns.
External Factors
External factors shape market performance during every presidency.
- The 2008 global financial crisis drove market volatility during the U.S. presidential transition, with recovery fueled by global stimulus efforts.
- The 1970s oil crisis and stagflation affected markets during Nixon’s and Carter’s terms, showing how global shocks can override domestic policy.
- After World War II, a booming global economy supported strong market growth during Eisenhower’s and Kennedy’s presidencies.
- In 2016, global economic concerns and uncertainty about new policies caused market swings after Trump’s election, but optimism about tax cuts and deregulation soon led to a rally.
These examples highlight that global trends, crises, and investor expectations often outweigh the influence of any single administration.
Presidential Impact on Stock Market Performance

Image Source: pexels
Limits of Influence
Presidents often receive credit or blame for stock market moves, but their actual influence remains limited. The study by Goodell, McGee, and McGroarty measures this effect by examining election uncertainty from 1992 to 2016. Their research shows that changes in the incumbent party’s re-election chances explain almost half of financial market uncertainty before elections. However, this influence comes through uncertainty, not direct control over the market. Presidents can shape the impact of policy, but economic fundamentals and global events usually play a larger role in market direction.
Investors should remember that while presidential elections can cause short-term volatility, the market’s long-term path depends more on factors like economic growth, inflation, and corporate earnings.
Expert Insights
Financial experts and analysts often point to historical data when discussing the stock market’s behavior under different presidents. Several key patterns emerge:
- Markets tend to rise in the year after an election, with the S&P 500 averaging an 8.3% gain, no matter which party wins.
- Election years show slightly lower returns, but losses usually result from outside events, not the election itself.
- Since 1927, the S&P 500 has averaged an 11% return during election years, with losses mainly tied to major crises.
- Over the long term, the market grows steadily, driven by economic fundamentals rather than short-term political changes.
Reports from sources like Investopedia confirm that the president’s party has little effect on long-term market trends. Their analysis of data from over 62 congressional sessions finds that unified government sometimes boosts markets, but major crises can override these effects. Experts agree that investors should focus on long-term goals and not react to short-term political news.
What Investors Should Know
Long-Term Strategy
Investors often wonder how presidential elections will affect the stock market. Historical data shows that elections have little impact on long-term market performance. Since 1860, research finds no statistical difference in returns between election and non-election years for a typical equity and bond portfolio. The stock market tends to price in political events efficiently, so presidential outcomes should not drive investment decisions.
A disciplined approach helps investors achieve better results. Vanguard’s research demonstrates that a balanced portfolio—such as 60% equities and 40% fixed income—delivers similar annualized returns under both Republican and Democratic presidents. Investors who set clear goals, maintain diversification, and minimize costs tend to see more consistent investment returns. Broader economic trends, such as inflation control, monetary policy, and global events, play a much larger role in shaping the stock market than presidential policies alone.
Investors should focus on economic fundamentals and long-term discipline rather than reacting to short-term political changes.
Avoiding Political Timing
Trying to time the stock market based on political events can lead to costly mistakes. Prospect theory shows that investors often react more strongly to losses than gains, which can cause poor timing decisions. Behavioral biases, such as framing effects and emotional responses to political news, may lead to overreactions or missed opportunities.
- Presidential elections sometimes increase short-term volatility, especially if results are delayed or contested. For example, the 2020 election saw a 40% spike in the VIX.
- Sector performance may shift with expected policy changes, but these moves rarely predict overall market direction.
- Geopolitical events and global economic cycles often have a greater impact on the stock market than election outcomes.
Investors should avoid relying solely on political timing. Instead, they can manage risk by diversifying their portfolios and staying focused on long-term goals. Overreliance on political news without considering broader market dynamics can result in significant losses. Combining expert judgment with a disciplined strategy helps investors navigate uncertainty and benefit from the stock market’s long-term growth.
Joe Biden delivered the strongest single-year S&P 500 return at 37.4%, but history shows that market performance depends on more than presidential leadership. Research since 1860 finds no significant difference in returns between election and non-election years, and economic fundamentals, global trends, and technological change shape outcomes.
Historical data provides valuable context for investors, but it does not predict future results.
- Staying invested through all administrations yields better long-term returns than reacting to political changes.
- Long-term strategies, diversification, and patience support investment success.
Investors should use history as a guide, not a forecast, and focus on their long-term financial goals.
FAQ
What president had the highest single-year S&P 500 return?
Joe Biden achieved the highest single-year S&P 500 return, with a 37.4% gain in 2021. This performance reflected a rapid recovery from the COVID-19 pandemic and strong growth in technology stocks.
Do presidential elections always affect the stock market?
Presidential elections can cause short-term volatility. However, long-term stock market trends depend more on economic growth, inflation, and global events than on election outcomes.
Should investors change their strategy based on who wins the presidency?
Experts recommend that investors avoid changing their investment strategy based on election results. A disciplined, long-term approach with diversification usually delivers better results than reacting to political news.
Which index best measures stock market performance by president?
Analysts often use the S&P 500 index to measure stock market performance by president. The S&P 500 covers a broad range of large U.S. companies and provides a consistent benchmark for historical comparisons.
Joe Biden’s 37.4% S&P 500 return in 2021 highlights the potential for strong gains, but recent declines in technology, energy, and consumer discretionary sectors underscore the need for diversification to manage volatility. BiyaPay enables you to trade US stocks, HK stocks, and cryptocurrencies seamlessly through one account, offering greater flexibility than traditional brokers. Convert USDT to USD or HKD at real-time rates to minimize exchange costs for global trading.
Backed by FinCEN, FINTRAC MSB licenses, and SEC RIA registration, BiyaPay ensures secure transactions with rapid deposits to brokers like Charles Schwab. Sign up in minutes to build a resilient portfolio, whether you’re a novice or active trader. Join BiyaPay now to navigate market swings! Trade with BiyaPay today to seize opportunities in volatile markets!
*This article is provided for general information purposes and does not constitute legal, tax or other professional advice from BiyaPay or its subsidiaries and its affiliates, and it is not intended as a substitute for obtaining advice from a financial advisor or any other professional.
We make no representations, warranties or warranties, express or implied, as to the accuracy, completeness or timeliness of the contents of this publication.


Contact Us
Company and Team
BiyaPay Products
Customer Services


is a broker-dealer registered with the U.S. Securities and Exchange Commission (SEC) (No.: 802-127417), member of the Financial Industry Regulatory Authority (FINRA) (CRD: 325027), member of the Securities Investor Protection Corporation (SIPC), and regulated by FINRA and SEC.
registered with the US Financial Crimes Enforcement Network (FinCEN), as a Money Services Business (MSB), registration number: 31000218637349, and regulated by FinCEN.
registered as Financial Service Provider (FSP number: FSP1007221) in New Zealand, and is a member of the Financial Dispute Resolution Scheme, a New Zealand independent dispute resolution service provider.