- EasyCard
- Trade
- Help
- Announcement
- Academy
- SWIFT Code
- Iban Number
- Referral
- Customer Service
- Blog
- Creator
Why Did the Market Go Down Today Find Out Which Stocks Fell


Image Source: unsplash
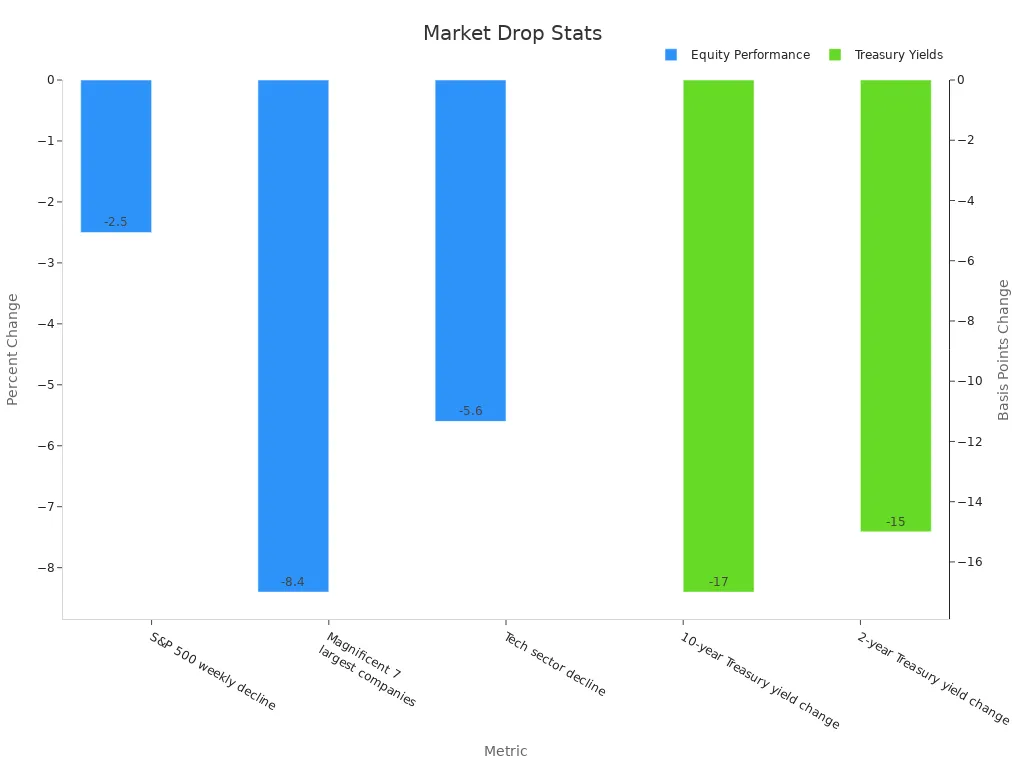
You might be wondering why did the market go down today. Rising bond yields and weak sector performance hit hard. Energy and communication stocks took the biggest hits, while technology and utilities managed to see some gains. Check out the numbers below to see how much the market moved:
Investors felt the impact as shares of CERo Therapeutics (CERO), Eyenovia (EYEN), and TransMedics Group (TMDX) dropped sharply. If you hold these stocks, you probably noticed the effect on your portfolio.
Key Takeaways
- Rising bond yields and inflation fears caused the market to drop, especially hitting energy and communication stocks hard.
- Technology and utilities sectors showed strength, offering safer options during uncertain times.
- Small- and mid-cap stocks faced bigger losses and more volatility due to less coverage and higher risk.
- Investors should watch bond yields, sector trends, and consumer spending to understand market moves.
- Diversifying your portfolio and staying disciplined helps manage risks and benefit from market recoveries.
Why Did the Market Go Down Today?
Bond Yields Rise
You probably noticed the headlines about rising bond yields. This is one of the main reasons why did the market go down today. When the 10-year Treasury yield jumps, it puts pressure on u.s. equity markets. Over the past week, the 10-year yield spiked from below 4% to 4.5%. The 30-year yield even moved above 5%. These sharp increases happened after new tariffs were announced in April, which made investors nervous about inflation and future interest rate hikes.
The Treasury market saw a lot of volatility. Investors who usually hold Treasuries, like the Federal Reserve and foreign governments, stepped back. More price-sensitive buyers, such as mutual funds and hedge funds, took their place. This shift made the market more sensitive to changes. When leveraged investors had to sell Treasuries to cover margin calls, yields rose even faster. Liquidity dried up, and trading costs went up. You could see the stress in the equity market pullback as well. The yield curve even inverted, which often signals caution about economic growth.
Charts from J.P. Morgan and Brookings show that when bond yields rise quickly, equity prices often fall. These reports highlight how the yield curve acts as a warning sign for both inflation and recession risk. You can see the connection between higher interest rates and weaker equity performance.
Sector Performance Impact
Not all sectors felt the pain equally. If you looked at the market today, you saw that energy and communication sectors led the declines. These sectors are sensitive to changes in interest rates and inflation. Higher rates make it more expensive for companies to borrow and invest. At the same time, inflation eats into profits, especially for companies that cannot pass higher costs to customers.
Technology and utilities, on the other hand, managed to post gains. Investors often turn to these sectors during times of uncertainty. Utilities offer steady returns, while technology stocks sometimes benefit from long-term growth trends, even when interest rates rise. Still, the overall equity market performance was mixed. Most other sectors stayed flat or saw only small changes.
You might wonder why did the market go down today if some sectors did well. The answer lies in the weight of the declining sectors and the broad impact of rising interest rates and inflation. When big sectors like energy and communication drop, they pull the whole market lower.
Market Sentiment
Market sentiment played a huge role in today’s equity moves. Many investors felt cautious because of inflation concerns and the possibility of more interest rate hikes. Surveys and research show that when investors feel bearish, equity volatility goes up and returns drop. Fund manager sentiment indices and retail investor surveys both pointed to rising fear and uncertainty.
You could see this in the way small- and mid-cap stocks reacted. These stocks often move more when market sentiment shifts. When investors worry about economic growth or inflation, they sell riskier assets first. This adds to the equity market’s volatility.
You might have noticed that u.s. equity markets have become more sensitive to news about inflation, interest rates, and economic data. When the Federal Reserve signals a possible interest rate decision, or when new data shows higher inflation, the market reacts quickly. This is why did the market go down today—investors are watching every signal and adjusting their positions fast.
Note: Market sentiment is not just about numbers. It reflects how you and other investors feel about the future. When inflation stays above the Fed’s 2% target and economic indicators point to a slowdown, caution takes over. This leads to more selling and weaker equity performance.
If you want to understand market performance, keep an eye on interest rates, inflation, and sector trends. These factors drive the ups and downs you see in your portfolio.
Sectors Hit Hardest
Image Source: unsplash
Energy Sector Losses
You probably noticed the energy sector took a big hit today. Rising bond yields and worries about global demand pushed energy stocks lower. Many investors moved away from oil and gas companies, which made prices drop even more. If you look at the numbers, you can see how energy stocks struggled compared to others.
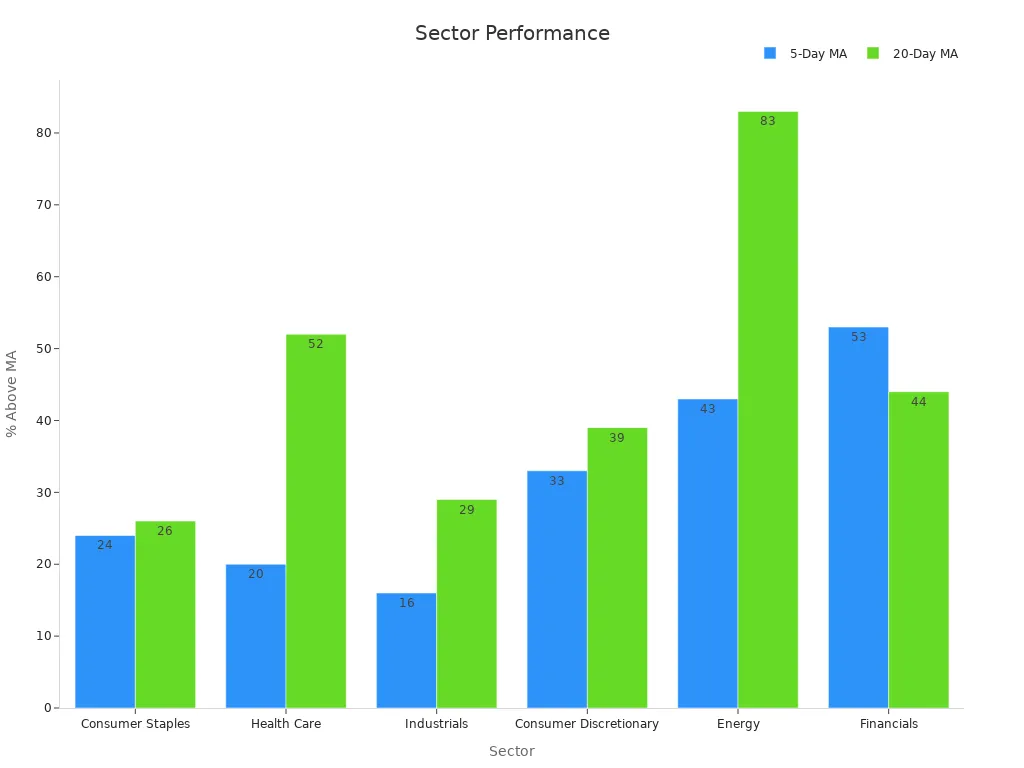
Here’s a quick look at how different sectors performed based on the percentage of large-cap stocks trading above their 5-day and 20-day moving averages:
| Sector | % Above 5-Day MA | % Above 20-Day MA |
|---|---|---|
| Consumer Staples | 24% | 26% |
| Health Care | 20% | 52% |
| Industrials | 16% | 29% |
| Consumer Discretionary | 33% | 39% |
| Energy | 43% | 83% |
| Financials | 53% | 44% |
You can see that energy stocks have a higher percentage above their moving averages, but today’s drop still made them one of the sectors with the worst performance. Investors reacted quickly to changes in oil prices and global news.
Communication Sector Declines
The communication sector also faced a tough day. Companies in this group saw their stock prices fall as investors worried about shrinking profits and job losses. Over 70,000 telecom jobs disappeared in the United States from 2019 to 2023. Carriers also cut back on capital investment, which could slow down network upgrades. At the same time, broadband revenue per user dropped by 8% after adjusting for inflation. This shows that competition is getting stronger and profits are under pressure.
| Indicator | Data / Trend Description |
|---|---|
| Employment Decline | Over 70,000 telecom jobs lost in the US from 2019 to 2023 due to automation and cloud-based architectures. |
| Capital Investment | Carrier capital investment decreasing relative to revenues and depreciation, indicating potential risks to network modernization and expansion. |
| Broadband ARPU | Inflation-adjusted average revenue per user (ARPU) for broadband declined by 8% amid rising competitive intensity. |
| Wireless ARPU | Inflation-adjusted ARPU for wireless remains relatively steady, with slight competition increase from MVNOs. |
You can see how these trends hurt the sector’s performance and made investors more cautious.
Mixed Sector Results
Not every sector struggled today. Technology and utilities stood out as top gainers. Investors often turn to these sectors during uncertain times because they offer stability or growth. Most other sectors, like consumer discretionary sectors and health care, stayed flat or saw only small changes. If you want to track market performance, keep an eye on these shifts. Here’s a chart that shows how the sectors stacked up:
You can use this information to spot which sectors might bounce back or keep falling. Watching sector performance helps you make better decisions in a changing market.
Biggest Stock Losers
Image Source: pexels
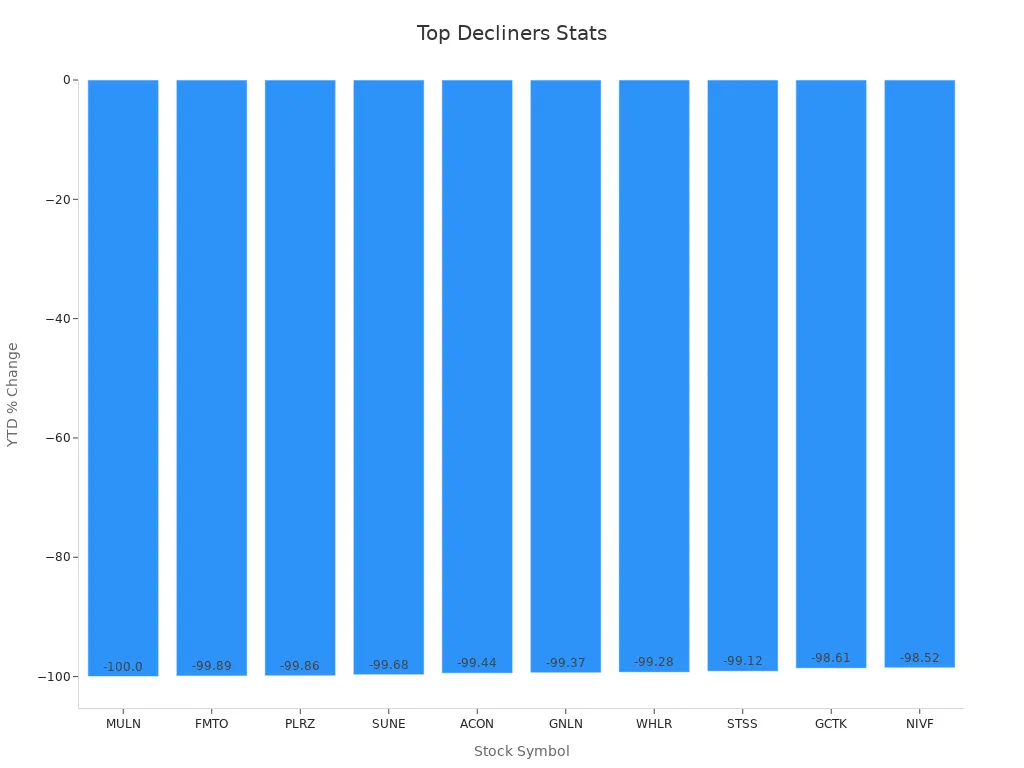
Top Decliners
You probably noticed some stocks really stood out as the top losers today. CERo Therapeutics (CERO), Eyenovia (EYEN), and TransMedics Group (TMDX) all saw sharp drops. Other names like Trip.com Group (TCOM), Freedom Holding (FRHC), ExlService Holdings (EXLS), Beyond Air (XAIR), BP Prudhoe Bay Royalty Trust (BPT), Barnwell Industries (BRN), and Lixte Biotechnology (LIXT) also landed on the list of biggest stock losers. CERO and EYEN both posted double-digit percentage declines, which can be tough to watch if you own these stocks.
If you want to see how these stocks compare, check out this table of top decliners by year-to-date change:
| Rank | Symbol | Company Name | YTD Change | Stock Price | Volume | Market Cap |
|---|---|---|---|---|---|---|
| 1 | MULN | Mullen Automotive, Inc. | -100.00% | $1.32 | 5,272,654 | $1.05M |
| 2 | FMTO | Femto Technologies Inc. | -99.89% | $4.50 | 8,412 | $3.87M |
| 3 | PLRZ | Polyrizon Ltd. | -99.86% | $0.76 | 558,345 | $20.64K |
| 4 | SUNE | SUNation Energy Inc. | -99.68% | $1.68 | 146,250 | $5.72M |
| 5 | ACON | Aclarion, Inc. | -99.44% | $7.33 | 5,377 | $4.27M |
| 6 | GNLN | Greenlane Holdings, Inc. | -99.37% | $0.0104 | 260,936,392 | $10.62M |
| 7 | WHLR | Wheeler Real Estate Inv. Tr. | -99.28% | $3.42 | 3,434,266 | $1.91M |
| 8 | STSS | Sharps Technology, Inc. | -99.12% | $5.44 | 1,732,848 | $5.54M |
| 9 | GCTK | GlucoTrack, Inc. | -98.61% | $6.23 | 50,064 | $2.97M |
| 10 | NIVF | NewGenIvf Group Limited | -98.52% | $1.24 | 514,685 | $931K |
Notable Volatility
You might wonder why some stocks move so much in one day. Volatility often hits small- and mid-cap stocks the hardest. These companies usually have less analyst coverage and lower trading volume, which means prices can swing quickly. Many small-cap stocks carry more debt, making them riskier when the market gets shaky. You see this in the way stocks like CERO and EYEN dropped so fast. Sometimes, these stocks bounce back, but the swings can be wild.
- Small- and mid-cap stocks often show bigger price changes than large caps.
- Many of these companies have higher debt, which adds to risk.
- Less information and fewer analysts mean prices can move on small news.
- Mergers and acquisitions target these stocks, causing sudden jumps or drops.
Company-Specific Drops
Some stocks fall because of news about the company itself. For example, CERO and EYEN both had bad news that made investors sell. TMDX, TCOM, and FRHC also faced company-specific issues. When a company misses earnings or announces a problem, you often see a big drop in its stock price. The SSRN paper “Daily Winners and Losers” shows that stocks with the biggest losses often keep underperforming for weeks. But sometimes, as Investopedia points out, these stocks can bounce back later.
You saw UnitedHealth take a huge hit, dropping 42% since April. This shows how even big names can land among the top losers. Watching these stocks helps you spot trends and manage your own risk. If you hold small- or mid-cap stocks, keep an eye on news and be ready for more volatility.
Impact on Investors
Portfolio Effects
You probably felt the impact of today’s market drop in your portfolio, especially if you hold stocks in the energy or communication sectors. When equity prices fall, your account value can shrink fast. Investors with big positions in these sectors or in the biggest stock losers saw the largest changes. If you track your portfolio using dashboards or heat maps, you might have noticed red across the board. These tools help you see how your investments compare to others. They also show how different stocks move together and how your portfolio changes over time.
- Dashboards give you real-time updates on your portfolio’s performance.
- Heat maps let you compare your results with other investors.
- Growth charts and risk models help you understand how your spending and investment choices affect your returns.
- Automated alerts warn you when stocks or funds hit certain price or risk levels.
You can use these features to spot problems early and make better decisions. If you focus on retail sales or consumer spending trends, you might see how changes in inflation or interest rates affect your equity holdings.
What to Watch Next
You need to keep an eye on several trends if you want to stay ahead. Experts suggest watching bond yields, sector rotation, and new data on consumer spending. Advanced tools like time series analysis and machine learning now help investors track these changes in real time. These methods can spot shifts in consumer preferences, retail sales, and economic growth before they show up in the news.
| Trend to Watch | Why It Matters | Example |
|---|---|---|
| Bond yields and interest rates | Affect equity prices and borrowing costs | Rising rates can slow retail sales growth |
| Sector rotation | Shows where investors move money | Shifts from discretionary to consumer staples |
| Consumer spending trends | Signal changes in economic growth | Weak retail sales can hurt stocks |
Tip: Stay updated on retail sales and inflation reports. These numbers can move the market and your portfolio.
Navigating Volatility
You can handle market swings by following a few simple strategies. Diversify your portfolio across sectors like technology, discretionary, and retail. Focus on quality stocks and keep a long-term view. History shows that even when equity markets drop, they often bounce back. Central Trust and other research groups say that staying invested through volatility usually pays off. They recommend balancing your investments between equity, fixed income, and alternative assets. Avoid making big changes based on short-term moves in u.s. equity markets.
CFRA and Raymond James also suggest using risk management tools. These include sector rotation, hedged equity, and structured notes. You can set rules for rebalancing your portfolio when inflation or interest rates change. Remember, market corrections are normal. If you stay disciplined and watch for changes in consumer and retail trends, you can protect your spending power and grow your investments over time.
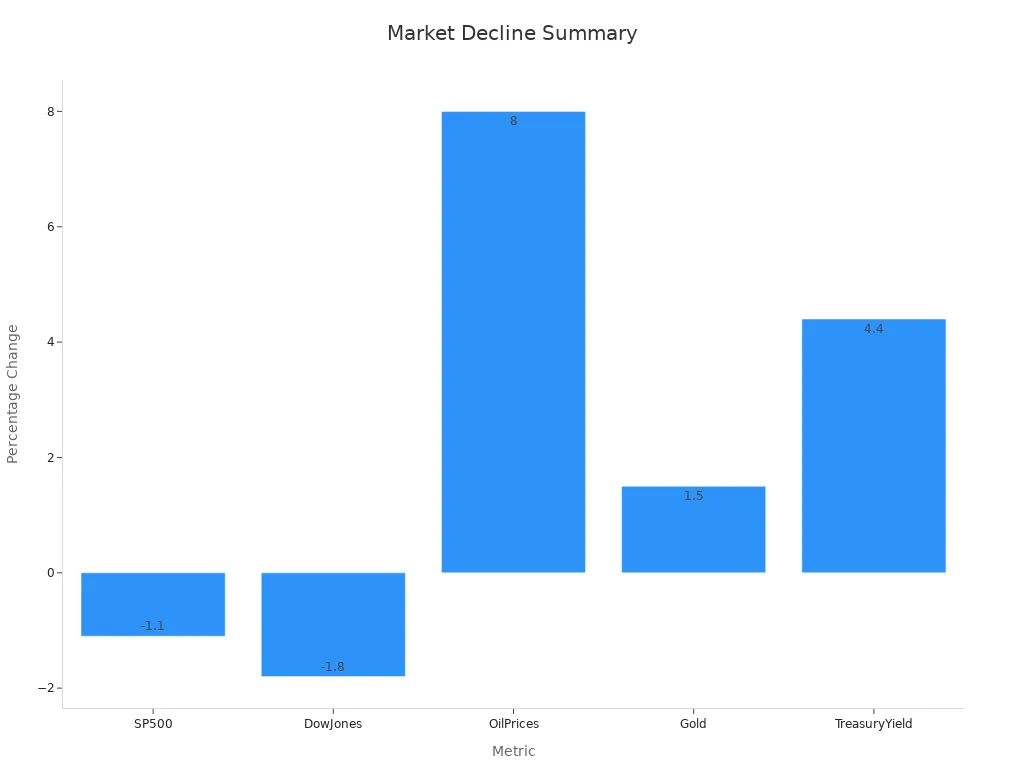
Today, you saw the market drop as rising bond yields and stubborn inflation weighed on stocks. Energy and communication sectors struggled the most, while technology and utilities held up better. Take a look at this quick summary:
| Metric | Value/Change | Context/Notes |
|---|---|---|
| S&P 500 | -1.1% | Decline on day of geopolitical escalation |
| Dow Jones Industrial Average | -1.8% | Decline on day of geopolitical escalation |
| Oil Prices | +8% | Spike due to conflict escalation |
| Gold | +1.5% | Rise as a safe-haven asset |
| 10-year Treasury Yield | 4.4% (modest rise) | Slight increase despite flight to safety |
Stocks like CERo Therapeutics and Eyenovia led the losses. Inflation and market swings can hit your portfolio fast. Watch for new inflation data and signals of growth. Investors now use trend analysis and real-time data to spot changes early. Stay alert and keep tracking these trends.
FAQ
What causes stocks to drop so quickly?
Stocks can fall fast when investors worry about the economy or see bad news. If you hear about weak retail sales or lower consumer confidence, you might see prices drop. Sometimes, big changes in spending also make stocks move.
How do rising bond yields affect the market?
When bond yields go up, you may see stocks fall. Higher yields mean borrowing costs rise for companies. This can slow down consumer spending and hurt retail businesses. Investors often move money out of stocks when yields climb.
Why do some sectors perform better than others?
Some sectors, like technology, can do well even when others struggle. If consumer trends shift or retail sales drop, sectors tied to consumer spending may fall. You might notice utilities or tech stocks hold up better during tough times.
What should you watch for after a market drop?
Keep an eye on consumer confidence, retail sales reports, and changes in spending. These numbers show how people feel about the economy. Watching these trends helps you spot when the market might bounce back or fall again.
Today’s market drop, driven by rising bond yields and weak energy and communication sectors, underscores the need for agile strategies to manage volatility. Stocks like CERO and EYEN highlight the risks of small-cap investments, while technology and utilities offer stability. BiyaPay empowers you to navigate these swings with a single account to trade US stocks, HK stocks, and cryptocurrencies seamlessly. Convert USDT to USD or HKD at real-time rates to optimize costs, and rely on FinCEN, FINTRAC MSB licenses, and SEC RIA registration for secure, compliant trading.
With quick sign-up, you can diversify your portfolio and respond to market shifts instantly. Join BiyaPay now to build resilience against market turbulence! Start trading with BiyaPay today to seize opportunities in dynamic markets!
*This article is provided for general information purposes and does not constitute legal, tax or other professional advice from BiyaPay or its subsidiaries and its affiliates, and it is not intended as a substitute for obtaining advice from a financial advisor or any other professional.
We make no representations, warranties or warranties, express or implied, as to the accuracy, completeness or timeliness of the contents of this publication.


Contact Us
Company and Team
BiyaPay Products
Customer Services


is a broker-dealer registered with the U.S. Securities and Exchange Commission (SEC) (No.: 802-127417), member of the Financial Industry Regulatory Authority (FINRA) (CRD: 325027), member of the Securities Investor Protection Corporation (SIPC), and regulated by FINRA and SEC.
registered with the US Financial Crimes Enforcement Network (FinCEN), as a Money Services Business (MSB), registration number: 31000218637349, and regulated by FinCEN.
registered as Financial Service Provider (FSP number: FSP1007221) in New Zealand, and is a member of the Financial Dispute Resolution Scheme, a New Zealand independent dispute resolution service provider.