- EasyCard
- Trade
- Help
- Announcement
- Academy
- SWIFT Code
- Iban Number
- Referral
- Customer Service
- Blog
- Creator
Are We in a Bull or Bear Market Right Now


Image Source: unsplash
You might wonder, are we in a bull or bear market right now? Most analysts see mixed signals. The economy shows signs of strength, but investor sentiment feels cautious. Here’s what you need to know:
- May Non-Farm Payrolls added 139,000 jobs, beating forecasts.
- Unemployment rate holds at 4.2%.
- Average hourly earnings rose 3.9% year-over-year.
- Small business optimism ticked higher for the first time in months.
- Inflation pressures seem to ease, but consumer confidence still drops.
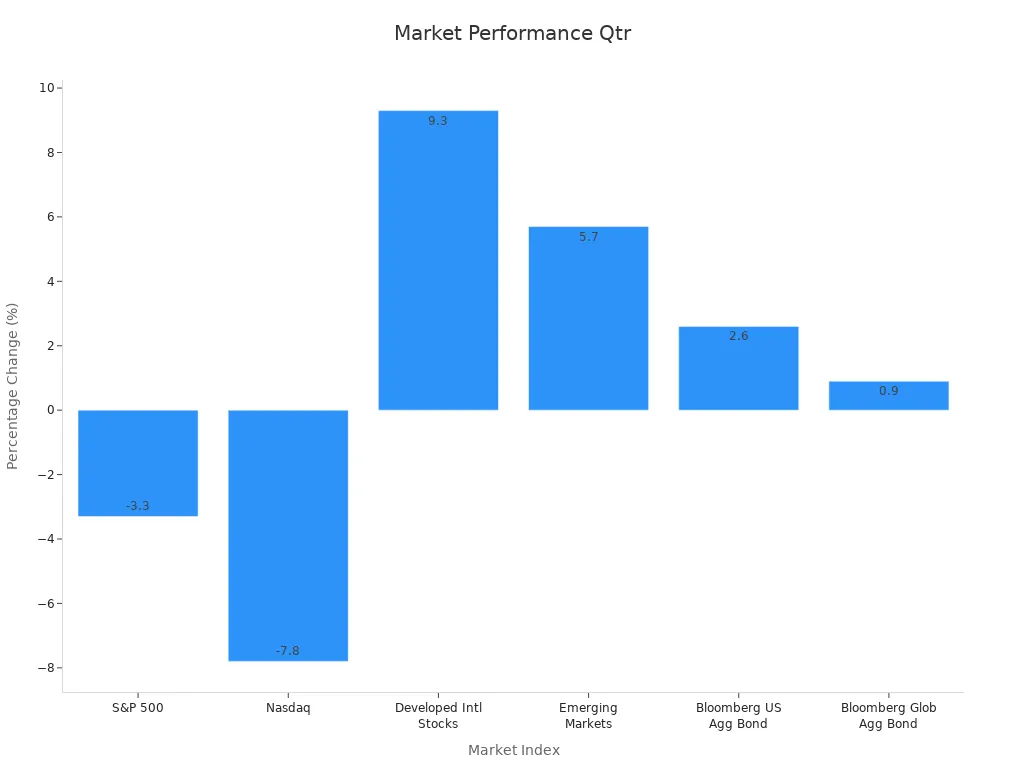
Stock market decline in the S&P 500 and Nasdaq points to some bear concerns, while international stocks rally. Knowing if we’re in a bull or bear market helps you decide how to respond as an investor.
Key Takeaways
- The current market shows mixed signals with some strong economic data but cautious investor sentiment, making it unclear if we are in a bull or bear market.
- Key indicators like the yield curve warn of recession risk, while earnings growth and improving consumer sentiment support a bullish outlook.
- Valuations remain high, and market stress signals suggest risks that investors should watch closely to avoid surprises.
- Investors should stay flexible by diversifying portfolios, regularly rebalancing, and managing risk without making drastic changes too soon.
- Monitoring both market data and investor feelings helps you make smarter decisions and stay prepared for market ups and downs.
Are We in a Bull or Bear Market

Image Source: unsplash
You probably ask yourself, are we in a bull or bear market? The answer is not simple. Many investors and analysts see mixed signals. Some numbers look strong, but others show warning signs. Let’s break it down so you can understand what’s really happening in the market right now.
Market Indicators
First, let’s talk about what makes a bull market or a bear market. A bull market usually means stocks go up by at least 20% from a recent low. People feel confident, and you see more buyers than sellers. A bear market is the opposite. Stocks drop by 20% or more from a recent high. People get nervous, and selling picks up.
Right now, the S&P 500 has seen some ups and downs. It dropped earlier this year, but it hasn’t fallen enough to call it a true bear market. Some stocks, especially in tech, have bounced back. Others still struggle. You see this pattern in other equities too.
Let’s look at some key numbers that experts use to decide if we’re in a bull or bear phase:
| Model Name | Date Updated | Indicator Description | Current Signal / Interpretation |
|---|---|---|---|
| Earnings Yield Gap | March 31, 2025 | Compares S&P 500 earnings yield to US Treasury bonds earnings yield to assess relative valuation. | Fairly Valued |
| Yield Curve Model | March 31, 2025 | Measures spread between short-term (3-month) and long-term (10-year) Treasury yields; inversion signals recession risk. | Very High Recession Risk |
| Sahm Rule | March 31, 2025 | Tracks rapid rises in unemployment rate as a recession indicator. | Normal Recession Risk |
| State Coincidence Indicator | January 31, 2025 | Counts number of US states with declining economic health; >25 states declining signals recession. | Normal Recession Risk |
| Margin Debt | February 28, 2025 | Tracks year-over-year changes in margin debt as a proxy for investor bullishness. | Neutral Sentiment |
| Junk Bond Spreads | March 31, 2025 | Measures credit risk premium; high spreads indicate bearish sentiment, low spreads bullish. | Neutral Sentiment |
| VIX Fear Index | March 31, 2025 | Measures expected market volatility over next 30 days; high values correlate with fear and potential crashes. | Neutral Sentiment |
You can see that most signals are neutral or show normal risk. The yield curve, though, flashes a warning. When short-term rates are higher than long-term rates, it often means trouble ahead. Still, other indicators do not confirm a full bear market.
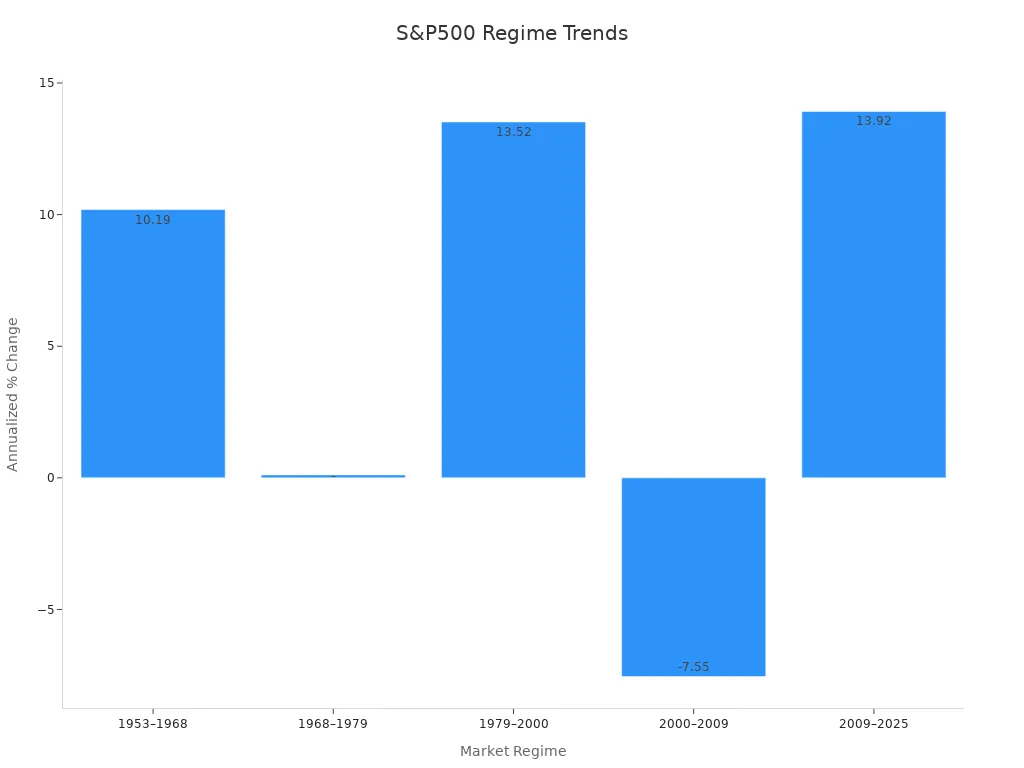
If you look at history, you notice that the S&P 500 has gone through many bull and bear cycles. Here’s a quick look at how it performed in different periods:
| Market Regime Period | Description | Annualized S&P 500 Price Change | Key Economic/Monetary Context |
|---|---|---|---|
| 1953–1968 | Post-War Boom | +10.19% | Robust economic growth, moderate inflation, supportive policy |
| 1968–1979 | Stagflation Grind | +0.11% | High inflation, economic challenges, valuation compression |
| 1979–2000 | Great Bull Market | +13.52% | Monetary tightening, deregulation, globalization, tech advances |
| 2000–2009 | Lost Decade | -7.55% | Dot-com crash, global financial crisis |
| 2009–2025 | Post-GFC Boom | +13.92% | Ultra-low interest rates, quantitative easing, tech dominance |
Analysts use many tools to decide if we are in a bull or bear market. They look at things like moving averages, the number of stocks making new highs or lows, and the ratio of advancing to declining stocks. They also use statistical methods such as regression analysis and time series analysis to spot trends. These methods help you see if the market is gaining strength or losing it.
Investor Sentiment
Investor sentiment is another big clue. It tells you how people feel about the market outlook. When most investors feel positive, you often see a bull market. When fear takes over, a bear market can follow.
Here’s a table showing some of the main sentiment tools and what their signals mean:
| Sentiment Tool | Scale Range | Bearish Signal Threshold | Bullish Signal Threshold |
|---|---|---|---|
| Fear & Greed Index | 0-100 | 0-25 (Extreme Fear) | 75-100 (Extreme Greed) |
| VIX Volatility Index | 0-100 | Above 40 (High Fear) | Below 12 (Extreme Complacency) |
| Put-Call Ratio | 0-2.0 | Above 1.0 (Bearish) | Below 0.5 (Bullish) |
| Sentiment Indicator | Measurement Focus | Bullish Signal | Bearish Signal |
|---|---|---|---|
| AAII Investor Sentiment Survey | % of bullish vs bearish retail investors | Bullish readings above 55% | Bearish readings below 25% |
| Michigan Consumer Sentiment Index (MCSI) | Consumer confidence in personal finances and economy | Rising index values indicating optimism | Declining index values indicating caution or pessimism |
| Conference Board Consumer Confidence Index (CCI) | Consumer attitudes on current and future economic conditions | Increasing confidence signaling optimism | Decreasing confidence signaling pessimism |
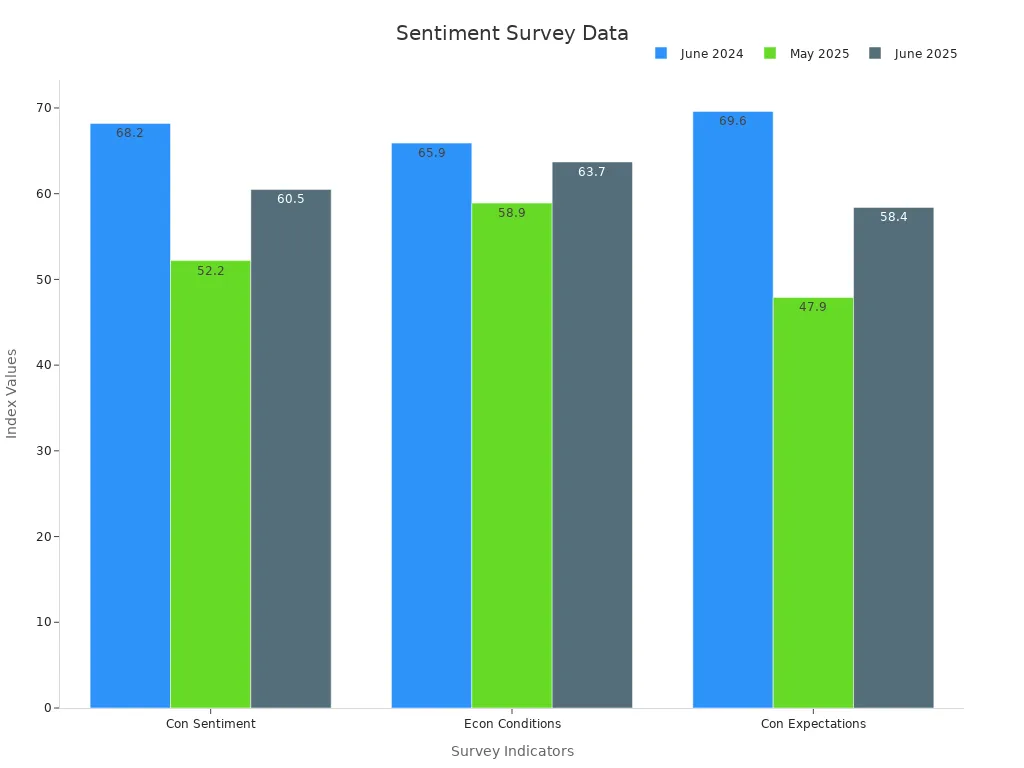
In June 2025, the Index of Consumer Sentiment jumped to 60.5 from 52.2 in May. That’s a 15.9% increase in just one month. But it’s still lower than last year’s 68.2. This tells you that people feel a bit better, but they are not fully confident yet. Inflation expectations have dropped, which helps, but worries about tariffs and the economy remain.
You also see more investors talking about ESG strategies and active ownership. This shift shows that people care about more than just price gains. They want to invest in companies that match their values.
So, are we in a bull or bear market? The answer is not clear-cut. The market shows some bull signs, like steady earnings and improving sentiment. At the same time, risks like the inverted yield curve and cautious investors keep the bear market fears alive. You need to watch both the numbers and how people feel to get the full picture. This mix of signals means you should stay alert and flexible with your investments in stocks and other equities.
Bull Market Factors
Economic Strength
When you look for reasons behind a bull market, you often start with the strength of the economy. A strong economy gives you confidence that stocks and equities can keep rising. You see this in several key indicators:
- Stock market gains often signal that investors expect growth ahead.
- House prices and real estate trends can show you where the economy is heading months before other data.
- Bond yields, especially the yield curve, help you predict if the market will stay bullish or turn cautious.
- Currency strength tells you if the economy is stable and trusted by global investors.
- Labor market statistics, like the unemployment rate, show if people are finding jobs or struggling.
- Commodity prices, such as oil and copper, rise when demand grows, while gold prices jump when investors worry.
You might notice that GDP growth and job numbers do not always move together. From 1990 to 2019, the US saw GDP rise faster than employment. After the pandemic, some states bounced back quickly, but others lagged. Automation and outsourcing changed the job market, making it harder for some workers to find new roles. Even when GDP looks strong, the labor market can still face challenges. Projections show that GDP growth will slow down a bit, and unemployment may rise before returning to normal. This close link between GDP and jobs helps you understand why the bull market can keep going, even if the job market feels uneven.
Earnings Growth
Earnings growth is a big reason why you see a bull market. When companies make more money, stocks usually go up. The bullish case for stocks gets stronger when earnings beat expectations. Let’s look at some recent numbers:
| Metric/Aspect | Detail/Statistic |
|---|---|
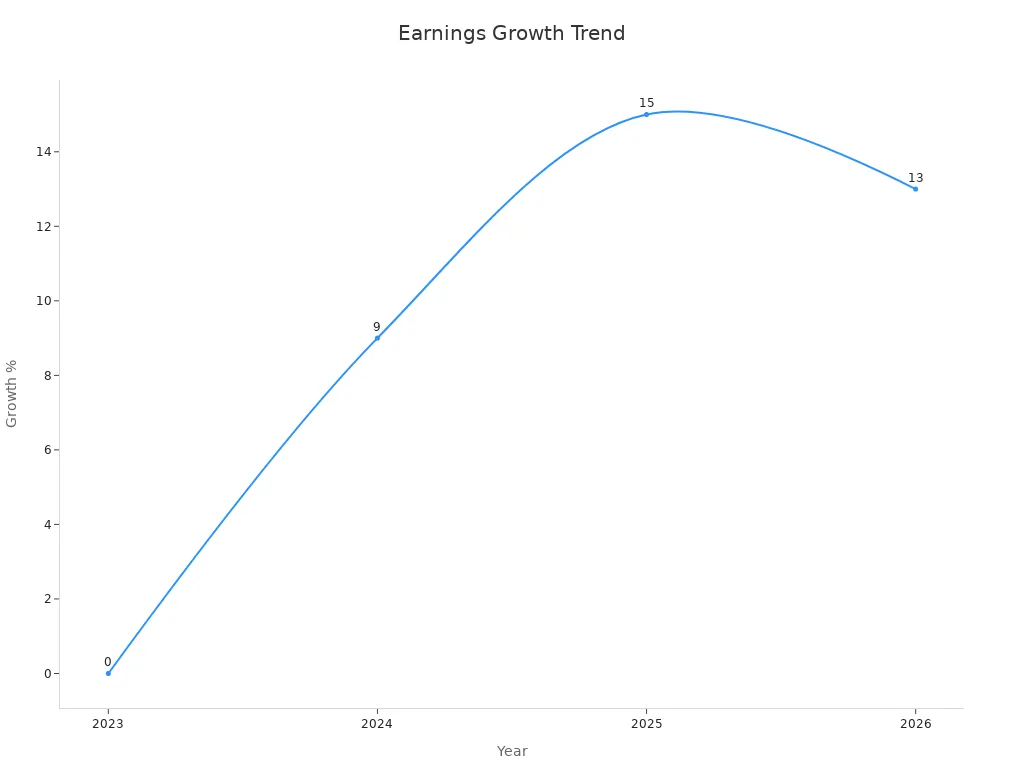
| S&P 500 Earnings Growth Projections | 0% in 2023; 9% in 2024; 15% in 2025; 13% in 2026 |
| Earnings Growth Drivers | Profit margin expansion in mega-cap tech; broadening margin recovery in health care and consumer discretionary sectors |
| Earnings Contribution Shift | Mag 7 (mega-cap tech) earnings growth expected to decelerate to ~20% annually; rest of market accelerating |
| Mag 7 Contribution to S&P 500 Returns | 63% in 2023; reduced to 47% in 2024 |
| Earnings Contribution by Other Companies | Other 493 companies expected to contribute 29% of earnings growth in 2024; 73% in 2025 |
| Capital Expenditure by Hyperscalers | $194B in 2024 and $225B in 2025 planned capex by Alphabet, Amazon, Meta, Microsoft, Oracle |
| Sectoral Outlook | Industrials, energy, materials emerging from cyclical headwinds; financials and consumer sectors improving |
| Market Drivers | AI spending, energy transition, supply chain diversification, and capital expenditures by hyperscalers |
You can see that the S&P 500 earnings growth rate for Q4 2024 hit 18.2%, the highest since Q4 2021. This strong growth supports the bull market story. While some forward estimates have been revised down, the overall trend stays positive. Morgan Stanley also reports that more analysts are raising their earnings forecasts, which often leads to higher stock prices. Their 12-month target for the S&P 500 is 6,500, suggesting more room for equities to climb.
When you put it all together, strong earnings and a healthy economy make a solid bullish case for stocks. You see why many investors stay optimistic about the bull market, even with some bumps along the way.
Bearish Signals
Image Source: pexels
Valuations and Risks
You might notice that some numbers make the bearish case for stocks stronger. When you look at valuations, things can get risky fast. Here are a few signs that should catch your eye:
- The Buffett Indicator now stands at 196.9% of GDP. This is way above the 140% level that signals extreme overvaluation.
- The Median PE ratio suggests the market would need to drop by about 31.5% just to reach fair value.
- Forward P/E ratios have dropped, especially for big tech companies. The ‘Magnificent 7’ tech stocks saw their forward P/E fall from 33x last year to just above 24x by March 2025.
- Most valuation indicators still show stocks are expensive, even if they have come down a bit.
- The 10-year Treasury Yield MACD trend points to rising interest rates, which usually puts pressure on stocks.
- The yield curve has turned positive after 30 months, a move that often comes before a recession.
- The Dollar/Yen exchange rate shows a stronger Yen, which hints at tighter global liquidity.
- High yield junk bonds and small-cap stocks are flashing bearish signals too.
You also see negative correlations between unrealized profits and daily returns, as well as between MVRV and daily returns. This means price drops often come with more volatility. When trading activity goes up, so does market instability. Net flows of liquid Bitcoin link to short-term volatility, showing that selling pressure can shake the market.
Market Stress
Market stress can build up quickly. You see it in more than just falling prices. The Volatility of Volatility (DVol) Index tracks how fast market volatility changes. When this index spikes, it means risk perception is shifting fast and anxiety is rising. The OFR Financial Stress Index looks at credit spreads, equity valuations, funding conditions, and safe asset prices. It gives you a full picture of stress across the market.
Recent studies show that sudden jumps in volatility often come before financial crises. Higher volatility makes investors nervous, slows down investment, and can even lead to recessions. Sectors like finance feel this stress the most. When uncertainty about the economy rises, market volatility usually follows. This is why you need to watch these signals closely. They help you spot trouble before it gets worse.
Investor Strategies
Adapting to Uncertainty
You face a lot of uncertainty in today’s market. Many investors want to make big changes when things feel shaky, but experts suggest you should wait for strong signs before making major moves. Right now, the chance of a U.S. recession sits at 55%. That’s not high enough for most investors to shift their portfolios in a big way. Instead, you might see people making small changes, like adjusting how much risk they take or tweaking their credit exposure.
A lot of investors keep a balanced approach. On average, portfolios hold about 60% in stocks and 40% in bonds or other assets. In 2024, investors increased their stock holdings by 4.1% and used more ETFs, which now make up 69% of portfolios. You also see more money going into technology and communication services, while defensive sectors dropped by over 4%. Most investors still prefer U.S. stocks, with 81.3% of equity investments staying in the U.S. market.
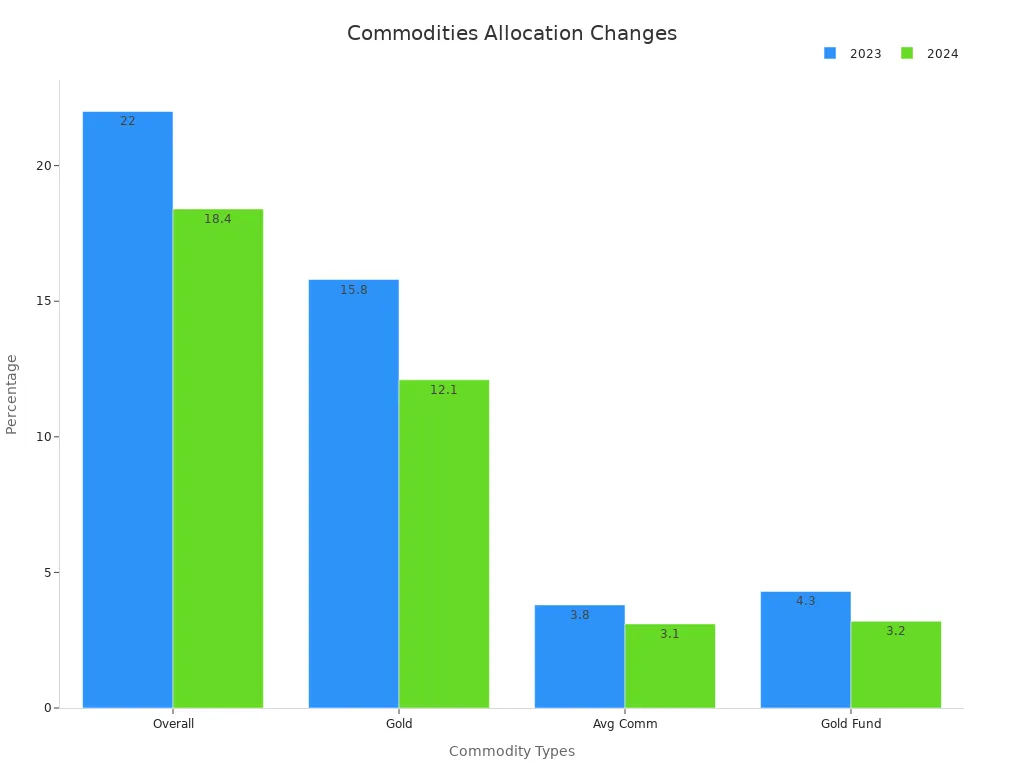
Here’s a quick look at how portfolios changed from 2023 to 2024:
| Portfolio Change | 2023 | 2024 |
|---|---|---|
| Equity Allocation | 55.9% | 60% |
| ETF Usage | 63% | 69% |
| U.S. Equity Allocation | 78.9% | 81.3% |
| Commodities Allocation | 3.8% | 3.1% |
| Gold Holdings | 15.8% | 12.1% |
Diversification remains a key strategy. If you spread your investments across different assets, you lower your risk. Studies show that diversified portfolios can outperform single-asset investments by nearly 20% over ten years. Regularly checking and rebalancing your portfolio can also boost your returns and help you stay on track during market swings.
- Diversified portfolios tend to handle market turmoil better.
- Annual rebalancing can improve returns by about 1% each year.
- Mixing stocks, bonds, and alternatives helps you weather ups and downs.
Risk Management
Managing risk is just as important as picking the right investments. You can use tools like statistical analysis and scenario testing to see how your portfolio might react to different market events. Many investors use historical data to spot patterns and prepare for downturns. For example, looking at past market declines helps you understand what might happen next.
You might also use advanced models that track market volatility and efficiency. These models help you make smarter choices and avoid big losses. Some investors rely on AI and machine learning to monitor risks in real time. This gives you a better chance to react quickly if the market changes.
Quantitative tools, like Monte Carlo analysis or sensitivity tests, let you measure risk and plan your next steps. These tools help you decide when to hedge or adjust your investments. Building a risk-aware mindset and staying flexible can make a big difference. You want to stay calm, review your strategy often, and avoid making decisions based on fear.
Tip: Regularly review your portfolio and use both simple and advanced risk tools. This helps you stay prepared for whatever the market brings.
You’ve seen both bullish and bearish sides of the market. Here’s a quick comparison:
| Pattern Type | Success Rate | Volume Behavior |
|---|---|---|
| Bullish | 67% | Lower volume during consolidation, higher on breakout |
| Bearish | 64% | Higher volume during pattern formation |
Staying flexible helps you handle changes. In bull markets, buy-and-hold works well. In bear markets, focus on protecting your money and using different assets. To keep your strategy strong:
- Set clear goals.
- Pick the right mix of investments.
- Check your results often.
- Adjust for fees, taxes, and inflation.
- Rebalance your portfolio when needed.
Research shows that monitoring the market and staying flexible leads to better long-term results. Keep learning and review your plan as the market outlook shifts.
FAQ
What is the difference between a bull and bear market?
You see a bull market when prices rise by 20% or more from recent lows. A bear market happens when prices fall by 20% or more from recent highs. These terms help you understand market trends.
How can you tell if the market is about to change direction?
Look for signals like changes in trading volume, shifts in investor sentiment, or economic news. Analysts also watch moving averages and volatility indexes. These clues can help you spot a possible market turn.
Should you change your investment strategy during uncertain markets?
You do not need to make big changes right away. Many experts suggest you review your goals and rebalance your portfolio. Staying diversified helps you manage risk when markets feel uncertain.
Why do analysts use the S&P 500 to judge market trends?
The S&P 500 tracks 500 large companies in the United States. It gives you a broad view of the stock market. Many investors and analysts use it as a benchmark for overall market health.
In today’s market, with bullish signals like 15% S&P 500 earnings growth and bearish risks like high valuations, investors need agility to thrive. Diversifying across assets while managing costs is crucial to navigate uncertainty. BiyaPay empowers you with a unified platform to trade U.S. stocks, HK stocks, and cryptocurrencies, leveraging real-time USDT-to-USD/HKD conversions to optimize returns.
Backed by FinCEN, FINTRAC MSB, and SEC RIA compliance, BiyaPay ensures secure trading. Set up your account in minutes to act swiftly in volatile markets. Join BiyaPay today to build a resilient portfolio. Start trading now to seize 2025’s opportunities!
*This article is provided for general information purposes and does not constitute legal, tax or other professional advice from BiyaPay or its subsidiaries and its affiliates, and it is not intended as a substitute for obtaining advice from a financial advisor or any other professional.
We make no representations, warranties or warranties, express or implied, as to the accuracy, completeness or timeliness of the contents of this publication.


Contact Us
Company and Team
BiyaPay Products
Customer Services


is a broker-dealer registered with the U.S. Securities and Exchange Commission (SEC) (No.: 802-127417), member of the Financial Industry Regulatory Authority (FINRA) (CRD: 325027), member of the Securities Investor Protection Corporation (SIPC), and regulated by FINRA and SEC.
registered with the US Financial Crimes Enforcement Network (FinCEN), as a Money Services Business (MSB), registration number: 31000218637349, and regulated by FinCEN.
registered as Financial Service Provider (FSP number: FSP1007221) in New Zealand, and is a member of the Financial Dispute Resolution Scheme, a New Zealand independent dispute resolution service provider.