- EasyCard
- Trade
- Help
- Announcement
- Academy
- SWIFT Code
- Iban Number
- Referral
- Customer Service
- Blog
- Creator
Easy Ways to Decode Economic Trends under Trump’s Leadership


Image Source: pexels
Many people feel lost when they hear phrases like trump is going to crash the economy or see economic headlines that seem to change every day. Numbers and charts fill the news, making it hard to know what really matters.
Many Americans saw rising uncertainty during Trump’s term.
- The Economic Policy Uncertainty Index hit record highs.
- Consumer confidence dropped by nearly 16%.
- Business uncertainty climbed to its second highest reading ever.
- Stock markets showed sharp swings, with the Dow Jones and Nasdaq losing value.
A quick look at the numbers shows why people get confused:
| Economic Indicator | Data / Observation |
|---|---|
| Real GDP per capita growth | Obama average (2010 onward): 1.4% annually; Trump average: 2.0% annually; slowed to 1.8% in 2019 |
| Stock Market (S&P 500) | Average daily increase: 0.0502% (Trump); 20% drop Oct-Dec 2018 due to trade war |
| Unemployment rate | Fell from 4.7% to 3.5%, lowest since 1969 |
| Manufacturing jobs | 500,000 created since election, but only 61,000 since Dec 2018 |
| Trade deficit | Increased by 23% from last Obama year to 2019 |
No economics degree is needed here. Simple explanations and real-life examples help anyone feel confident when reading economic news.
Key Takeaways
- GDP growth under Trump showed moderate gains with a peak in 2018 but slowed before the 2020 recession caused by COVID-19.
- Unemployment reached a 50-year low before the pandemic, but manufacturing jobs declined overall due to losses in 2020.
- The stock market hit record highs thanks to tax cuts and deregulation, though trade wars caused sharp swings and uncertainty.
- Tariffs raised prices on many everyday goods, costing families more and affecting trade balances negatively.
- National debt grew rapidly due to tax cuts, increased spending, and pandemic relief, reaching its highest level since World War II.
GDP
What Is GDP
Gross domestic product, or GDP, measures the total value of goods and services produced within the United States in a year. Economists use GDP to track economic growth and compare it across different periods. The calculation of GDP includes several parts:
- Personal consumption, such as spending on food, clothing, and housing
- Business investment in equipment, buildings, and technology
- Government spending on things like roads, schools, and military equipment
- Net exports, which means exports minus imports
Government spending counts toward GDP, but transfer payments like Social Security do not. When people spend money from these payments, that spending becomes part of personal consumption. The Bureau of Economic Analysis tracks these numbers and reports them every quarter.
Trends Under Trump
The United States saw changes in GDP during Trump’s presidency. The table below shows the annual GDP growth rates:
| Year | GDP Growth Rate (%) |
|---|---|
| 2017 | Positive growth |
| 2018 | 3.0 |
| 2019 | 2.5 |
| 2020 | -2.2 |
The highest growth rate reached 3.0% in 2018, which was the best since 2005. In 2020, the economy faced a recession due to the COVID-19 pandemic, causing GDP to drop by 2.2%. The promised 4% to 6% annual growth did not happen. The federal government’s share of GDP stayed around 6.4%, similar to earlier years.
Reading GDP Data
GDP changes affect daily life in many ways. When GDP rises, people often see more jobs, higher wages, and better business profits. During Trump’s term, the unemployment rate dropped to a 50-year low in 2019. Wage growth increased in 2018 and 2019. The S&P 500 Index reached record highs, showing strong investor confidence. Inflation stayed close to 2.0%, which helped keep prices stable. However, the recession in 2020 led to job losses and business closures. Tariffs raised prices on goods like groceries and cars. The 2017 Tax Cuts and Jobs Act lowered corporate taxes, which boosted consumer spending and profits. GDP data helps people understand if the country is growing or facing a recession. It also shows how global economic growth and local events can impact the economy.
Jobs
Unemployment Rate
The unemployment rate shows how many people who want jobs cannot find them. During Trump’s presidency, the unemployment rate dropped from 4.7% in January 2017 to 3.5% by late 2019. This marked the lowest level in 50 years. For 22 months, the rate stayed at or below 4%, a streak not seen since 1970. The trend continued from the previous administration, which also saw steady declines. In early 2020, the COVID-19 pandemic caused a sharp rise, peaking at 14.7% in April. By the time Trump left office, the rate had fallen again to 6.7%. Experts say that these changes reflected real economic conditions, not data manipulation. The Bureau of Labor Statistics confirmed the accuracy of the numbers.
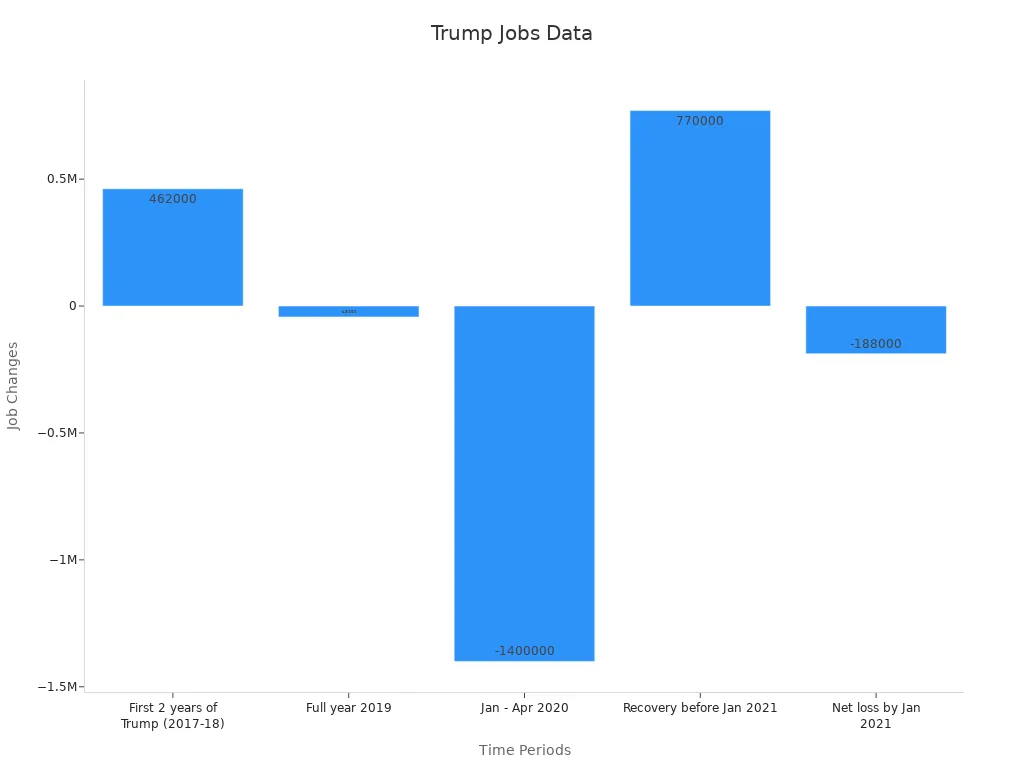
Manufacturing Jobs
Manufacturing jobs are important for many families. Trump promised to bring back these jobs. Before the pandemic, the country gained over 350,000 manufacturing jobs. However, growth slowed in 2019. The pandemic led to a sudden loss of 1.3 million manufacturing jobs between March and April 2020. By January 2021, the country had 178,000 fewer manufacturing jobs than when Trump took office. The table below shows key changes:
| Time Period | Manufacturing Job Change | Additional Context |
|---|---|---|
| Trump inauguration to Sept 2019 | +482,000 jobs | Growth after earlier decline |
| 2019 (full year) | -43,000 jobs | Growth stalled |
| End of Trump presidency (Jan 2021) | -188,000 jobs (net loss) | Pandemic losses included |
Wage Growth
Wage growth measures how much workers’ pay increases over time. During Trump’s first three years, real wages rose, but not at record rates. Real consumption per person grew about 2% each year, which ranked in the lower half of similar periods since 1929. The real median family income increased by about $5,800. However, wage growth did not match the rapid gains seen in the 1960s. Most workers saw modest improvements, while top earners gained more.
Tip: When reading job data, look for trends over several years, not just one month. This helps show the real direction of the economy and what it means for workers’ lives.
Stock Market

Image Source: pexels
Market Basics
The stock market lets people buy and sell shares of companies. Investors watch indexes like the S&P 500, Dow Jones, and NASDAQ to see how the market performs. These indexes show the average value of many companies. When the stock market rises, it often means companies are earning more money. People may feel more confident about spending and investing. The market reacts to news about the economy, interest rates, and government policies.
- The S&P 500 reached record highs during Trump’s presidency.
- The Dow Jones gained 10,000 points in just three years, the fastest ever.
- The S&P 500 had a 29% return in 2019, one of its best years.
Trump’s Impact
Trump’s policies had a strong effect on the stock market. He cut corporate taxes and reduced regulations, which helped many companies earn more. The market saw long bull runs, with the S&P 500 rising for nearly 11 years. His trade policies, like tariffs on China, caused sharp swings in prices. When Trump announced new trade deals or tariffs, the market often moved quickly. For example, after he criticized Taiwan’s chip makers, their stocks dropped 15%. Attacks on U.S. tech companies led to a 10% fall in the Nasdaq 100, erasing $1.7 trillion in value. The market also reacted to his stance on green energy, causing sell-offs in wind and solar stocks. After Trump’s 2024 election win, the S&P 500 jumped 2.5% in one day, the best post-election gain in over a century.
Market Volatility
The stock market showed high volatility during Trump’s term. The VIX, which measures market fear, hit high levels in 2016 and during trade war news. The table below shows how the market changed:
| Year | S&P 500 High-Low Difference | VIX Maximum |
|---|---|---|
| 2012 | 250 points | 27 |
| 2016 | 400 points | 40 |
Trade wars and tariff threats made investors nervous. The COVID-19 pandemic caused a sharp crash, but the market recovered fast after government stimulus. Traders watched for policy changes and tried to profit from big swings. Sector impacts varied, with technology and financials often leading gains or losses. The stock market reflected both optimism and uncertainty during Trump’s leadership.
Inflation
What Is Inflation
Inflation means the general rise in prices over time. People notice inflation when the cost of groceries, gas, or clothes goes up. The Consumer Price Index (CPI) is the main tool used to measure inflation in the United States. When inflation increases, each dollar buys less than before. Economists also watch interest rates because they often rise when inflation goes up. Higher interest rates can make loans and credit cards more expensive.
| Indicator | Description / Value |
|---|---|
| Average Year-over-Year Inflation | 1.9% to 2.46% (depending on data source) |
| Consumer Price Index (CPI) | Main measure of inflation in the U.S. |
| TIPS inflows | Record highs after Trump’s election, showing inflation expectations |
| 10-year Treasury Yields | Rose by 30 basis points after election, signaling inflation concerns |
| Fiscal Policy Context | Tax cuts, tariffs, and spending proposals influenced inflation expectations |
Trump-Era Rates
During Trump’s presidency, inflation stayed close to 2% on average. Some sources reported a rate of 1.9%, while others showed 2.46%. These numbers were lower than the rates seen after his term. The Federal Reserve watched inflation and adjusted interest rates to keep prices stable. After Trump’s election, 10-year Treasury yields rose, which signaled that investors expected higher inflation. The administration’s tax cuts, tariffs, and spending plans all played a role in shaping inflation trends.
Why It Matters
Inflation affects everyone. When prices rise, families may spend more on basic needs and cut back on extras. Retailers like Walmart raised prices because of tariffs, which made some goods more expensive. Surveys showed that many Americans worried about inflation and changed their spending habits. Some people saved more money instead of spending it. Interest rates also matter because they affect the cost of borrowing. When inflation goes up, the Federal Reserve may raise interest rates to slow down price increases. This can make it harder for people to buy homes or cars.
- 25% of Americans said inflation and prices were their top concern.
- 44% strongly disapproved of Trump’s handling of inflation.
- Only 35% approved of his approach.
- Tariffs led to higher prices for many goods, changing how people spent money.
- Interest rates rose after the election, reflecting inflation worries.
Tip: Watch both inflation and interest rates to understand how the economy affects your wallet. Even small changes can have a big impact on daily life.
Tariffs
Image Source: pexels
Trade Wars
During Trump’s presidency, the United States started a trade war with several countries. The government placed tariffs on steel and aluminum, with rates as high as 25%. These actions targeted major trading partners such as China, Canada, Mexico, the European Union, India, and Turkey. The trade war began in March 2018 and quickly grew. Each country responded with its own tariffs on American goods. This led to a loss or diversion of $2.55 billion in US exports every month. Local economies in areas that depended on exports suffered. In some counties, Republican candidates lost 1.4 to 2.7 percentage points in vote share because of the trade war’s impact.
| Metric | Numerical Evidence |
|---|---|
| Value of trade affected by tariffs | Over $380 billion |
| Estimated tax increase due to tariffs | Nearly $80 billion |
| Export losses from retaliatory tariffs (2018-2019) | $27 billion |
| Monthly export losses due to retaliation | $2.55 billion per month |
| Estimated increase in US output if tariffs reversed | 4% over three years |
| Production increase in protected industries (steel, aluminum) | $2.8 billion |
| Production decrease in downstream industries | $3.4 billion |
| Employment impact | Negative effects in agriculture and regions exposed to retaliation, no significant positive employment effect in protected sectors |
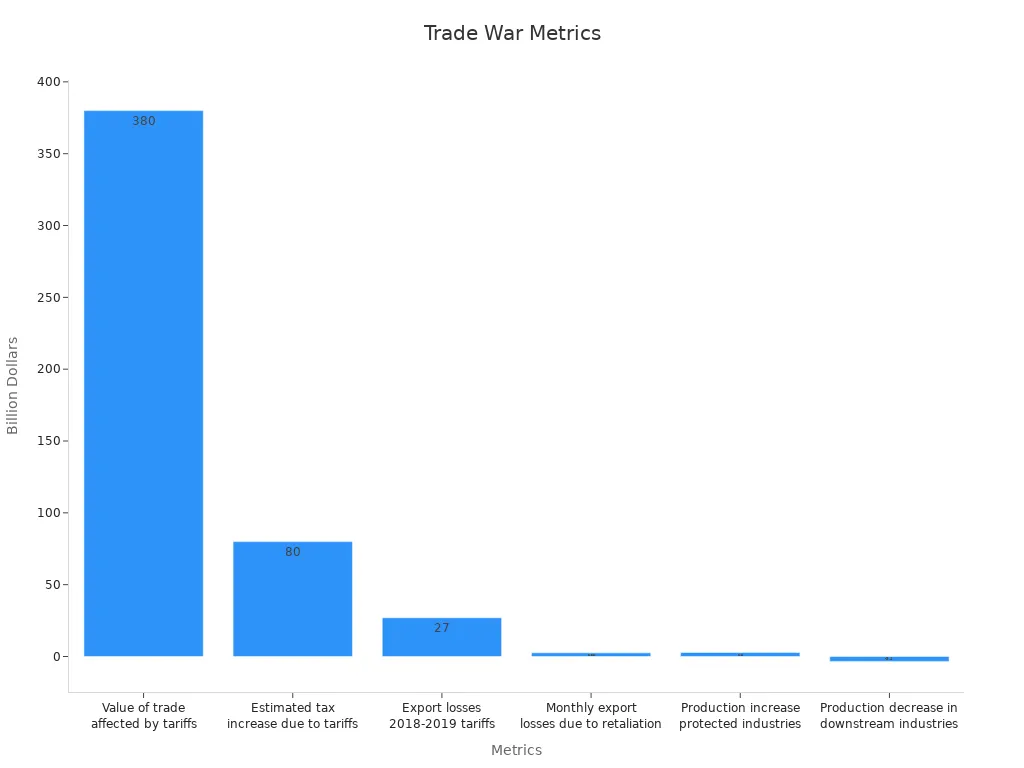
Tariff Effects
Tariffs are taxes on imported goods. When the government adds tariffs, the prices of those goods rise. The Trump administration’s tariffs affected over $380 billion in trade. These tariffs raised nearly $80 billion in new taxes. The trade war caused the worst two-day loss in US stock market history, wiping out $6.6 trillion in value. Global equity value dropped by $10 trillion in three days. Commodity prices also fell. Gold dropped 2%, oil prices fell over 9%, and Bitcoin lost 30% of its value. Tariffs led to higher costs for businesses and consumers. Industries that used steel and aluminum paid more, while protected industries saw only small gains. Downstream industries, like car makers, lost $3.4 billion in production.
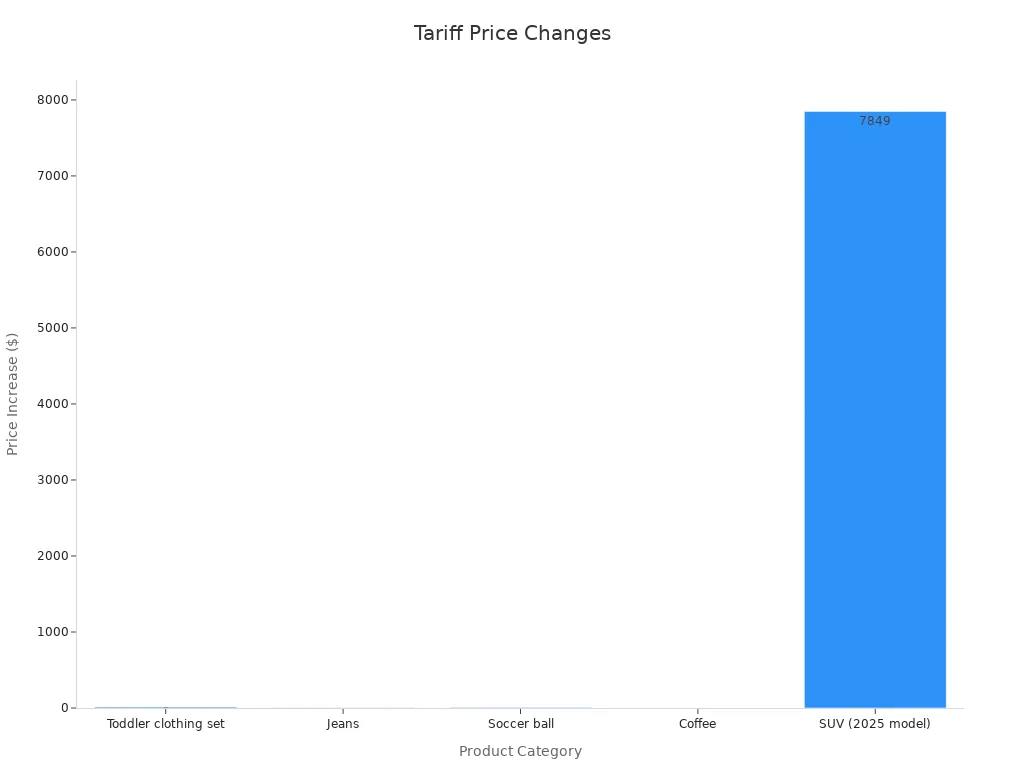
Consumer Impact
Consumers felt the effects of the trade war in their wallets. Everyday items became more expensive. For example, a toddler clothing set rose from $24.00 to $35.76 after a 49% tariff. Jeans increased by $4.00, and a new SUV cost $7,849 more. The Trump administration raised tariffs on Chinese goods to an overall rate of 104%. This doubled prices for some imports. A Playstation 5 jumped from $499 to $1,018. Research shows these tariffs raised prices by an average of 2.3 percentage points. The average American household paid about $3,800 more each year. Federal Reserve Chairman Jerome Powell warned that tariffs added to inflation. Trade deficits also grew, as the US imported more than it exported. A trade deficit means the country buys more from other countries than it sells. Subsidies are payments from the government to help certain industries, but they did not fully offset the higher prices caused by tariffs.
| Product Category | Original Price | Tariff Rate | New Price Estimate | Price Increase |
|---|---|---|---|---|
| Toddler clothing set | $24.00 | 49% | $35.76 | +$11.76 |
| Jeans | $39.98 | 10% | $43.98 | +$4.00 |
| Soccer ball | $17.99 | 29% | $23.21 | +$5.22 |
| Coffee | $8.30 | 10% | $9.13 | +$0.83 |
| SUV (2025 model) | $31,395 | 25% | $39,244 | +$7,849 |
Tip: When reading about trade wars, check how tariffs affect both prices and the trade deficit. Higher tariffs often mean higher prices for everyone.
Debt
National Debt
The national debt is the total amount of money the United States government owes to creditors. During Trump’s presidency, the national debt grew quickly. The government borrowed more to pay for tax cuts, increased spending, and emergency relief during the COVID-19 pandemic. The table below shows how the debt changed:
| Metric | Value |
|---|---|
| National debt at start of Trump presidency | ~$20.24 trillion |
| National debt on January 20, 2021 | ~$27.75 trillion |
| Total increase in national debt | > $7.5 trillion |
| Percentage increase in national debt | 37.1% |
| Daily debt increase rate | $5.138 billion |
| CARES Act stimulus amount | $2.2 trillion |
This 39% jump in debt happened even before the pandemic hit full force. Spending on agriculture also rose by 194%, from $14.2 billion to $41.7 billion.
Deficit
A deficit happens when the government spends more money than it collects in taxes each year. Under Trump, the deficit grew larger than the 50-year average. The Congressional Budget Office reported that the federal deficit reached $779 billion in 2018, a 17% increase from the year before. In 2019, the deficit passed $1 trillion for the first time since 2012. By 2020, the deficit soared to $893 billion in just one year. Experts say these high deficits are unusual during times of economic growth. The 2017 tax cuts and higher spending made the gap wider. Projections show the average deficit could reach 4.4% of GDP from 2020 to 2029, much higher than the long-term average of 2.9%.
Debt-to-GDP
The debt-to-GDP ratio compares what the country owes to what it produces in a year. This number helps people see if the debt is manageable. During Trump’s term, the debt-to-GDP ratio reached its highest level since World War II. Several patterns stand out:
- The debt-to-GDP ratio increased even while the economy grew.
- Republican presidents since WWII, including Trump, often expanded government debt more than Democratic presidents.
- The 2018 tax reform, passed during economic growth, added to the debt.
- Research shows that switching from a Republican to a Democratic president usually lowers the debt-to-GDP ratio by 1.8% per year.
A high debt-to-GDP ratio can make it harder for the government to respond to future crises. It may also lead to higher interest rates, which means the government pays more to borrow money. Over time, this can affect programs for education, healthcare, and infrastructure. Future generations may face tough choices if debt keeps rising and interest rates go up.
Data Reliability
Data Concerns
Many people wonder if they can trust government economic data. During Trump’s presidency, experts raised several concerns about data reliability. Some changes in how the government handled economic data made people uneasy.
- The Trump administration disbanded two outside advisory committees. These groups had helped improve the accuracy of government economic reports. Their removal worried many experts.
- Commerce Secretary Howard Lutnick suggested changing how the government calculates GDP. He wanted to remove government spending from the formula. This would break with international standards and could hide the effects of spending cuts.
- President Trump often questioned official data when it did not support his message. He accepted positive numbers but doubted negative ones. This approach made some people think the data was being politicized.
- Experts like Erica Groshen, a former commissioner at the Bureau of Labor Statistics, warned about possible political or financial motives behind data changes. However, no direct evidence of tampering appeared.
- Budget cuts and staff losses made it harder to collect accurate data. Many experienced workers left their jobs. Fewer people responded to government surveys, which lowered data quality.
- Experts called the disbanding of advisory committees a “yellow caution flag.” They warned that any manipulation could hurt the credibility of U.S. statistics and affect global markets.
These actions did not prove that data was changed, but they raised important questions about trust.
Reading Between the Lines
People can take steps to judge the reliability of economic news. First, they should check if the data comes from trusted sources like the Bureau of Labor Statistics or the Bureau of Economic Analysis. Reports from these agencies follow strict rules.
Readers should look for news that explains how data is collected. Reliable articles often mention survey methods or sample sizes. If a report only shows one month or one number, it may not tell the whole story. Comparing data over several months or years gives a clearer picture.
Tip: Watch for signs of bias. If a source always supports one side or changes its story, readers should be careful. Trusted sources show both good and bad news.
People can also check if other news outlets report the same numbers. When many trusted sources agree, the data is more likely to be accurate. By following these steps, anyone can feel more confident when reading economic news.
“trump is going to crash the economy”
Economic Fears
The phrase trump is going to crash the economy became common in news stories and social media. Many people worried about a possible recession or sudden job losses. These fears grew as headlines showed sharp drops in the stock market and rising unemployment claims. Some experts pointed to policy changes, such as new tariffs and threats of mass deportations, as reasons for concern. People also saw warnings about cuts to Medicaid and possible federal layoffs. These changes made families feel less secure about their jobs and savings.
A table below shows some of the main reasons for public concern:
| Evidence Type | Description |
|---|---|
| Stock Market Data | Near free fall in stock market values indicating investor panic and economic instability. |
| Unemployment Claims | Noticeable jump in unemployment insurance claims for federal workers before full layoffs took effect. |
| GDP Growth Projections | Sharp contraction in GDP growth projections for Q1 2025, with some forecasts showing outright contraction. |
| Economic Policy Uncertainty | Measures of policy uncertainty rival or exceed those during the worst phases of the COVID-19 pandemic. |
| Tariffs Impact | Tariffs imposed by the Trump administration increased costs for consumers and stunted export growth. |
| Mass Deportations Threat | Threatened mass deportations expected to reduce labor supply, causing price spikes in food and housing. |
| Medicaid Cuts and Layoffs | Proposed Medicaid cuts and federal layoffs reduce demand and increase economic anxiety among consumers. |
| Consumer Confidence | Consumer confidence dropped to lows comparable to the COVID-19 pandemic, reflecting growing fears. |
Recent Commerce Department data showed the U.S. GDP shrank by 0.3% in the first quarter of 2025. This drop followed a period of 2.4% growth in late 2024. The contraction came after a surge in imports before new tariffs took effect. These events led to a spike in Google searches for “recession,” showing that many people feared trump is going to crash the economy.
Reality Check
While fears about trump is going to crash the economy spread quickly, the actual data tells a more complex story. Many economic indicators remained strong through late 2024. The table below compares key statistics from Trump’s term to earlier periods:
| Economic Metric | Period Ending Q3 2024 | Previous 2008–2019 Cycle Average | 2014–2019 Recovery Average |
|---|---|---|---|
| Real GDP Growth (annualized) | 2.7% | 1.8% | 2.6% |
| Productivity Growth (annualized) | 2.4% | 1.5% | N/A |
| Private Nonresidential Investment Growth | 4.0% | 3.2% | N/A |
| Public Investment Growth | 6.8% | 0.5% | N/A |
| Employment-to-Population Ratio (Prime-age workers) | Highest since 2001 | N/A | N/A |
| Labor Force Participation Rate (Prime-age workers) | Highest since 2001 | N/A | N/A |
These numbers show that, before the recent contraction, the economy outperformed the previous business cycle. Real GDP growth, productivity, and investment all rose above past averages. The employment-to-population ratio and labor force participation rate for prime-age workers reached their highest levels since 2001. This data suggests that, despite fears and warnings, trump is going to crash the economy did not match the reality for most of his term. While some risks remain, the overall record does not support claims of a major recession or lasting economic instability under Trump’s leadership.
Quick Tips
Spotting Trends
Readers can spot economic trends by watching a few important signals. Leading indicators help predict what might happen next in the economy. These include new unemployment claims, consumer confidence surveys, and the purchasing managers index. When these numbers change, they often show where the economy is heading. Coincident indicators, like GDP and current employment numbers, show what is happening right now. Lagging indicators, such as the unemployment rate, confirm trends after they happen.
The Beige Book, released by the Federal Reserve eight times a year, gives stories from different regions. This report often hints at future Federal Open Market Committee actions. Housing data and the yield curve also give clues about growth or slowdowns. People who follow these signals can better understand how trade policies, like tariffs or new agreements, affect the economy. Watching how trade numbers change over time helps reveal the impact of government actions.
Tip: Look for patterns in trade data, not just one-time changes. A steady rise or fall often means more than a single spike.
Economic Checklist
A quick-reference checklist helps readers decode economic news with confidence. The following list covers the most useful indicators for the Trump era:
- GDP growth rates
- Unemployment claims and overall unemployment rate
- Consumer confidence index
- Housing starts and sales
- Purchasing managers index (PMI)
- Yield curve (difference between short- and long-term interest rates)
- Producer price index (PPI)
- Trade balance and trade deficit numbers
- Beige Book summaries
This checklist lets readers connect the dots between trade policy, job numbers, and market changes. For example, a rise in the trade deficit may signal that imports are growing faster than exports. Changes in the producer price index can show how trade tariffs affect business costs. By checking these indicators, anyone can see how trade, jobs, and prices move together. This approach makes it easier to spot real trends and avoid being misled by headlines.
Understanding economic trends from Trump’s presidency becomes easier with clear definitions and real examples. Readers can use the quick-reference checklist to interpret news and data with confidence. Economic indicators like GDP, jobs, and inflation show important patterns.
Anyone can learn to read economic news without an economics degree. Using these tips, readers can stay informed and make sense of future updates. Economic news remains accessible to everyone who wants to learn.
FAQ
What does GDP growth mean for families?
GDP growth often means more jobs and higher wages. When the economy grows, businesses hire more workers. People may see better job opportunities. Families can afford more goods and services. Slow or negative growth can lead to job losses and less spending.
How did tariffs affect everyday prices?
Tariffs raised the cost of imported goods. For example, a toddler clothing set increased from USD 24.00 to USD 35.76 after tariffs. Many families paid more for items like jeans, cars, and electronics. Tariffs also made some American-made products more expensive.
Why did the national debt rise so much?
The government spent more on tax cuts, military, and emergency relief. The COVID-19 pandemic led to extra spending. The national debt grew from about USD 20.24 trillion to USD 27.75 trillion. This increase happened even before the pandemic reached its peak.
Can people trust economic data from the Trump era?
Most official data came from trusted agencies like the Bureau of Labor Statistics. Some experts worried about changes in data collection. Readers should check sources and compare reports. Reliable news often explains how data was gathered and shows trends over time.
Trump’s economic policies brought growth (3.0% GDP in 2018) but also volatility from tariffs and trade wars, challenging investors to stay agile. With tariffs raising costs and markets swinging, cross-border trading demands efficiency. BiyaPay offers a seamless platform to trade U.S. stocks, HK stocks, and cryptocurrencies, with real-time USDT-to-USD/HKD conversions and fees as low as 0.5%.
Backed by FinCEN, FINTRAC MSB, and SEC RIA compliance, BiyaPay ensures secure investing. Register in minutes to navigate economic shifts confidently. Join BiyaPay now to diversify your portfolio! Start trading today to thrive in 2025’s dynamic markets!
*This article is provided for general information purposes and does not constitute legal, tax or other professional advice from BiyaPay or its subsidiaries and its affiliates, and it is not intended as a substitute for obtaining advice from a financial advisor or any other professional.
We make no representations, warranties or warranties, express or implied, as to the accuracy, completeness or timeliness of the contents of this publication.


Contact Us
Company and Team
BiyaPay Products
Customer Services


is a broker-dealer registered with the U.S. Securities and Exchange Commission (SEC) (No.: 802-127417), member of the Financial Industry Regulatory Authority (FINRA) (CRD: 325027), member of the Securities Investor Protection Corporation (SIPC), and regulated by FINRA and SEC.
registered with the US Financial Crimes Enforcement Network (FinCEN), as a Money Services Business (MSB), registration number: 31000218637349, and regulated by FinCEN.
registered as Financial Service Provider (FSP number: FSP1007221) in New Zealand, and is a member of the Financial Dispute Resolution Scheme, a New Zealand independent dispute resolution service provider.