- EasyCard
- Trade
- Help
- Announcement
- Academy
- SWIFT Code
- Iban Number
- Referral
- Customer Service
- Blog
- Creator
Inauguration Day and the Stock Market: What Investors Should Know in 2025


Image Source: unsplash
Inauguration day often draws intense focus from investors, yet the stock market does not always react in predictable ways. After inauguration day on January 20, 2025, the S&P 500 dropped by more than 17 percent, showing how political shifts and new policies can influence market sentiment. Investors watch inauguration day closely, seeking clues about future market direction and asking questions such as, “is the stock market open on inauguration day?” While some years bring sharp moves, history shows that inauguration day itself usually matters less than the policies that follow.
Key Takeaways
- The stock market usually stays open on Inauguration Day unless it falls on a federal holiday like Martin Luther King Jr. Day.
- Market moves on Inauguration Day vary widely and depend more on economic conditions and investor sentiment than the event itself.
- Stock market performance often differs under Democratic and Republican presidents, with economic growth generally stronger during Democratic terms.
- Investors should focus on long-term fundamentals and policy signals rather than reacting to short-term market swings around Inauguration Day.
- In 2025, watching technology, AI infrastructure, and sector trends can help investors find opportunities amid political and economic changes.
Inauguration Day and Market Moves

Image Source: pexels
Is the Stock Market Open on Inauguration Day
Many investors ask, is the stock market open on inauguration day? The answer is usually yes. The New York Stock Exchange and Nasdaq both operate on Inauguration Day unless it falls on a federal holiday. For example, if Inauguration Day lands on Martin Luther King Jr. Day, the market closes because of the holiday, not because of the inauguration. Since Martin Luther King Jr. Day always occurs on the third Monday in January, and Inauguration Day is set for January 20, the two dates sometimes overlap. When this happens, investors find the market closed, but this is rare. Most years, when people wonder, is the stock market open on inauguration day, they discover that trading continues as usual. This pattern helps investors plan their strategies and manage their portfolios without interruption. Understanding if the market is open allows investors to respond to any news or policy announcements that may come out during the event.
Why Investors Watch Inauguration Day
Investors closely monitor Inauguration Day because it often brings new policies and changes in government leadership. They want to know, is the stock market open on inauguration day, so they can react to any immediate market moves. Before the 2025 inauguration, the market showed increased volatility. Small-cap stocks underperformed, and the Russell 2000 entered correction territory. The Nasdaq 100 had its largest weekly decline since mid-November, dropping 2.34%. Technology and growth sectors faced pressure, while value stocks remained more stable. These shifts reflected investor concerns about policy uncertainty and economic signals like strong payroll data and rising Treasury yields. On President Biden’s Inauguration Day in 2021, the Dow Jones, Nasdaq, and S&P 500 all reached record highs. These examples show why investors ask, is the stock market open on inauguration day, and why they pay close attention to market trends during this period.
S&P 500 Performance on Inauguration Day

Image Source: pexels
Day-of Returns
The S&P 500 performance on Inauguration Day often draws attention from investors who want to understand how political changes might affect the U.S. stock market. However, historical data shows that there is no consistent pattern of gains or losses on this day. For example, on January 20, 2009, the S&P 500 dropped by 5.3%. This sharp decline reflected the financial crisis at the time, not the new president’s policies. In contrast, the 2021 Inauguration Day saw a positive return for the S&P 500, with the index rising as investors responded to expectations of economic recovery.
Recent years highlight this variability. The 2025 Inauguration Day, which marked President Trump’s second term, saw significant negative returns and the worst start in modern history for the S&P 500. Meanwhile, President Biden’s inauguration in 2021 brought a positive day-of return. These examples show that market trends on Inauguration Day often depend on the economic environment and investor sentiment rather than the event itself.
Investors should note that the S&P 500’s day-of returns on Inauguration Day can swing in either direction. The market’s reaction often reflects the conditions left by the previous administration and the outlook for new policies.
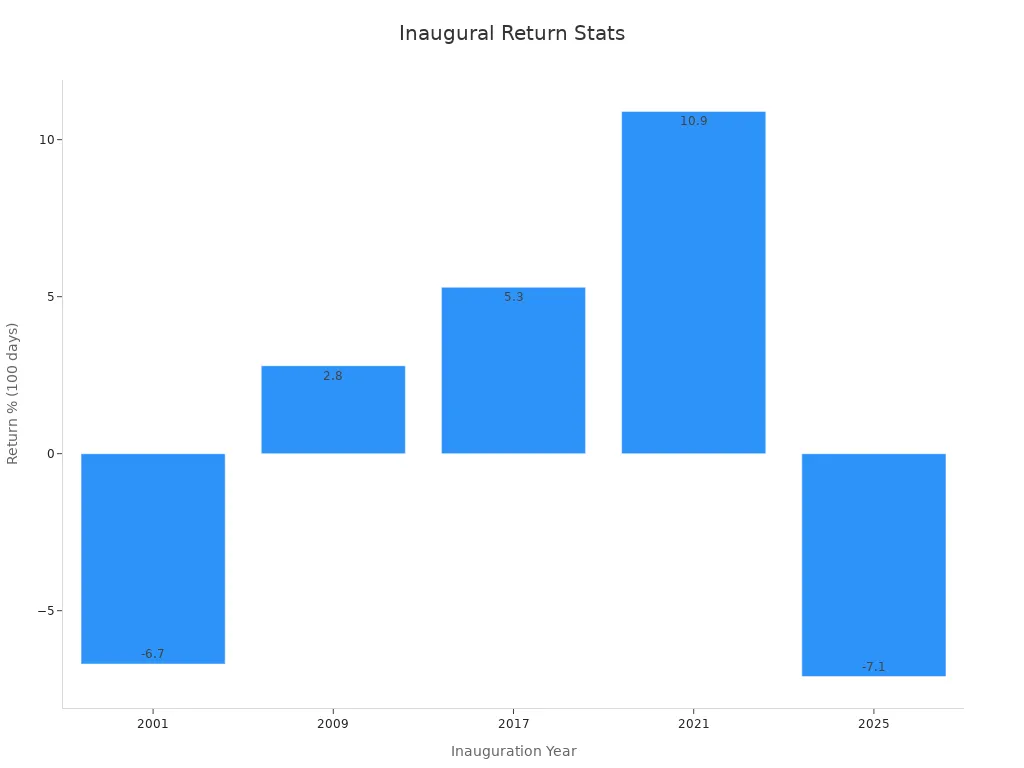
The table below summarizes the S&P 500 returns during the first 100 days after recent inaugurations, showing how performance can differ widely:
| Year of Inauguration | President | First 100 Days S&P 500 Return |
|---|---|---|
| 2025 | Trump (second term) | -7.1% |
| 2021 | Biden | 10.9% |
| 2017 | Trump (first term) | 5.3% |
| 2009 | Obama | 2.8% |
| 2001 | G.W. Bush | -6.7% |
Short-Term Trends
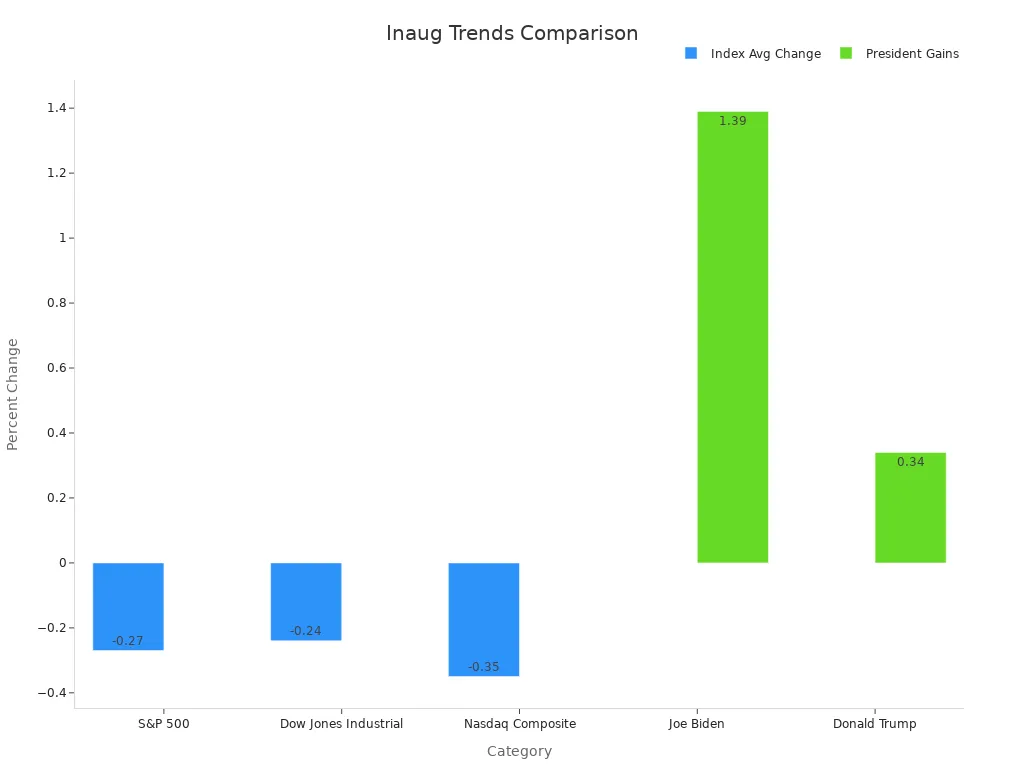
Short-term trends in the U.S. stock market around Inauguration Day reveal more about market sentiment than about the new president’s impact. On average, the S&P 500 changes by -0.27% on Inauguration Day, with a median change of -0.04%. The Dow Jones Industrial Average and Nasdaq Composite show similar patterns, with no consistent trend of decline or gain. For example, Joe Biden’s inauguration in 2021 saw the S&P 500 rise by 1.39%, while Donald Trump’s first inauguration in 2017 brought a 0.34% increase. These numbers show that short-term performance can be positive or negative, depending on the broader economic context.
| Index | Average Change on Inauguration Day | Median Change on Inauguration Day | General Non-Inauguration Day Pattern |
|---|---|---|---|
| S&P 500 | -0.27% | -0.04% | No consistent pattern of decline |
| Dow Jones Industrial | -0.24% | -0.11% | No consistent pattern of decline |
| Nasdaq Composite | -0.35% | +0.15% | No consistent pattern of decline |
Looking at extended market data, the S&P 500 tends to underperform in the month after Inauguration Day compared to regular trading sessions. Over one month, the S&P 500 usually loses 0.07%, with less than half of the returns being positive. In non-inauguration years, the index gains 0.90% with nearly 60% positive returns. Volatility also drops after Inauguration Day. When the presidential party changes, the S&P 500 averages a 0.77% loss in the first month, while it gains 0.71% if the incumbent party stays in power. Democrat inaugurations tend to bring better performance, with a 2.54% average gain over three months and 67% positive returns, compared to slight losses after Republican inaugurations.
- The S&P 500 performance after Inauguration Day often lags behind its ytd performance in non-inauguration years.
- When a new party takes office, the index usually posts a negative percentage gain in the first month.
- The worst ytd performance historically occurs after a non-incumbent Republican inauguration.
These historical trends show that while Inauguration Day can bring market moves, the U.S. stock market’s long-term direction depends more on economic factors and policy changes than on the event itself. Investors should focus on broader market trends and ytd performance rather than reacting to a single day’s returns.
Stock Market Performance by Administration
Democrat vs. Republican
Many investors want to know if the stock market performs better under Democratic or Republican presidents. Studies show that economic indicators often improve more during Democratic administrations.
- GDP growth, job creation, and real wages usually rise faster when Democrats lead the White House.
- Unemployment, inflation, and interest rates tend to stay lower during Democratic terms.
- Real business investment grows at more than double the pace under Democrats.
- Personal income, excluding government transfers, increases nearly twice as fast during Democratic presidencies.
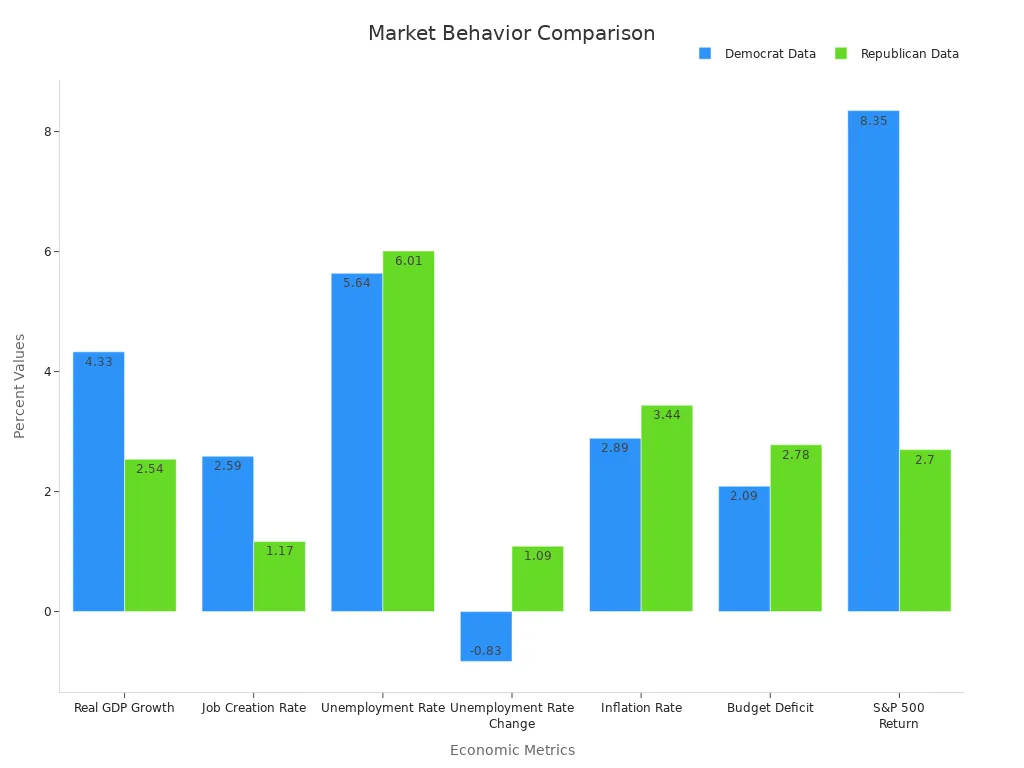
A table below highlights key differences in economic and market metrics:
| Metric | Democratic Presidents | Republican Presidents | Difference (Percentage Points) |
|---|---|---|---|
| Real GDP Growth | 4.33% | 2.54% | +1.79 |
| Job Creation Rate | 2.59% | 1.17% | +1.42 |
| S&P 500 Annual Return | 8.35% | 2.70% | +5.65 |
| Corporate Earnings Growth | 12.8% | 1.8% | +11.0 |
Note: These results come from studies using data from the Bureau of Economic Analysis and the Bureau of Labor Statistics.
However, the S&P 500’s median compound annual growth rate since 1957 is 9.3% under Democrats and 10.2% under Republicans. Median annual returns show 12.9% for Democrats and 9.9% for Republicans. These mixed results suggest that while economic growth and job creation often favor Democrats, stock market performance does not always follow the same pattern.
Incumbent vs. New President
The stock market reacts differently when an incumbent stays in office versus when a new president takes over.
- The S&P 500’s performance in the three months before an election predicts the incumbent party’s success about 87% of the time.
- Positive returns before an election often signal an incumbent win, while negative returns suggest a likely loss.
- When incumbents lose, the market usually sees short-term volatility and declines.
- Markets tend to rebound within the year after these declines.
A study of U.S. stock market performance from 1948 to 2008 found a cycle: returns are often negative in the first two years of a presidential term, then rise sharply in the third year, and stay positive in the fourth. This pattern may reflect efforts by incumbents to boost the economy before elections.
Investors should remember that long-term market performance depends more on economic fundamentals than on which party or president holds office. Short-term volatility often fades as political uncertainty settles.
Historical Annual Returns After Inauguration
First 100 Days
The first 100 days after Inauguration Day often set the tone for the new administration’s relationship with the stock market. Investors look at this period to gauge how new policies and leadership changes might influence returns. Historical performance shows that the S&P 500 can swing widely during these early months. For example, after the 2025 inauguration, the S&P 500 dropped by 7.1% in the first 100 days. In contrast, the index gained 10.9% during President Biden’s first 100 days in 2021. These numbers highlight how market sentiment and policy expectations drive early returns.
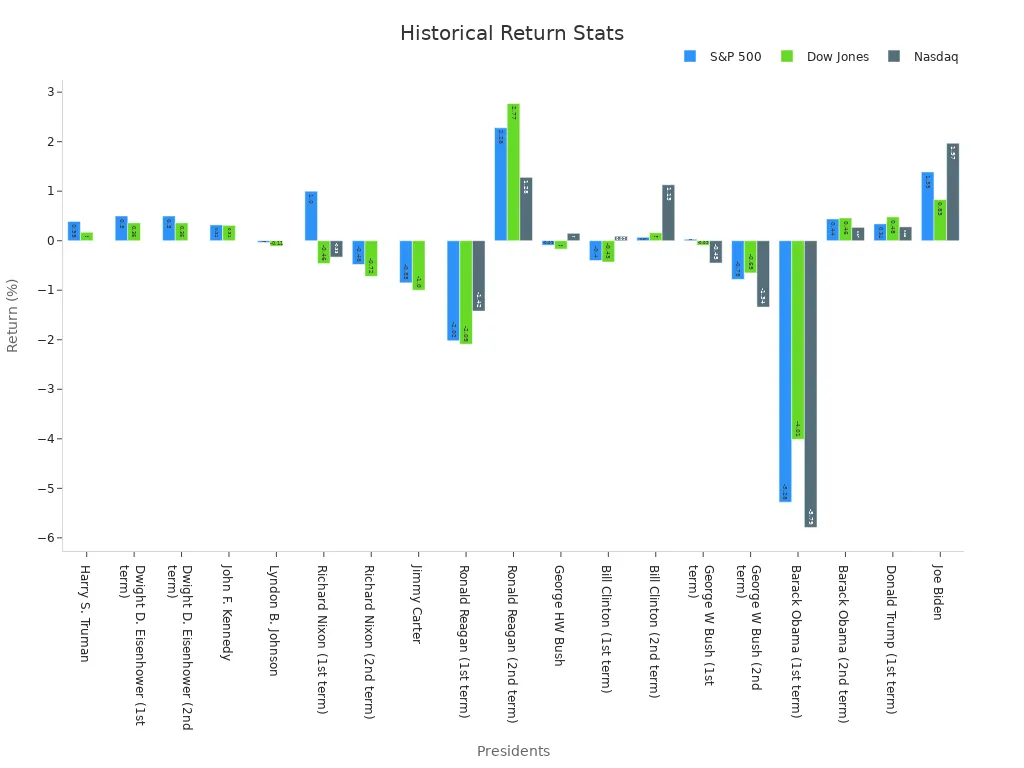
A closer look at historical annual returns reveals that the first month after inauguration day often brings more volatility than the rest of the year. Investors sometimes react quickly to new executive orders or policy announcements. The table below summarizes the average and median changes for major indices during this period:
| President | S&P 500 Change (%) | Nasdaq Change (%) | Dow Jones Change (%) |
|---|---|---|---|
| Joe Biden | 1.39 | 1.97 | 0.83 |
| Donald Trump (1st term) | 0.34 | 0.28 | 0.48 |
| Barack Obama (2nd term) | 0.44 | 0.27 | 0.46 |
| Barack Obama (1st term) | -5.28 | -5.79 | -4.01 |
| George W Bush (2nd term) | -0.78 | -1.34 | -0.65 |
| George W Bush (1st term) | 0.03 | -0.45 | -0.09 |
Investors should remember that historical performance in the first 100 days does not always predict the rest of the year.
Yearly Trends
Yearly trends after Inauguration Day show that the market’s response depends on both policy direction and global events. Historical data points to mixed results, with some years posting strong gains and others experiencing losses. For example, the S&P 500’s average change across all inaugurations stands at -0.27%, while the median change is -0.04%. The Dow Jones and Nasdaq indices show similar patterns, with no clear trend of consistent gains or losses.
Several factors can influence these yearly returns:
- The stock market started Donald Trump’s second term with strong momentum, but aggressive trade policies and tariffs led to increased volatility.
- Investors shifted from stocks to bonds, causing bond yields to drop.
- When the administration paused tariff increases in April 2025, the market rallied, and the S&P 500 turned positive by mid-May.
These examples show that historical annual returns reflect a combination of policy changes, investor sentiment, and broader economic conditions. Reviewing historical performance helps investors set realistic expectations for future returns.
What Drives Stock Market Performance
Policy and Sentiment
Policy changes often set the tone for the u.s. stock market. Investors pay close attention to new executive orders, tax reforms, and regulatory shifts. When a president announces plans for fiscal spending or changes in tariffs, the market responds quickly. For example, after recent elections, tariff policies and fiscal spending concerns shaped how stocks and Treasury yields moved. Investors also react to the tone of speeches and press conferences. Positive language about growth can boost confidence, while uncertainty or threats of trade wars can trigger caution. Market sentiment, shaped by news and expectations, often drives short-term moves. When leaders signal stability, investors feel more secure. If leaders hint at major changes, market volatility can increase.
Note: Market sentiment can shift rapidly based on headlines, even before any real policy takes effect.
Economic Factors
The economy plays a central role in shaping stock market performance. Strong job growth, rising wages, and healthy consumer spending usually support higher stock prices. When the economy slows, companies may earn less, and stocks can fall. Historical data shows that after Inauguration Day, equity markets often rally if the economic outlook improves. Since the 2024 election, the S&P 500 rose by 4.7%, outpacing the post-World War II average of 1.7%. This pattern highlights how economic factors like tariffs, fiscal policy, and regulatory changes drive market outcomes. Sector trends also matter. For example, technology stocks may rise during periods of deregulation, while industrials can struggle if tariffs increase. Lower market volatility often appears in the first year of a new presidential term, especially when economic policy remains steady. The interplay between economic growth, policy direction, and sector performance creates a dynamic environment for investors.
Investor Tips for 2025
What to Watch
Investors in 2025 should focus on market fundamentals and avoid reacting to short-term headlines. Historical data shows that holding investments through political volatility often outperforms attempts to time the market. Investors should monitor key policy signals, such as executive orders, fiscal spending plans, and regulatory changes. These signals can shift market sentiment quickly.
Key sectors and trends to watch include:
- Technology and artificial intelligence infrastructure. The new administration has pledged $500 billion to support US AI infrastructure, which will likely boost demand for data centers and related technology.
- The “Magnificent 7” tech companies—Microsoft, Apple, Nvidia, Alphabet, Amazon, Meta, and Tesla—remain important drivers in technology, communications, and consumer discretionary sectors.
- Small-cap stocks and international equities, especially in Japan and Europe, have shown strong gains during the inauguration period.
- Energy markets favor traditional fossil fuels, with oil prices declining due to increased supply expectations.
- Gold futures have surged, reflecting demand for safe-haven assets during periods of uncertainty.
Investors should also track Treasury yields, which often spike ahead of inaugurations, and monitor merger and acquisition sentiment as regulatory changes unfold.
Strategies for Inauguration Week
Investors can use several strategies to manage risk and seek opportunity during Inauguration Week:
- Maintain diversified portfolios. Adding international equities and non-traditional assets, such as market neutral or tactical strategies, can reduce exposure to US-specific risks.
- Consider active management to adjust exposures during periods of uncertainty and lower liquidity. This approach helps navigate volatility spikes and changing interest rates.
- Reallocate from mega-cap to large-cap stocks, as forecasts suggest stronger economic growth and stable interest rates.
- Use tax-loss harvesting during market pullbacks to optimize after-tax returns.
- Monitor company communications for transparency about liquidity and regulatory impacts. Companies that address these issues directly tend to maintain investor trust.
| Investor Sentiment on 2025 M&A Activity | Summary of Views |
|---|---|
| Positive Impact of Election Results | Improved tax policies, increased deal activity, higher quality businesses entering market, bullish initial sentiment, reduced regulations, and support for US manufacturing jobs. |
| Negative or Cautionary Views | Potential inflation from stimulus, higher interest rates possibly reducing sales multiples, economic softness in some sectors, and uncertainty about long-term effects of broad economic policies. |
Staying focused on fundamentals and monitoring sector trends can help investors navigate the unique challenges and opportunities of Inauguration Week in 2025.
Inauguration Day rarely changes the long-term direction of the stock market. Market studies show that value stocks and small caps often gain strength after political events. They also highlight the benefits of adaptive, long-term strategies:
- Value stocks and small caps outperformed after recent inaugurations.
- Technical patterns support a bullish long-term outlook.
- Dynamic allocation models help investors adjust to changing conditions.
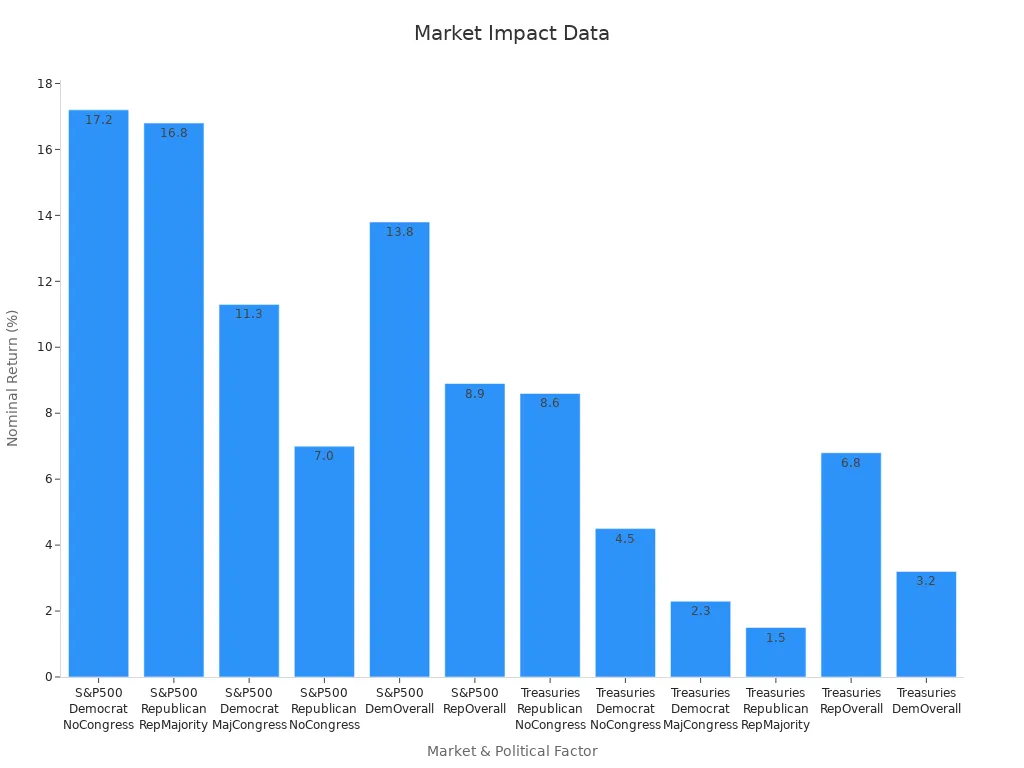
| Market Segment | Presidential Party | Congressional Majority | Nominal Return (%) | Real Return (%) |
|---|---|---|---|---|
| US Equities (S&P 500) | Democratic | No majority | 17.2 | N/A |
| US Equities (S&P 500) | Republican | Republican majority | 16.8 | 14.6 |
| US Equities (S&P 500) | Democratic | Majority | 11.3 | 12.9 |
| US Equities (S&P 500) | Republican | No majority | 7.0 | N/A |
| US Equities (S&P 500) | Democratic (overall) | N/A | 13.8 | 9.7 |
| US Equities (S&P 500) | Republican (overall) | N/A | 8.9 | 5.1 |
Investors in 2025 should focus on fundamentals, not headlines. A disciplined, informed approach helps build wealth through all political cycles.
FAQ
What usually happens to the stock market on Inauguration Day?
The stock market often shows mixed results on Inauguration Day. Sometimes the S&P 500 performance is positive, while other times it drops. Market trends depend on investor sentiment, policy expectations, and the overall economy.
Is the stock market open on Inauguration Day?
The U.S. stock market usually remains open on Inauguration Day. If the date falls on a federal holiday, such as Martin Luther King Jr. Day, the market closes. Investors should check the calendar each year to confirm.
How does the first month after Inauguration Day affect returns?
The first month after Inauguration Day often brings higher market volatility. Historical performance shows that the S&P 500 and other indices can experience both gains and losses. Returns depend on new policies, economic signals, and investor confidence.
Do Democrat or Republican presidents impact stock market performance more?
Historical annual returns show mixed results. Some studies find higher S&P 500 performance under Democrats, while others see strong returns with Republicans. The economy, policy direction, and global events play bigger roles than party alone.
What should investors watch for after Inauguration Day?
Investors should monitor market trends, policy changes, and economic data. Watching S&P 500 performance, sector shifts, and ytd performance helps guide decisions. Staying focused on fundamentals, not headlines, supports better long-term returns.
In 2025, the S&P 500’s volatility, with a 17% drop post-Inauguration Day, highlights the challenges of market uncertainty for new investors.BiyaPay simplifies investing with a user-friendly platform for trading U.S. stocks, including S&P 500 constituents, HKEX stocks, and cryptocurrencies, all in one account. Enjoy low remittance fees starting at 0.5% and real-time USDT-to-USD/HKD conversions to minimize costs.
BiyaPay is registered with U.S. and Canadian financial regulators and compliant as a U.S. registered investment advisor, ensuring your funds are secure. Open an account in minutes to diversify and seize opportunities in tech and value stocks. Start with BiyaPay now to navigate 2025’s markets! Sign up today to build your portfolio confidently!
*This article is provided for general information purposes and does not constitute legal, tax or other professional advice from BiyaPay or its subsidiaries and its affiliates, and it is not intended as a substitute for obtaining advice from a financial advisor or any other professional.
We make no representations, warranties or warranties, express or implied, as to the accuracy, completeness or timeliness of the contents of this publication.


Contact Us
Company and Team
BiyaPay Products
Customer Services


is a broker-dealer registered with the U.S. Securities and Exchange Commission (SEC) (No.: 802-127417), member of the Financial Industry Regulatory Authority (FINRA) (CRD: 325027), member of the Securities Investor Protection Corporation (SIPC), and regulated by FINRA and SEC.
registered with the US Financial Crimes Enforcement Network (FinCEN), as a Money Services Business (MSB), registration number: 31000218637349, and regulated by FinCEN.
registered as Financial Service Provider (FSP number: FSP1007221) in New Zealand, and is a member of the Financial Dispute Resolution Scheme, a New Zealand independent dispute resolution service provider.