- EasyCard
- Trade
- Help
- Announcement
- Academy
- SWIFT Code
- Iban Number
- Referral
- Customer Service
- Blog
- Creator
Stocks Plunge After Fed Comments and Global Events Shake Confidence

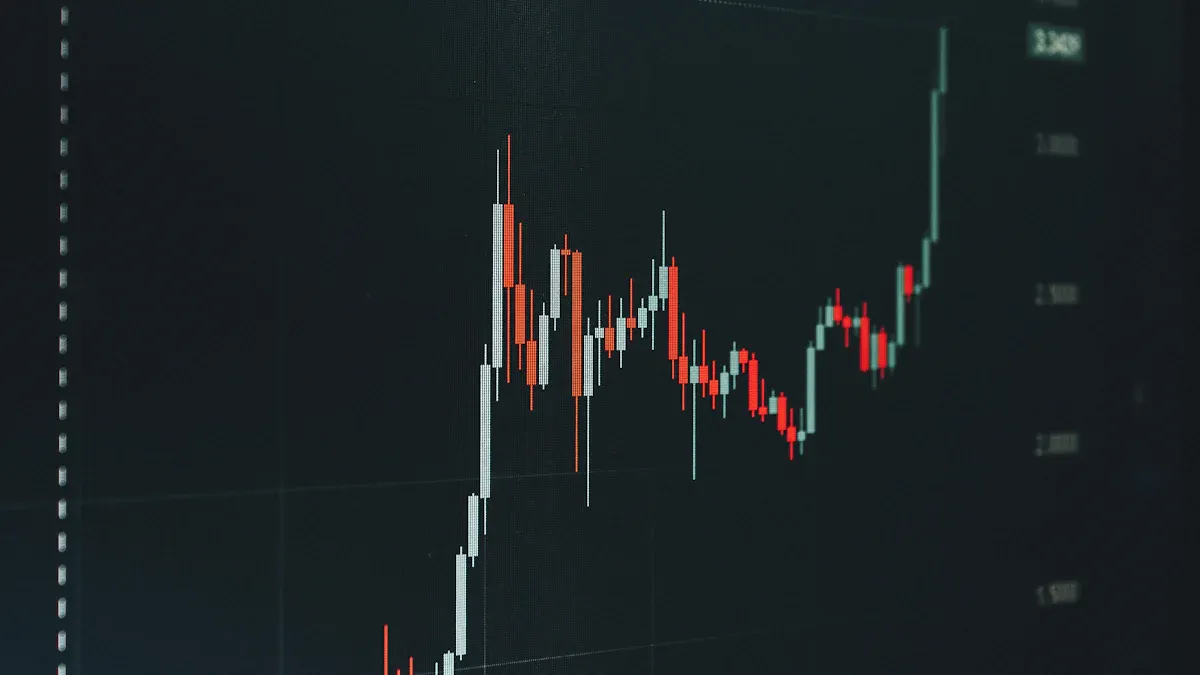
Image Source: unsplash
Stocks falling today reflect a sharp response to recent Fed comments and increasing Israel-Iran tensions. U.S. equity markets saw major declines, with the Dow Jones dropping 37.1%, causing a US$10 trillion decrease in total market value.
| Stock Market Index | Decline Percentage | Monetary Impact | Additional Context |
|---|---|---|---|
| Dow Jones | 37.1% | US$ 10 trillion drop | Over 45.0% of US GDP in 2019 |
| Nasdaq | 30.1% | N/A | Significant plunge during COVID-19 pandemic |
| S&P 500 | 31.9% | N/A | Significant plunge during COVID-19 pandemic |
| G7 (ex. Japan) | 12.0%-19.0% | N/A | Hit 20-year lows in March 2020 |
Investor sentiment drives market volatility, as studies show a strong link between emotions and short-term trading. Many investors follow the latest market updates and news closely, feeling uncertain about how ongoing events will impact their trading decisions.
Key Takeaways
- Stocks fell sharply due to cautious Federal Reserve comments and rising tensions between Israel and Iran, causing major market losses.
- Federal Reserve Chair Jerome Powell’s tone strongly affects investor confidence and market volatility, making his statements key to watch.
- Global events like the Israel-Iran conflict raise uncertainty, push oil prices higher, and increase market swings.
- Finance, insurance, and technology sectors face the biggest drops during market stress, influencing overall market health.
- Investors should track Fed updates, global news, and market sentiment to make informed decisions during volatile times.
Stocks Falling Today

Image Source: unsplash
Market Overview
Stocks falling today reflect a broad shift in investor sentiment. U.S. equity markets experienced significant declines as traders responded to a mix of central bank signals and global tensions. The S&P 500 recently tested a critical support level at 5,675 after dropping nearly 8% over the past three weeks. This move signals strong selling pressure and a change in market momentum. Most sectors finished flat or lower, with energy as the only exception due to rising oil prices.
- The US composite Purchasing Managers’ Index (PMI) fell to 51.2 in April, marking a 16-month low. This reading points to slowing business activity.
- Price indices reached 13-month highs, showing persistent inflation.
- Consumer sentiment remains weak, according to the University of Michigan survey. Labor market expectations have also worsened.
- Tesla reported a 71% drop in Q1 profit, highlighting sector-specific weakness.
- Intel shares declined 7% after issuing disappointing guidance.
- Despite some rebounds in technology, these figures show ongoing downward pressure on stocks.
Market volatility increased as investors moved toward safe-haven assets. Many traders closely followed stock market news and updates, seeking clarity amid uncertainty. The risk-off mood dominated trading floors, with global events and central bank policy driving decisions.
Major Indexes
The major indexes posted notable losses during the latest session. The table below summarizes the recent changes:
| Market Index | Approximate Decline | Percentage Change |
|---|---|---|
| S&P 500 | Around 50 points | About -0.8% |
| Dow Jones Industrial Average | Around 299 points | About -0.7% |
| Nasdaq Composite | Around 180 points | About -0.9% |
For April 2025, the Dow Jones dropped 3.2%, while the S&P 500 fell 0.8%. Year-to-date, the S&P 500 is down 5.3%, and the Dow Jones has lost 4.4%. The Nasdaq Composite showed a slight monthly gain of 0.9% but remains down 10% for the year.
Investors face a challenging environment as stocks falling today reflect both technical and fundamental pressures. Market performance continues to react to every new development, with trading volumes rising during periods of uncertainty.
Stock market news continues to influence trading decisions. U.S. equity markets remain sensitive to both domestic and international headlines. Market performance will likely stay volatile as traders watch for further signals from policymakers and global leaders.
Fed Impact
Powell’s Comments
Jerome Powell’s recent statements have played a major role in shaping the current market environment. During his latest press conference, Powell signaled that the Federal Reserve would wait before taking further action on interest rates. This cautious approach sent a clear message to investors. Many interpreted his tone as somber and uncertain, which increased anxiety across the market.
Researchers have found that Powell’s vocal tone during press conferences can directly influence investor sentiment and market risk. For example:
- A study by Anastasiou et al. (2025) used deep learning to analyze Powell’s emotional tone. The study found that a positive tone from Powell reduced the risk of sharp declines in bank stocks. In contrast, sadness or anger in his voice increased the risk of a market crash.
- Specific events highlight this effect. In March 2020, Powell’s somber tone coincided with a dramatic drop in major bank shares. JPMorgan Chase fell about 16%, Bank of America dropped 6.5%, and the KBW Bank Index lost 16.2% in one session.
- In April 2025, Powell’s cautious remarks during a period of trade tensions led to significant declines in U.S. bank stocks. The effect was especially strong for large banks regulated by the Fed.
Market reactions to Powell’s comments have become more pronounced compared to previous Fed chairs. Volatility during his press conferences is about three times higher than before. Sometimes, his language even reverses the initial reaction to the Fed’s official statement. For instance, a positive tone in September 2022 sparked a rally, while a negative tone in November 2022 led to a nearly 2% drop in equity markets. These patterns show that Powell’s words and delivery style act as powerful signals for investors.
Technical indicators also reflect the impact of Powell’s statements. After his warnings about tariffs and inflation, the market reversed some earlier gains. The 20-day moving average acted as resistance, and rising credit spreads signaled growing caution. Bond yields and volatility also shifted as investors responded to Powell’s outlook.
Rate Policy
The Federal Reserve’s current rate policy continues to weigh on the market. Inflation remains above the Fed’s 2% target, with the Consumer Price Index showing a 2.8% increase over the past year. The Fed has kept interest rates in the 4.25% to 4.50% range, and no rate cuts are expected before September 2025. High rates make borrowing more expensive, which slows economic growth and reduces optimism among investors.
Survey data from the Federal Reserve Bank of New York shows that inflation expectations have started to decline. Labor market expectations have also improved. However, persistent inflation and the Fed’s steady rate stance keep the market cautious. Investors worry about the risk of stagflation, where inflation stays high while economic growth slows. In the first quarter of 2025, the U.S. economy shrank at an annualized rate of -0.2%. This negative growth, combined with elevated inflation, unsettles the market and increases volatility.
Tariff uncertainty adds another layer of risk. Customs revenue data shows a sharp rise in tariff collections, reaching $16 billion in April compared to $6.3 billion a year ago. Companies like Walmart have reported higher costs due to tariffs and have withheld future earnings guidance because of economic uncertainty. These developments support Powell’s concerns that tariffs could push inflation higher and slow growth, further affecting investor behavior.
The combination of persistent inflation, high interest rates, and policy uncertainty has led to increased caution in u.s. equity markets. Investors continue to monitor Fed news and trading signals closely. Many seek safe-haven assets as they navigate a challenging environment shaped by central bank decisions and global events.
Stock Market News: Global Events

Image Source: pexels
Israel-Iran Tensions
The Israel-Iran conflict has created significant uncertainty in the global market. Investors have responded quickly to each new development, leading to sharp movements in equity prices and increased volatility. On June 13, 2025, when Israel launched an attack on Iran, the market reaction matched predictions for short-term geopolitical shocks. Equity markets dropped by about 1%, the volatility index spiked by 1.5%, and corporate bond spreads widened by 3%. Crude oil prices jumped 10% in a single session.
- Small-cap stocks showed greater sensitivity to the conflict, falling more than large-cap stocks.
- Bond markets also experienced negative impacts, especially in securitized and corporate bonds, as risk perception increased.
- These stress tests confirm that escalating Israel-Iran tensions can quickly erode market confidence and affect investment portfolios.
A review of 36 major geopolitical events since 1940 shows that equity markets usually underperform in the three months following such events. Average real S&P 500 returns drop from 1.3% to 0.3% post-event. However, the impact tends to fade over six to twelve months, with returns returning to normal levels.
Oil Prices and Geopolitics
Geopolitical risks in the Middle East have pushed oil prices higher. The Strait of Hormuz remains a critical chokepoint, with about 20.9 million barrels of oil passing through daily in 2023. This volume represents roughly 20% of global oil consumption. When tensions rose between Israel and Iran, Brent crude oil prices surged from the mid-$60s to the mid-$70s per barrel. Vessel waiting times at Iran’s Kharg Island port increased from five days in early May to eleven days by late May 2025, showing operational disruptions.
Advanced models show that realized geopolitical acts, such as wars or attacks, have a strong and positive effect on oil prices. Oil price fluctuations remain persistent in the short term, partly due to speculative trading. The International Energy Agency tracks over 2.7 billion barrels in OECD stocks and 1.2 billion barrels in public emergency stocks, highlighting efforts to prepare for supply shocks. If the Strait of Hormuz closes, analysts estimate Brent crude could rise above USD 100 per barrel, causing severe disruption in the market.
Stock market news often highlights how global uncertainty can outweigh positive economic data. Investors watch geopolitical developments closely, as these events can drive both short-term trading and long-term market trends.
Sectors and Stocks Drop
Affected Sectors
The recent stocks drop has affected several sectors across the market. Finance and insurance companies have seen the largest negative spillover effects. During times of crisis, these sectors often amplify risks for the entire market. Before the last major recession, sector-specific shocks drove more than half of the market’s fluctuations. When a recession hits, common shocks dominate, causing even more volatility.
The table below shows how different sectors respond during periods of stress:
| Sector/Aspect | Summary |
|---|---|
| Finance and Insurance | Largest negative spillover effects during crisis periods. |
| Aggregate Fluctuations Pre-Recession | Sector-specific shocks drive over half of market variability. |
| Aggregate Fluctuations During Recession | Common shocks account for three-quarters of market volatility. |
| Sector Correlations | Increased from 0.26 to 0.45 after 2007, showing stronger links between sectors. |
| Aggregate Growth Rate | Dropped from 3.4% per year to 0.2% during crisis, with volatility doubling. |
Large sectors with strong connections to other industries can spread risk quickly. When the finance sector faces trouble, it often leads to wider market declines. Investors watch these sectors closely during periods of uncertainty.
Notable Stocks
Several individual stocks have drawn attention during this period of market stress. KLA and Cisco remain in focus because they play key roles in technology and communications. Investors often look to these companies for signals about the health of the tech sector. Astera Labs and Viking Holdings have also attracted interest. Both companies launched their IPOs in 2024 and have shown strong gains since then. Astera Labs rose by 27.49% and Viking Holdings by 77.45% since their IPOs.
Even though Astera Labs and Viking Holdings have performed well since going public, recent global events and market volatility have put pressure on many stocks. Investors continue to monitor these names as trading volumes rise and uncertainty grows.
Geopolitical tensions and central bank policy changes drive much of the current market movement. When global risks increase, investors often shift their trading strategies, leading to sharp moves in both sectors and individual stocks.
Historical Context
Past Drops
History shows that sharp declines in the market often follow major global events or policy changes. Recent drops echo patterns seen during the 2020 COVID-19 crash and the 2008 financial crisis.
- In March 2020, the Dow Jones lost nearly 13% in one day, the largest drop since 1987. The S&P 500 and Nasdaq also fell about 12%.
- The 2008 crisis saw the Dow Jones fall 18% in a single week, with the S&P 500 dropping over 20%.
- The 2025 market crash began with a 3.2% drop in the Dow after new tariffs, the biggest decline since the pandemic crash.
- Since 1950, the average market drop during a recession has been about 21%, with the S&P 500 usually bottoming after about 169 days.
- Recovery times vary. The 2020 crash saw a quick rebound, while the 2008 crisis took much longer.
Geopolitical risks have always increased market volatility. When tensions rise, investors often move money into gold or other safe assets. Recent events show that geopolitical shocks now have a stronger effect on currency swings and market behavior than in the past.
Market history suggests that while sharp drops can be sudden, recoveries often follow—though the timeline depends on the cause and the response from policymakers.
Investor Sentiment
Investor mood plays a key role in how the market reacts to shocks. In the past, experts measured sentiment using surveys like the American Association of Individual Investors (AAII) and Investor Intelligence. These surveys captured how investors felt, but did not always match real trading activity.
Today, analysts use more data-driven tools. They track mutual fund flows, put-call ratios, and even daily trading patterns to gauge sentiment. Composite indices, such as the Baker-Wurgler index, combine several indicators for a broader view.
- Newer methods use daily data to measure sentiment for individual stocks, giving a more detailed picture.
- Research shows that collective mood, shaped by news and social media, can drive both trading and market swings.
This shift from broad surveys to real-time data helps explain why market reactions can be faster and more intense today. Investors now respond quickly to headlines, making the market more sensitive to both good and bad news.
Recent market declines stem from the Federal Reserve’s cautious approach and rising global tensions. Investors should monitor key indicators to anticipate future moves:
- Sentiment analysis and technical patterns
- Economic data, regulatory changes, and global events
- Machine learning and predictive analytics
To predict trends, analysts also review historical data, identify cycles, and use forecasting models. Staying informed and reviewing investment strategies can help investors manage risk during ongoing volatility.
FAQ
What caused the recent stock market drop?
The market dropped because of cautious comments from the Federal Reserve and rising tensions between Israel and Iran. Investors reacted quickly to these events, leading to sharp declines in major indexes.
How do Fed interest rate decisions affect stocks?
The Federal Reserve sets interest rates to control inflation. Higher rates make borrowing more expensive. Companies may slow growth, and investors often move money out of stocks when rates stay high.
Why do global events like the Israel-Iran conflict impact markets?
Global conflicts create uncertainty. Investors worry about supply chains, oil prices, and safety. These concerns can lead to sudden changes in stock prices and higher market volatility.
Which sectors are most affected during market downturns?
Finance, insurance, and technology sectors often see the largest declines. These sectors connect to many industries. When they drop, the whole market can feel the impact.
What should investors watch for during volatile periods?
- Monitor Federal Reserve updates
- Track global news and geopolitical risks
- Review technical indicators and sentiment data
- Stay informed to make better investment decisions
Navigating today’s volatile markets requires agility and cost-effective tools to manage your investments. BiyaPay empowers investors like you with a multi-asset wallet that supports seamless, fee-free conversions between USDT and over 200 cryptocurrencies into fiat currencies like USD or HKD. This ensures you can swiftly move funds to capitalize on market opportunities or protect profits without costly exchange fees. With remittance fees as low as 0.5%, BiyaPay keeps your transaction costs minimal, even during turbulent times driven by Fed policies or global events. Its secure platform and one-minute registration process let you focus on strategy rather than logistics. Whether you’re diversifying into tech stocks or hedging against volatility, BiyaPay simplifies your financial operations. Take charge of your investments today—sign up with BiyaPay in just one minute and stay ahead in the global market.
*This article is provided for general information purposes and does not constitute legal, tax or other professional advice from BiyaPay or its subsidiaries and its affiliates, and it is not intended as a substitute for obtaining advice from a financial advisor or any other professional.
We make no representations, warranties or warranties, express or implied, as to the accuracy, completeness or timeliness of the contents of this publication.


Contact Us
Company and Team
BiyaPay Products
Customer Services
is a broker-dealer registered with the U.S. Securities and Exchange Commission (SEC) (No.: 802-127417), member of the Financial Industry Regulatory Authority (FINRA) (CRD: 325027), member of the Securities Investor Protection Corporation (SIPC), and regulated by FINRA and SEC.
registered with the US Financial Crimes Enforcement Network (FinCEN), as a Money Services Business (MSB), registration number: 31000218637349, and regulated by FinCEN.
registered as Financial Service Provider (FSP number: FSP1007221) in New Zealand, and is a member of the Financial Dispute Resolution Scheme, a New Zealand independent dispute resolution service provider.


