- EasyCard
- Trade
- Help
- Announcement
- Academy
- SWIFT Code
- Iban Number
- Referral
- Customer Service
- Blog
- Creator
Beginner’s Guide to Following the Hang Seng China Enterprises Index


Image Source: unsplash
You want to start tracking the hang seng enterprise index. First, pick a trusted platform or app that shows real-time stock market data. You can check the market every day and see how the hang seng index moves. Many investors and traders use these tools to watch the market and spot trends. When you follow the hang seng index, you learn how the market and the economy change. This helps you make better trading choices. You see how the hong kong economy and the stock market affect your investments. Watching the hang seng index also teaches you about the role of fundamental analysis and technical analysis in trading. You join other traders and investors who use the stock market to understand the economy. This habit builds your analysis skills and helps you become a better investor.
Key Takeaways
- The Hang Seng China Enterprises Index tracks major Chinese companies listed in Hong Kong and shows how the market and economy change.
- Use trusted websites and mobile apps to follow the index daily and spot market trends and new investment opportunities.
- Combine simple technical tools like moving averages and RSI with fundamental analysis of company earnings to make smarter trading decisions.
- Set alerts and create a daily routine to stay updated on market moves and important news affecting the index.
- Avoid common mistakes by keeping analysis simple, checking key data regularly, and using reliable sources for accurate information.
Hang Seng Enterprise Index Overview
Image Source: unsplash
What Is the Hang Seng Enterprise Index
You might wonder what the hang seng enterprise index is and why so many investors and traders talk about it. This index tracks the performance of major companies from China that list their stocks on the Hong Kong stock market. People call these H-shares. The hang seng enterprise index is part of the larger hang seng index family, which covers different parts of the hong kong economy.
The hang seng enterprise index includes 82 stocks from four main sectors: finance, utilities, properties, and commerce and industry. The index uses a free-float market capitalization method, which means it looks at the value of stocks that investors can actually trade. No single stock can have more than 8% of the index, so you get a balanced view of the market. You can find up-to-date lists of these stocks on trusted financial websites like Investopedia and MarketScreener. These sites show you the top holdings and sector weights, helping you spot market trends and trading opportunities.
Why It Matters
You need to know why the hang seng enterprise index matters for your investments and trading. This index gives you a clear picture of how the hong kong economy and the stock market perform, especially for companies from China. Many investors use the hang seng index as a benchmark to compare their own investments. When you follow the hang seng enterprise index, you see how market trends change and how the economy reacts to news.
Investors and traders pay close attention to the hang seng index because it covers about 60% of the hong kong stock market. Analyst upgrades and downgrades on these stocks often lead to big changes in prices. If you watch the hang seng enterprise index, you can spot new investment opportunities and avoid risks. The index also helps you practice fundamental analysis and technical analysis, which are key for making smart trading decisions. By tracking the hang seng index, you learn how market sentiment and the hong kong economy affect your investments. This knowledge gives you an edge over other traders and helps you grow as an investor.
Tip: Use the hang seng enterprise index as a starting point for your fundamental analysis. Check earnings reports, sector news, and analyst ratings to understand market trends and find the best opportunities.
Tracking Tools
Financial Websites
You want to track the hang seng index and learn about the stock market. Start with financial websites. These sites give you real-time data on the hang seng index. You can see how the market moves every minute. Many investors use these websites to check stocks and follow the economy. You get charts, news, and analysis tools. Some popular sites include Yahoo Finance, Bloomberg, and MarketWatch. These sites help you compare stocks and see how the hang seng index changes. You can read expert analysis and see what other traders think about the market. You also find reports about the economy and trading trends. These tools make it easy for investors and traders to stay updated.
Mobile Apps
You can use mobile apps to follow the hang seng index anywhere. Many investors and traders like apps because they give fast updates. You get alerts when the market changes. Some apps let you set watchlists for your favorite stocks. You can read news, check analysis, and see how the economy affects the stock market. Apps like Investing.com, Bloomberg, and Yahoo Finance work well for tracking the hang seng index. You can also use these apps to practice trading and learn more about the market. Many traders use mobile apps to check analysis and trading ideas during the day. You stay connected to the economy and the stock market at all times.
Watchlists
Watchlists help you track the hang seng index and other stocks. You can make a list of stocks you want to follow. Many investors and traders use watchlists to spot market trends. You add stocks from the hang seng index and see how they move with the economy. Watchlists show you price changes, news, and analysis for each stock. You can use watchlists on financial websites or mobile apps. This tool helps you focus on the market and improve your trading skills. Investors use watchlists to keep an eye on the stock market and learn how the economy affects their choices. You get better at analysis and trading by using watchlists every day.
Key Performance Metrics
Index Value
You want to know how the hang seng index shows its performance. The index value tells you how the stock market in Hong Kong and China changes every day. When you look at the index value, you see if the market goes up or down. Many investors check this number to spot market trends and make trading decisions. The hang seng index started with a base value of 100 points in 1964. It reached big milestones, like 10,000 points in 1993 and 30,000 points in 2007. The index value can change fast when the economy faces big news or events. You can use the index value to compare your trading performance with the whole market.
Components and Sectors
The hang seng index includes many stocks from different sectors. You see companies from finance, utilities, properties, and industry. Each company affects the index in its own way. When you track these sectors, you learn how the economy and stock market work together. Some companies, like banks and tech firms, have a big impact on the index’s performance. Investors watch these companies to understand market trends and company performance. Changes in the list of stocks, called reconstitution, can move the market. You need to follow both the sectors and the individual companies. This helps you see how company performance and market trends shape the stock market and your trading.
Note: Company performance, ownership, and even management style can change how a stock moves in the hang seng index. You get a better view of the market by tracking these details.
Historical Performance
You can learn a lot by looking at the hang seng index’s historical performance. The index has seen big ups and downs. For example, it dropped almost 50% in 2008 during the global financial crisis. It bounced back with a 52% gain in 2009. The table below shows how the index value changed over the years:
| Year | Closing Value (approx.) | Change (approx.) | % Change (approx.) |
|---|---|---|---|
| 1994 | 8,191 | -3,697 | -31.1% |
| 1995 | 10,073 | 1,882 | 23.0% |
| 1996 | 13,451 | 3,378 | 33.5% |
| 1997 | 10,723 | -2,729 | -20.3% |
| 1998 | 10,049 | -674 | -6.3% |
| 1999 | 16,962 | 6,914 | 68.8% |
| 2000 | 15,096 | -1,867 | -11.0% |
| 2001 | 11,397 | -3,698 | -24.5% |
| 2002 | 9,321 | -2,076 | -18.2% |
| 2003 | 12,576 | 3,255 | 34.9% |
| 2004 | 14,230 | 1,654 | 13.2% |
| 2005 | 14,876 | 646 | 4.5% |
| 2006 | 19,965 | 5,088 | 34.2% |
| 2007 | 27,813 | 7,848 | 39.3% |
| 2008 | 14,387 | -13,425 | -48.3% |
| 2009 | 21,873 | 7,485 | 52.0% |
| 2010 | 23,035 | 1,163 | 5.3% |
| 2011 | 18,434 | -4,601 | -20.0% |
| 2012 | 22,657 | 4,223 | 22.9% |
| 2013 | 23,306 | 649 | 2.9% |
| 2014 | 23,605 | 299 | 1.3% |
| 2015 | 21,914 | -1,691 | -7.2% |
| 2016 | 22,001 | 86 | 0.4% |
| 2017 | 29,919 | 7,919 | 36.0% |
| 2018 | 25,846 | -4,073 | -13.6% |
| 2019 | 28,190 | 2,344 | 9.1% |
| 2020 | 27,231 | -959 | -3.4% |
| 2021 | 23,398 | -3,833 | -14.1% |
| 2022 | 19,781 | -3,616 | -15.5% |
| 2023 | 17,047 | -2,734 | -13.8% |
| 2024 | 20,060 | 3,013 | 17.7% |
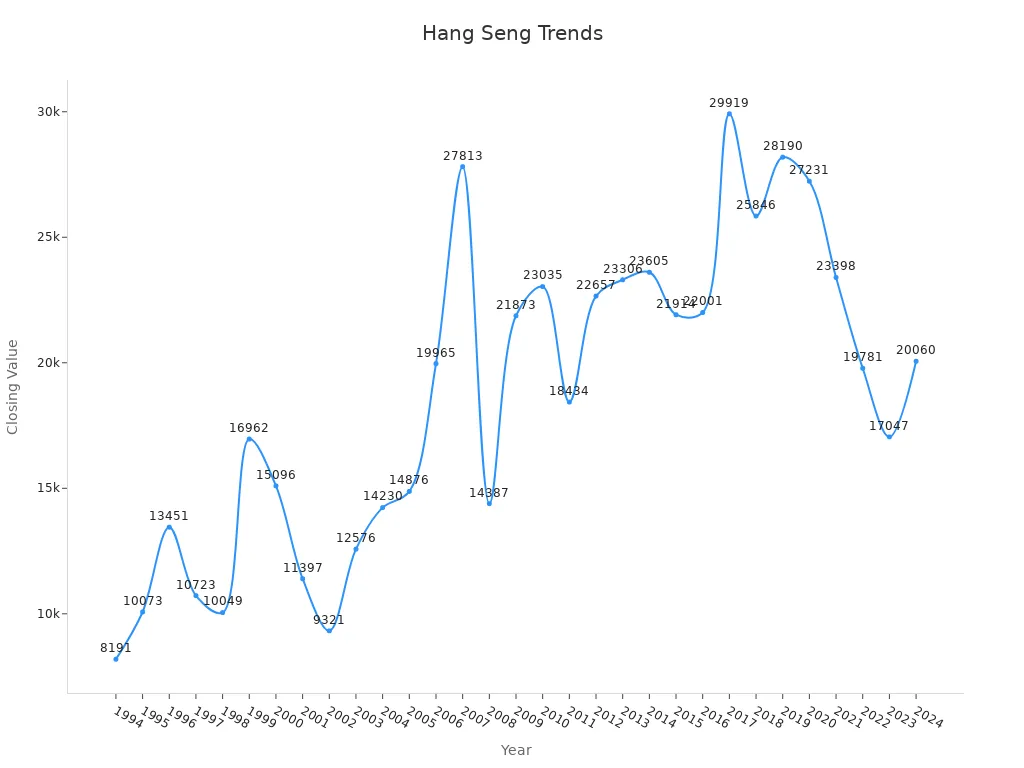
You see that the hang seng index reacts to big events in the economy and stock market. The index often moves with global market trends and news. Investors use this history to guess future performance and improve their trading. When you study these changes, you spot patterns in company performance and market trends. This helps you make better trading choices and understand how the economy shapes the stock market.
Analysis Basics
Technical Analysis Tools
You want to spot trends and make smart trading strategies in the stock market. Technical analysis gives you tools to do this. You look at charts and numbers to see how the hang seng index moves. Many traders use technical indicators like moving averages, MACD, RSI, and stochastics. These tools help you see if the market is strong or weak.
Moving averages smooth out price changes. You can use different periods, like 5, 20, 50, 100, or 200 days. When a short-term moving average crosses above a long-term one, you might see a bullish trend. If it crosses below, you might see a bearish trend. MACD (Moving Average Convergence Divergence) shows you the momentum of the market. Positive MACD values mean the market has bullish momentum. Negative values mean bearish momentum. RSI (Relative Strength Index) tells you if the hang seng index is overbought or oversold. High RSI means the market could be too hot. Low RSI means it could be too cold.
Here’s a table showing how these indicators work with the hang seng index:
| Indicator | Periods (Days) | Quantified Values (Examples) | Interpretation |
|---|---|---|---|
| Moving Average | 5, 20, 50, 100, 200, YTD | Values range from ~21,145 to ~23,935 with % changes from -2.69% to +36.34% | Smoothing price movements to identify bullish/bearish trends; crossovers indicate market turns. |
| RSI (Relative Strength Index) | 9, 14, 20, 50, 100 | Relative Strength ranges ~47.87% to 54.56%; Percent R varies widely (e.g., 14.07% to 90.20%) | Indicates overbought/oversold conditions; high RSI signals rallies, low RSI signals sell-offs. |
| MACD Oscillator | 9, 14, 20, 50, 100 | Values range from -103.08 to 1,225.96 | Positive values suggest bullish momentum; negative values suggest bearish momentum. |
You can see that these indicators give you real numbers to guide your trading strategies. Many traders trust these tools because research shows they can predict price moves better than guessing. Technical analysis works well for short-term trading because it updates fast. You can use these tools to watch the hang seng index and spot new opportunities in the market.
Tip: Try using a combination of moving averages and RSI to confirm your trading signals. This helps you avoid false alarms and improves your trading strategies.
Fundamental Analysis
You want to know if a company in the hang seng index has strong financial health. Fundamental analysis helps you do this. You look at earnings reports, balance sheets, and other financial disclosures. You check key ratios like price-earnings, dividend yield, and book-to-market. These numbers show you if a stock is cheap or expensive. They also tell you if a company can grow and make profits.
Many investors use fundamental analysis to find good investments for their portfolio. You can see how a company’s financial health affects its stock price. Research shows that there is a link between stock prices and financial statement numbers. When you use ratios like dividend-price or price-earnings, you get clues about future performance. Sometimes, one ratio does not tell the whole story. If you combine several ratios, you get a better view of the company’s valuation and the market.
You can also use advanced models to study the hang seng index. For example, multifractal analysis shows that price changes are not random. When certain patterns appear, the chance of gains can go above 70%. If the patterns turn negative, the chance drops below 20%. This means you can use fundamental analysis to spot trends and improve your trading strategies.
Note: Always check the latest earnings reports and financial disclosures. These updates help you see changes in financial health and spot risks before they hurt your portfolio.
Combining Both
You get the best results when you use both technical analysis and fundamental analysis. Many investors and traders mix these methods to build strong trading strategies. Technical analysis helps you time your trades. Fundamental analysis helps you pick the right stocks for your portfolio. When you combine both, you see the big picture.
Industry research shows that the hang seng index uses a free-float-adjusted, market capitalization-weighted method. The index picks stocks based on market value, turnover, financial performance, and sector. This mix gives you a balanced view of the stock market and the economy. You can see how valuation and financial health shape the index.
| Aspect | Details |
|---|---|
| Calculation Method | Free-float-adjusted, market capitalization-weighted approach |
| Constituent Stock Selection | - Top 90% of total market value on HKEX |
| - Top 90% of total turnover on HKEX | |
| - Listing history of at least 24 months or other criteria | |
| Final Selection Criteria | - Market capitalization and turnover rankings |
| - Financial performance | |
| - Sector representation | |
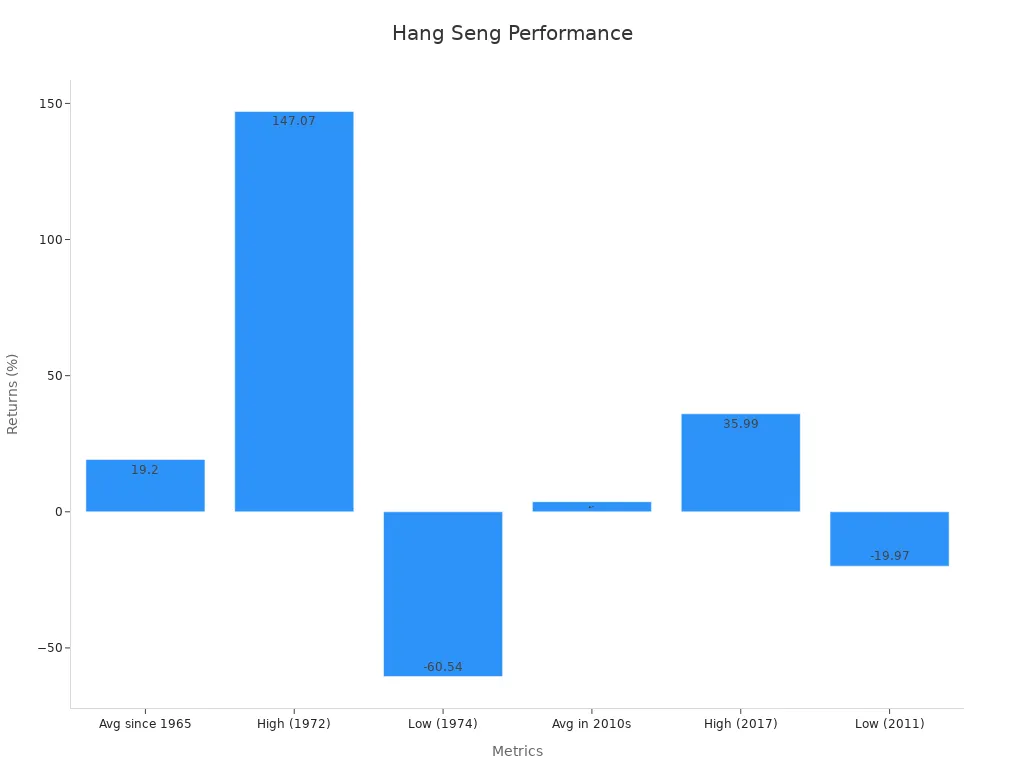
| Historical Performance Metrics | - Average annual return since 1965: ~19.2% |
| - Highest annual return: 147.07% (1972) | |
| - Lowest annual return: -60.54% (1974) | |
| - 2010s average annual growth: ~3.7% | |
| - Highest 2010s return: 35.99% (2017) | |
| - Lowest 2010s return: -19.97% (2011) |
You can use technical analysis to spot entry and exit points. You use fundamental analysis to check the financial health and valuation of each stock. This approach helps you manage risk and find the best opportunities in the market. Many traders and investors who follow the hang seng index use both methods to improve their performance and grow their investments.
Callout: Mixing technical and fundamental analysis gives you a better chance to build a strong portfolio and reach your investment goals. You learn how the stock market, economy, and company valuation all work together.
Monitoring and Alerts
Setting Notifications
You want to stay on top of the hang seng index. Setting notifications helps you react fast to changes in the stock market. Many investors and traders use alerts to track the market. You can set up notifications on your favorite financial app or website. These alerts tell you when the hang seng index moves up or down. You can also get alerts for big news that affects the stock market. Some apps let you pick which stocks or sectors to watch. This way, you never miss important updates about the market.
You can choose to get notifications for price changes, volume spikes, or new analysis reports. Many traders like to set alerts for technical signals or fundamental analysis updates. You can get a message when the hang seng index crosses a certain value. This helps you make quick trading decisions. Investors who use notifications often spot trends before others. You can also set alerts for new analysis from experts. This keeps you informed about the latest market moves.
Tip: Try setting different types of notifications. Use price alerts for trading and news alerts for fundamental analysis. This gives you a full view of the stock market.
Creating a Routine
You need a routine to follow the hang seng index every day. Many investors and traders check the market at the same time each morning. You can start your day by reading the latest analysis. Look at how the hang seng index moved overnight. Check for new trends in the stock market. Review any alerts you got from your notifications. This helps you plan your trading for the day.
You can make a checklist to guide your routine:
- Check the hang seng index value and main market news.
- Read new analysis reports from trusted sources.
- Review your watchlist for changes in the stock market.
- Look at technical and fundamental analysis signals.
- Plan your trading moves based on what you see.
Many investors find that a routine makes analysis easier. You get better at spotting patterns in the market. Traders who follow a routine often make smarter trading choices. You learn how the stock market reacts to news and analysis. Over time, you build strong habits that help you grow as an investor.
Note: A good routine mixes technical and fundamental analysis. This helps you understand the hang seng index and the whole stock market.
Common Mistakes
When you start following the hang seng index, you might make some common mistakes. Many new traders and investors fall into these traps. If you know what to watch out for, you can improve your trading and analysis skills. Let’s look at three mistakes you should avoid when tracking the stock market and the hang seng index.
Overcomplicating
You might think you need to use every tool and chart for analysis. Many traders try to use too many indicators at once. This can make your trading confusing. You may lose sight of the real market trends. The hang seng index gives you a lot of data, but you do not need to use every piece for your analysis. Focus on a few key indicators that show performance and market direction. Simple tools like moving averages or RSI can help you see how the stock market moves. If you keep your trading plan simple, you can react faster to changes in the market.
Tip: Start with basic analysis tools. Add more only when you feel comfortable with the hang seng index and the stock market.
Ignoring Key Data
Some traders skip important data when they look at the hang seng index. You might miss earnings reports or news about the stock market. This can hurt your trading performance. The market reacts to news from China and global events. If you ignore key data, you may not see big changes coming. Always check the latest analysis and performance numbers. Watch for updates from Hong Kong banks and companies in the hang seng index. This helps you make better trading decisions and spot new trends in the market.
- Make a habit of checking:
- Earnings reports
- Market news
- Analysis updates
- Performance charts
Unverified Sources
You may find a lot of analysis and trading tips online. Not all sources give you correct information about the hang seng index or the stock market. Some traders follow rumors or unverified news. This can lead to poor trading performance. Always use trusted financial websites or apps for your analysis. Check the source before you act on any trading advice. Reliable data helps you see the real market trends and make smart decisions.
Note: Trusted sources give you accurate performance data and analysis for the hang seng index and the stock market. This keeps your trading on track.
Hang Seng Index Comparison

Image Source: pexels
Differences and Similarities
You might wonder how the hang seng index and the hang seng enterprise index compare. Both track the stock market in Hong Kong and help investors understand the hong kong economy.The Hang Seng Index covers the biggest companies in the Hong Kong economy, including local giants and some from China. The Hang Seng Enterprise Index focuses on H-shares, which are companies from China listed in Hong Kong.
Here’s a simple table to help you see the main differences and similarities:
| Feature | Hang Seng Index | Hang Seng Enterprise Index |
|---|---|---|
| Main Focus | Top Hong Kong companies | Chinese companies (H-shares) |
| Number of Stocks | About 50 | About 80 |
| Role in Market | Shows whole market | Focuses on China’s impact |
| Use for Investors | General market view | Sector and regional analysis |
| Impact on Economy | Reflects hong kong economy | Shows China’s role in the Hong Kong economy |
Both indexes help investors and traders follow the stock market and spot trends. You can use them to see how the hong kong economy and the market change over time. Investors often look at both to get a full picture of the stock market.
Note: The Hang Seng Index gives you a broad view of the Hong Kong economy, while the Hang Seng Enterprise Index zooms in on China’s companies in the market.
Using Both for Broader Insight
If you want to become a better investor, you should use both indexes in your trading and analysis. The hang seng index shows you how the whole hong kong economy moves. The Hang Seng Enterprise Index lets you see how China’s companies shape the market.By watching both, you spot trends in the stock market and understand how the hong kong economy reacts to news.
Many investors use both indexes to compare performance. You can see if the hang seng enterprise index moves faster than the hang seng index during big changes in the economy. This helps you find new trading ideas and manage risk. When you track both, you learn how different sectors and companies affect the stock market and the hong kong economy.
- Check both indexes each day to see how the market changes.
- Use watchlists to follow top stocks from each index.
- Read analysis about the hong kong economy and the stock market to spot new trends.
Investors who use both indexes often make smarter trading choices. You get a deeper view of the market and the hong kong economy. This habit helps you grow as an investor and keeps your trading skills sharp.
You can track the hang seng index with simple steps. Start by picking a trusted tool to watch the market. Use analysis to spot trends in the hang seng index. Check the market every day. Investors learn from both technical and fundamental analysis. The hang seng index shows how the economy moves. Investors use analysis to find new chances in the market. You see how the hang seng index reacts to the economy. Try different analysis tools. Investors who follow the hang seng index and use fundamental analysis understand the market better.
Remember, the hang seng index helps investors see the economy. Use analysis every day to grow your skills in the market.
FAQ
How do I start tracking the Hang Seng China Enterprises Index?
You can start by picking a reliable financial website or app. Add the index to your watchlist. Check the market each day to see how it moves. This habit helps you learn about the market quickly.
Can I invest directly in the Hang Seng China Enterprises Index?
You cannot buy the index itself. You can invest in exchange-traded funds (ETFs) that follow the index. These ETFs trade on the market just like regular stocks.
Why does the Hang Seng China Enterprises Index matter for new investors?
This index shows how top companies from China perform in the Hong Kong market. Watching it helps you spot trends and understand how the market reacts to news and events.
What tools help me analyze the Hang Seng China Enterprises Index?
You can use charts, technical indicators, and news updates. Many apps and websites offer these tools. They help you see how the market changes and make better decisions.
Empower your Hang Seng China Enterprises Index tracking with BiyaPay! In just 1 minute, register to bypass cumbersome overseas account setups, enabling seamless H-share and ETF trading for beginners. Our multi-asset wallet converts USDT to HKD and other fiat currencies fee-free, with overseas bank transfers at a low 0.5% cost, ensuring you can swiftly fund your brokerage account to capture market trends. BiyaPay’s secure platform simplifies your entry into Hong Kong’s dynamic market. Start today—visit BiyaPay to unlock your H-share investment potential!
*This article is provided for general information purposes and does not constitute legal, tax or other professional advice from BiyaPay or its subsidiaries and its affiliates, and it is not intended as a substitute for obtaining advice from a financial advisor or any other professional.
We make no representations, warranties or warranties, express or implied, as to the accuracy, completeness or timeliness of the contents of this publication.


Contact Us
Company and Team
BiyaPay Products
Customer Services


is a broker-dealer registered with the U.S. Securities and Exchange Commission (SEC) (No.: 802-127417), member of the Financial Industry Regulatory Authority (FINRA) (CRD: 325027), member of the Securities Investor Protection Corporation (SIPC), and regulated by FINRA and SEC.
registered with the US Financial Crimes Enforcement Network (FinCEN), as a Money Services Business (MSB), registration number: 31000218637349, and regulated by FinCEN.
registered as Financial Service Provider (FSP number: FSP1007221) in New Zealand, and is a member of the Financial Dispute Resolution Scheme, a New Zealand independent dispute resolution service provider.