- EasyCard
- Trade
- Help
- Announcement
- Academy
- SWIFT Code
- Iban Number
- Referral
- Customer Service
- Blog
- Creator
From Tariffs to Turmoil How Trump's Policies Shaped the Crash


Image Source: unsplash
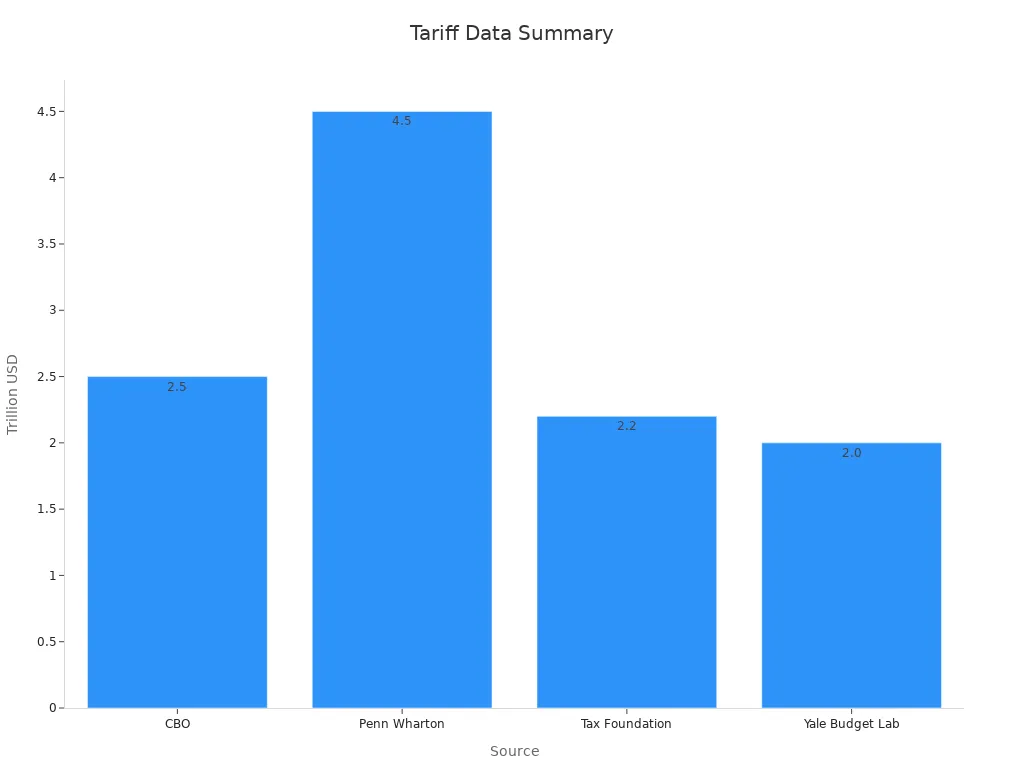
“When policy uncertainty doubles, investors notice. The 2025 trump crash began as trump imposed sweeping tariffs on imports from China, Canada, and Mexico. Markets responded quickly. The Dow Jones dropped 2%, and Nasdaq fell 4%. Consumer sentiment dropped by 16%. The Penn Wharton model projected $4.5 trillion in tariff revenue, but also warned of economic shrinkage. Inflation rose, with estimates showing household costs up by $2,000. The following table shows how major institutions connected trump’s tariffs to the shrinking economy and the trump crash.”
| Source | Projection/Statistic | Notes |
|---|---|---|
| Congressional Budget Office (CBO) | $2.5 trillion deficit reduction over 10 years due to tariffs | Includes tariffs on imports from China, Canada, Mexico, steel, aluminum, autos, and parts. |
| CBO | Shrinking U.S. economy size and disproportionate impact on poorer Americans | Tariffs increase prices on goods, especially durable goods like cars and appliances. |
| Penn Wharton | $4.5 trillion revenue projected from ‘Liberation Day tariffs’ accounting for economic shrinkage | More expansive tariff scenario than CBO; includes economy-shrinking effects. |
| Tax Foundation | $2.2 trillion revenue from a 10% universal tariff (2025-2034) | Dynamic effects included. |
| Yale Budget Lab | $2 trillion revenue including dynamic effects; $2.4 trillion without $347 billion economic shrinkage | Highlights losses due to economic contraction. |
| CBO (pending) | Economic growth/shrinkage effects to be included in future scoring | Current score excludes these effects. |
Key Takeaways
- Trump’s 2025 tariffs on imports from China, Canada, and Mexico raised prices for many goods, costing families about $2,000 more per year and slowing economic growth.
- The trade war caused job losses in export industries and disrupted global supply chains, leading to lower wages and fewer job opportunities in some sectors.
- Stock markets reacted sharply to rising trade tensions, with major indexes dropping quickly as investors grew uncertain about the economy’s future.
- The crash showed how unclear and changing trade policies can harm business confidence and economic stability, highlighting the need for clear rules and strong institutions.
Trump’s Economic Policies
Tariffs and Trade War
President Trump’s economic policies placed tariffs at the center of his approach to international trade. In 2025, he imposed sweeping tariffs on imports from China, Canada, and Mexico. These actions triggered a trade war that reshaped global commerce. The average tariff rates jumped from 1.5% in 2022 to 16.1% under the new measures. President Trump’s tariffs on imports from China, Canada, and Mexico led to a sharp increase in federal tax revenues, with projections showing an additional $156.4 billion in 2025 alone. However, these tariffs also reduced US GDP by about 0.9% and caused a net loss of 27,000 full-time jobs.
- Tariff revenue collections reached over $264 billion by the end of 2024.
- The average US household paid between $200 and $625 more each year due to higher prices.
- Washing machine prices rose by $86 per unit, and dryers by $92, costing consumers over $1.5 billion.
The trade war with China, Canada, and Mexico also led to significant retaliation. Imports from China dropped sharply, and global trade flows shifted. According to the Richmond Fed’s 2025 CFO Survey, over 30% of firms listed tariffs as their top business concern, up from 8.3% the previous quarter. The following table highlights key data sources that tracked the effects of these trade barriers:
| Data Source / Study | Description | Evidence Provided |
|---|---|---|
| CEPII BACI International Trade Database | Product-level trade data for sector analysis | Baseline trade flow data to assess tariff impacts |
| CEPII MAcMap-HS6 Tariff Database | Detailed applied tariff measures | Measures tariff levels and changes over time |
| Fajgelbaum et al. (2024) | Tariff escalation data on the US-China trade war | Shows effects on trade reallocations and welfare losses |
| Richmond Fed CFO Survey | Survey of firms’ concerns | Over 30% cite tariffs as top concern |
| VoxEU Analysis (April 2025) | Scenario modeling of tariff impacts | Quantifies welfare losses and trade volume declines |
Tax Cuts and Deregulation
Trump’s economic policies also included major tax cuts and deregulation. The 2017 Tax Cut and Jobs Act lowered corporate tax rates, which increased business confidence and investment. Real GDP growth rose from 2.1% in 2015–16 to 3% in 2017. Deregulation in financial and energy sectors reduced burdens on businesses, encouraging lending and economic activity. However, the trade war and president Trump’s tariffs on imports from China, Canada, and Mexico offset some of these gains. Aggressive tariff scenarios aimed to increase federal revenues by $3.8 trillion over ten years, but higher tariff rates also raised costs for businesses and consumers.
Immigration and Labor Market
Immigration policy changes under Trump affected the labor market. Between 2016 and 2019, new permanent resident admissions dropped by 13%, and student visas fell by 23%. This decline in net international migration led to a 5.5 percentage point increase in the vacancy-to-unemployment ratio, signaling a tighter labor market. Pandemic-related border closures in 2020 further tightened the market, but a rebound in 2022 helped ease pressure. In 2023, the population grew by 2.5 million more than official data suggested, with 950,000 foreign-born individuals contributing to higher employment growth. States with more foreign-born workers saw stronger labor market tightening when migration declined. These shifts in labor supply influenced employment rates and wage growth, especially as the trade war and president Trump’s tariffs continued to impact imports from China, Canada, and Mexico.
Trade War Impact

Image Source: unsplash
Retaliation and Global Trade
The trade war between the United States, China, Canada, and Mexico led to widespread retaliation. Trading partners responded to trump tariffs by imposing their own tariffs on American goods. This retaliation affected many sectors and changed global trade patterns. Multiple datasets show that Canada, China, Mexico, the European Union, India, Turkey, and Russia all imposed retaliatory tariffs. These tariffs targeted thousands of products, raising average tariff rates from 7.3% to 20.4% on 7,763 products. By October 2018, these measures covered $120 billion of US exports, about 6% of total exports.
- Product-level tariff data and trade flow data tracked the scope and sectoral distribution of retaliation.
- Empirical analysis found that Chinese and Canadian tariffs had larger negative effects on trade volumes than those from the EU.
- Retaliatory tariffs caused US exports to shift away from China, Canada, and Mexico toward other markets in East and South Asia and Europe.
The following table highlights the global trade effects of the trade war and retaliation:
| Trade Aspect | Figure / Impact Description | Notes / Implications |
|---|---|---|
| Total imports from Canada, China, Mexico | $1.3 trillion | Nearly half of all U.S. imports come from these three countries |
| Reduction in U.S. imports | 15% | Due to tariffs imposed on these trading partners |
| Estimated federal tariff revenue | $100 billion annually | Extra federal tax revenue generated by tariffs |
| Tariff rate on Canada and Mexico | 25% | Raises production costs, especially in automotive sector |
| Increase in car prices | Up to $3,000 per vehicle | Resulting from tariffs on auto parts imports |
| Gas price increase in Midwest | Up to 50 cents per gallon | Due to tariffs affecting crude oil imports from Canada and Mexico |
| Mexico’s share of U.S. vegetable imports | Over 60% | Tariffs impact fresh produce prices |
| Export dependency of states | Texas: $20 billion exports to Mexico (5% of GDP); New Mexico: 70% exports to Mexico; Ohio: $5 billion exports to Canada; Maine: $320 million exports to Canada | Retaliatory tariffs affect manufacturing-heavy states and key export sectors |
Domestic Manufacturing Effects
The trade war and trump tariffs had direct economic effects on domestic manufacturing. Studies using firm-level transaction data from China during the 2018-2019 trade war show that a 1% increase in export tariffs led to a 0.235% increase in sales to domestic buyers. However, this shift did not fully offset the loss in exports, causing lower total production and reduced demand for domestic inputs. A 1% increase in import tariffs caused a 0.995% decrease in domestic purchases, showing that imported intermediates and domestic inputs are complements. Higher tariffs raised costs and created bottlenecks, especially for larger firms. Smaller firms adapted better, but larger, export-reliant firms saw bigger declines in sales and input use.
The economic effects of the trade war included supply chain disruptions, higher production costs, and lower efficiency. The impact varied by firm size and sector, but the overall result was a decline in manufacturing performance. The trade war between the United States, China, Canada, and Mexico changed sourcing strategies and forced firms to adjust quickly to new economic realities.
Economic Impact of 2025 Policies
GDP and Growth
The 2025 tariffs and related policies created a clear drag on economic growth. The Federal Reserve lowered its forecast for US GDP growth in 2025 from 1.8% to 1.4%. This change followed a strong 2.8% growth rate in the previous year. Many economic models showed that the economy slowed sharply as tariffs took effect. For example:
- US GDP growth dropped from 2.4% in Q4 2024 to just 0.8% in Q1 2025.
- Economists predicted US GDP growth would hover around 1.1% to 1.2% for both 2025 and 2026.
- The IMF projected US GDP growth at 1.8% in 2025, while global growth reached 3.3% in 2024.
The World Bank also reported that global GDP growth would slow to 2.3% in 2025, the weakest in 17 years outside of recessions. The main reason for this slowdown was the sharp rise in trade barriers and policy uncertainty. Businesses and consumers changed their spending patterns, often frontloading imports to avoid new tariffs. The Penn Wharton Budget Model provided a long-term view of the economic impact. It projected that the 2025 tariff policies would reduce GDP by up to 1% below baseline by 2049 and 2054. The following table shows the projected changes in key economic indicators:
| Economic Indicator | 2030 | 2034 | 2039 | 2044 | 2049 | 2054 |
|---|---|---|---|---|---|---|
| GDP (% change from baseline) | -0.4% | -0.7% | -0.8% | -0.9% | -1.0% | -1.0% |
| Capital Stock | -1.2% | -1.9% | -2.3% | -2.4% | -2.5% | -2.5% |
| Average Wage | -0.5% | -0.9% | -1.1% | -1.1% | -1.2% | -1.2% |
| Consumption | -1.1% | -1.6% | -1.9% | -2.1% | -2.2% | -2.2% |
| Debt Held by the Public | -6.4% | -8.3% | -9.2% | -9.6% | -9.7% | -9.7% |
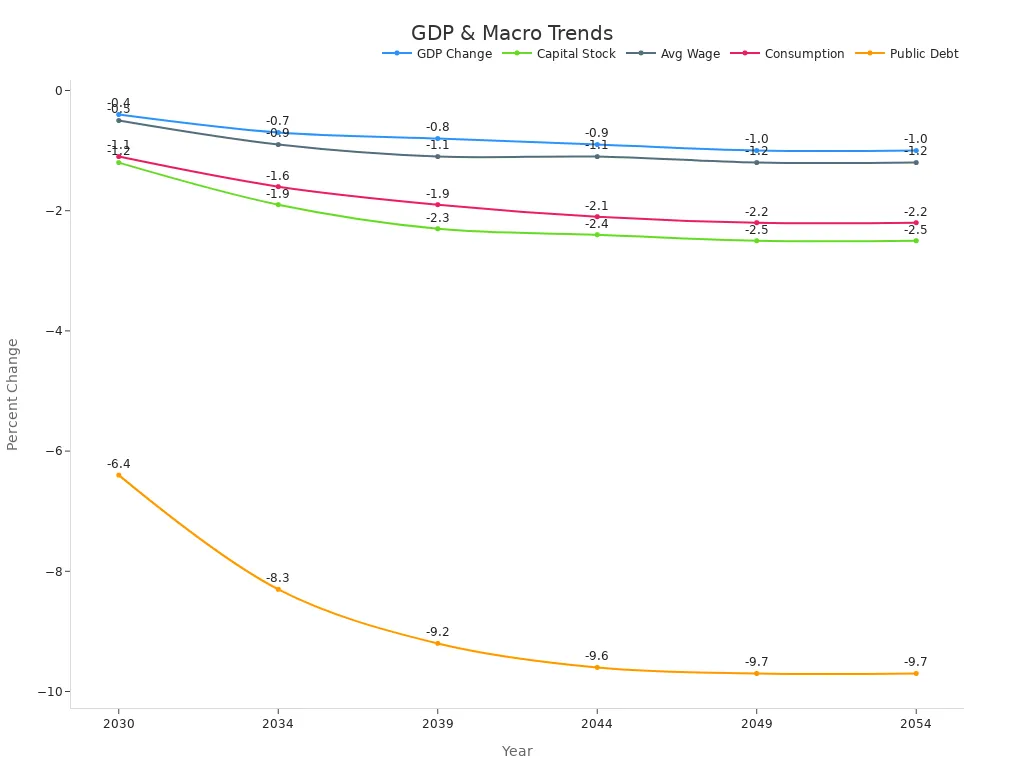
The Penn Wharton model also estimated that the 2025 tariffs would reduce long-run GDP by about 6%. Average wages would fall by 5%. A typical middle-income household could lose around USD 22,000 over a lifetime. These losses were more than twice as large as those from an equivalent corporate tax increase. The broader economic impact of these policies became clear as the US economy lost momentum and growth lagged behind global trends.
Jobs and Wages
The economic effects of the 2025 policies extended to jobs and wages. Tariffs and trade barriers changed the labor market. Some sectors saw job losses as exports fell and production costs rose. Other sectors, especially those less exposed to trade, saw smaller changes. The Penn Wharton Budget Model showed that average wages declined by about 5% in the long run. The table above highlights this trend, with average wages dropping by up to 1.2% below baseline by 2054.
A study of wage policy in Lithuania offered insight into how wage increases can affect employment. Workers earning below the minimum wage saw their incomes rise by 11.5% after a policy change. The study found limited negative effects on employment, except for a delayed impact on part-time workers. This suggests that wage policies can help reduce inequality without causing large job losses. However, the US experience with tariffs showed that higher costs and lower demand led to slower wage growth and fewer job opportunities in some industries.
The US economy faced a tighter labor market as immigration slowed and tariffs raised costs for businesses. Some workers benefited from higher wages, but many saw limited gains. The overall impact was a reduction in wage growth and a shift in job opportunities. The economic impact of these policies became clear as wage growth slowed and job creation weakened.
Inflation and Consumer Costs
Tariffs and deregulation measures contributed to higher inflation and increased consumer costs. The CEI analysis reported that overall inflation rose by 0.1% in May. Food and housing prices increased at three times the overall inflation rate. Tariffs played a key role in these sector-specific cost increases. Some businesses tried to absorb higher costs, but many passed them on to consumers.
The Consumer Price Index (CPI) tracked these changes across major categories like housing, food, transportation, and medical care. The CPI showed that tariffs and deregulation raised prices for many goods and services. The U.S. Bureau of Economic Analysis and the University of Michigan consumer sentiment index both linked tariff policy changes to higher inflation and lower consumer confidence.
Note: The economic effects of tariffs and deregulation reached every household. A typical family paid about USD 2,000 more per year due to higher prices on goods like cars, appliances, and groceries.
The economic impact of these policies included higher costs for basic needs, reduced purchasing power, and lower consumer confidence. The effects of tariffs and deregulation rippled through the economy, making it harder for families to keep up with rising prices.
Market and Investor Reaction
Image Source: unsplash
Stock Market Sell-Off
The stock market responded quickly to Trump’s 2025 policies. Investors saw sharp declines as trade tensions with China and canada increased. The S&P 500 dropped nearly 20% by December 2018, coming close to bear market territory. This fall happened as the Federal Reserve raised interest rates and the trade war escalated. Volatility in the market rose sharply, which contrasted with the calm seen before 2018. Many investors lost confidence in the stability of the us economy. They moved money out of stocks and into safer assets. The effects of these changes spread across global markets, with canada and other trading partners also seeing declines. Companies that relied on exports to china and canada faced the biggest losses. The market sell-off showed how quickly investor sentiment can change when policy uncertainty rises.
Business Confidence
Business confidence plays a key role in shaping economic trends. The Business Confidence Index (BCI) helps central banks and governments decide when to adjust interest rates, public spending, and taxes. During the trade war, business leaders in canada and the us economy watched the BCI closely. They saw how sharp drops in confidence led to quick policy changes during past crises, such as the 2008 financial crisis. Real-time business confidence surveys became important tools during shocks like the COVID-19 pandemic. These surveys now include global data and sector-specific results, which help leaders understand the effects of policy changes. Regional differences in the BCI show that developed economies often remain stable, while emerging markets can react with more volatility. By comparing BCI trends across regions, analysts can predict how markets will respond to new policies. The effects of Trump’s tariffs and trade war became clear as business confidence fell in both the us economy and canada.
Institutional Trust and Governance
Politicization of Institutions
The period following Trump’s 2025 policy changes saw a sharp decline in trust toward key institutions. Many Americans began to question the fairness and independence of the Supreme Court. Gallup polls showed that trust in the Supreme Court dropped by 20 percentage points over two years, reaching the lowest level in five decades. Only 47% of adults expressed confidence in the judicial branch. Approval ratings for the Court fell to a record low of 40% in September 2022. This decline followed Trump’s three Supreme Court nominations, which shifted the court’s ideological balance. Democrats’ trust in the judicial branch halved in one year, dropping from 50% to 25%. The perception that the Court had become “too conservative” reached a new high of 42%.
Public opinion polls also revealed a net decline in Trump’s approval ratings. His ratings rarely exceeded 50%, and many surveys showed more intense opposition than support. This erosion of trust created increased economic policy uncertainty. When people lose faith in institutions, they often expect more policy swings and less stability. The resulting uncertainty can slow investment and growth in the economy.
History shows that politicized institutions can have measurable economic impacts.
- World War I led to financial burdens and long-term debt for European countries, shifting global economic power.
- The Great Depression started in the United States and caused massive unemployment, leading to new regulations and social programs.
- After World War II, countries created new alliances and regulations, showing how institutional changes affect the economy.
These examples highlight how increased economic policy uncertainty and politicization can shape the path of the economy.
International Relations
Trump’s policies toward China, Canada, and Mexico changed the landscape of global partnerships. The trade war and retaliation measures led to increased economic policy uncertainty. Researchers at Tsinghua University developed a monthly scoring system for bilateral political relations. This system tracked events like state visits, summits, and conflicts. For example, diplomatic incidents between the United States and China in 1989 and 1999 caused a drop of 2.2 points in their relationship score. These scores help show how policy decisions and retaliation affect trade and partnerships.
Retaliation from China, Canada, and Mexico became a regular feature of the trade environment. Each country responded to tariffs with their own measures, increasing uncertainty for businesses. The scoring system confirmed that shocks to political relations have a lasting impact on trade flows. Data diplomacy also played a role. Countries used big data and information sharing to address global challenges, such as climate change and health crises. Shared data allowed for better policy coordination and helped build trust between nations. For example, the United Nations created climate data frameworks, and countries worked together on health data during the COVID-19 pandemic.
Retaliation and trade disputes between China, Canada, and Mexico increased economic policy uncertainty. These actions disrupted supply chains and made it harder for companies to plan for the future. The economy felt the effects as global partnerships weakened and uncertainty grew.
Trump Crash Triggers
Policy Accumulation
The trump crash did not happen overnight. Instead, it resulted from a steady build-up of trade and economic policies over several years. Trump introduced tariffs on imports from China, canada, and Mexico, which raised costs for businesses and consumers. These tariffs affected nearly every sector, from manufacturing to agriculture. Over time, the trade war with canada and other partners led to more retaliation. Each new round of tariffs brought more uncertainty to the market.
The Federal Reserve Bank of San Francisco found that financial crises often follow a period of growing macrofinancial imbalances. In the years before the trump crash, the United States saw a rapid rise in income inequality. The top 10% of earners took a larger share of total income. At the same time, labor productivity growth slowed. These trends signaled deeper problems in the economy. Policymakers focused on tariffs and trade barriers, but ignored these warning signs. As a result, the economic system became more fragile.
Trump’s approach to trade policy relied on aggressive tariffs and frequent threats of more retaliation. Canada, China, and Mexico responded with their own tariffs. This cycle of action and retaliation created a tense trade environment. Businesses struggled to plan for the future. Many firms delayed investments or shifted supply chains to avoid new tariffs. The constant changes in trade policy made it hard for companies to adapt. Over time, the accumulation of tariffs, trade disputes, and policy shifts weakened the foundation of the economy.
Note: Policy accumulation acts like pressure building behind a dam. Each new trade barrier or tariff adds more strain. Eventually, the system can no longer hold, and a crisis erupts.
Crash Events
The events of April 2025 marked the tipping point for the trump crash. A series of sudden policy moves and market reactions triggered a historic decline. The timeline below shows how the crisis unfolded:
| Date | Event Description | Market Impact / Data Points |
|---|---|---|
| April 2, 2025 | President Donald Trump announced sweeping tariffs called “Liberation Day” impacting nearly all US sectors. | Triggered panic selling globally; futures dropped sharply (S&P 500 futures -3.9%, Nasdaq-100 futures -4.7%, Dow futures -2.7%). Largest global market decline since 2020 crash. |
| April 3, 2025 | Market sell-off continued. Nasdaq Composite lost 1,600 points; S&P 500 dropped 6.65%; Dow fell 1,679 points (3.98%); Russell 2000 fell 6.59%, entering bear market. | Severe losses across major indices; near trading curb activation. |
| April 4, 2025 | China imposed a 34% retaliatory tariff. | Dow Jones fell 2,231 points (5.5%), S&P 500 lost 5.97%, Nasdaq Composite lost 5.8% entering bear market. Dow lost over 4,000 points (9.48%) over two days; S&P lost 10%, Nasdaq 11%. $6.6 trillion lost in two days, worst two-day loss in history. VIX spiked 15 points to 45.31, highest since 2020 crash. Oil prices fell over 7%. |
| April 5, 2025 | First 10% minimum tariff on nearly all US imports went into effect. | Market continued to decline after opening on April 7; three-day losses worst since Black Monday (1987). |
| April 6-7, 2025 | Market volatility continued; rumors of tariff pause denied by White House. | Dow lost over 300 points on April 6; Nasdaq showed slight intraday recovery but overall market remained weak. |
The sequence began with trump’s announcement of new tariffs on April 2, 2025. This move shocked investors and led to panic selling. The next day, markets continued to fall. Major indices like the Nasdaq and S&P 500 suffered some of their largest single-day losses in history. On April 4, China responded with a 34% retaliatory tariff. This retaliation deepened the crisis. The Dow Jones lost over 4,000 points in just two days. The S&P 500 and Nasdaq both entered bear market territory. The total loss reached $6.6 trillion USD, the worst two-day drop ever recorded. Oil prices also fell sharply, showing the global reach of the crisis.
By April 5, the first 10% minimum tariff on nearly all US imports took effect. The market continued to decline. Over the next two days, rumors of a possible pause in tariffs spread, but the White House denied them. The market remained unstable, with continued losses and high volatility.
Academic studies define market crashes as sudden, steep drops in asset prices. These events often involve daily declines of 5-10% or more. Crashes like the trump crash share features with past crises, such as the 1929 Great Depression, 1987 Black Monday, and the 2008 financial crisis. Each of these events followed a period of policy accumulation and ended with a sharp, systemic shock.
| Market Crash Event | Trigger/Event Highlights | Market Impact Highlights | Government/Regulatory Response | Recovery Timeline Highlights |
|---|---|---|---|---|
| 1929 Great Depression | Overvaluation, margin trading, panic selling on Black Thursday and Black Tuesday (Oct 24 & 29, 1929) | Dow declined 13% then 12% over two days; 89% drop by 1932 | NY Fed intervened with securities sales and lower discount rates | Market recovery began around 1939 after financial system restructuring |
| 1987 Black Monday | Rising interest rates, weakening dollar, automated trading triggered massive sell-offs on Oct 19, 1987 | Dow dropped 22.6% in one day; $500 billion market cap loss | Federal Reserve guaranteed liquidity; NYSE introduced circuit breakers | Market stabilized by early 1988; full recovery by mid-1988 |
| 2000 Dotcom Bubble Burst | Overhyped tech IPOs without profits; burst began March 2000 after disappointing earnings | NASDAQ lost 75% of value by Oct 2002; ~$5 trillion losses | SEC penalties; Economic Growth and Tax Relief Reconciliation Act of 2001 | Nearly half of dotcom companies survived through 2004 |
| 2008 Financial Crisis | Mortgage defaults, Bear Stearns collapse (Mar 2008), Lehman Brothers bankruptcy (Sep 2008) | Dow fell 13% in Sep 2008; 54% drop by Mar 2009 | $700 billion bailout plan; American Recovery and Reinvestment Act 2009; Dodd-Frank Act 2010 | Market took about 4 years to rebound |
| 2020 COVID-19 Crash | Pandemic onset, WHO pandemic declaration on Mar 11, 2020 | Dow dropped nearly 13% on Mar 16, 2020; multiple large single-day drops | $2.2 trillion stimulus; Fed lowered rates and injected $1.5 trillion; trading halts | Market rebounded strongly by late 2020, with S&P 500 and Dow reaching new highs |
The trump crash fits this pattern. Years of trade policy changes, rising tariffs, and repeated retaliation from canada, China, and Mexico set the stage. The sudden announcement of new tariffs triggered a chain reaction. Retaliation followed quickly, deepening the economic shock. The market crash of April 2025 stands as a warning. Policy accumulation and trade tensions can build up unseen risks. When these risks break loose, the results can be swift and severe.
Lessons and Future Risks
Policy Uncertainty
The trump crash highlighted how economic policy uncertainty can destabilize markets and societies. When leaders in the United States, canada, and mexico introduced rapid trade changes, businesses and investors faced confusion. Studies show that economic policy uncertainty often leads firms to delay investments and consumers to cut spending. The EPU index, which tracks uncertainty, spiked during the crash, mirroring past events like Brexit and the global financial crisis. These periods saw sharp drops in stock prices and GDP growth.
Regulatory frameworks now recommend clear model validation and risk monitoring to manage uncertainty. For example, the US Federal Reserve and Bank of England urge institutions to use prediction intervals and performance monitoring. These steps help reduce the risk of sudden shocks. Transparent policies and strong governance can limit the negative effects of economic policy uncertainty.
| Historical Event | Economic Impact | Key Lesson |
|---|---|---|
| Brexit | Volatility in trade and currency sectors | Need for contingency planning |
| Global Financial Crisis | Decline in investor confidence and GDP growth | Importance of proactive oversight |
| COVID-19 Pandemic | Supply chain disruptions across mexico, canada, and beyond | Value of agile policymaking |
Economic Stability
Economic stability depends on resilient trade systems and strong institutions. The crash revealed that high asset values and leverage can increase risks. Supervisory agencies recommend tighter regulations and regular stress tests to spot vulnerabilities. Enhanced global stress tests now reveal weaknesses in high-interest environments.
Policymakers in mexico, canada, and the United States must address trade disruptions and supply chain fragilities. The COVID-19 pandemic exposed how quickly shortages can spread across borders. Integrated policy frameworks that support trade, infrastructure, and fair welfare distribution can help build resilience. Advances in technology and trade liberalization have made global value chains more complex, so risk management strategies must adapt.
Note: Trust in institutions and international cooperation remain essential. When countries like mexico and canada work together, they can better manage economic shocks and reduce uncertainty. Future economic policy should focus on transparency, robust oversight, and global partnerships to protect against the next crisis.
Trump’s 2025 tariffs and trade war triggered the trump crash by raising uncertainty and causing sharp market declines. Sectors like technology and agriculture suffered as tariffs reduced trade with China and increased costs. The SMART model shows US imports from China dropped by USD 108,458 million, while overall welfare fell.
Policymakers must prioritize stable institutions and transparent trade rules to protect future economic growth.
FAQ
What caused the sharp rise in consumer prices during the trump crash?
Tariffs on imports from China, Canada, and Mexico increased costs for businesses. Many companies passed these higher costs to consumers. As a result, families paid about USD 2,000 more per year for everyday goods.
How did the 2025 tariffs affect US jobs?
The tariffs led to job losses in export-focused industries. Some sectors, like manufacturing, faced higher production costs. The Penn Wharton Budget Model estimated a net loss of 27,000 full-time jobs after the tariffs took effect.
Why did the stock market react so strongly to the new tariffs?
Investors saw the tariffs as a sign of rising uncertainty. They worried about lower profits and weaker global trade. The market responded with a rapid sell-off, causing major indices like the S&P 500 and Nasdaq to fall sharply.
Did the tariffs help reduce the federal deficit?
Note: Tariffs increased federal revenue by up to USD 4.5 trillion over ten years. However, the economic slowdown and lower growth offset much of this gain. The overall impact on the deficit remained limited.
What lessons can policymakers learn from the trump crash?
Policymakers should focus on clear, stable trade rules and strong institutions. Transparent policies help build trust and reduce uncertainty. International cooperation can protect economies from sudden shocks and market crashes.
Navigate tariff-driven market turbulence with BiyaPay! Sign up in just 1 minute to sidestep complex overseas account barriers, enabling rapid funding for global stock trades, such as US and Hong Kong markets, during volatile times like 2025. Our multi-asset wallet enables fee-free swaps of USDT and other digital currencies to USD and 30+ fiat currencies, with international transfers as low as 0.5%, keeping your brokerage account agile for market shifts. BiyaPay’s trusted platform boosts your trading resilience. Join now—visit BiyaPay to empower your investments!
*This article is provided for general information purposes and does not constitute legal, tax or other professional advice from BiyaPay or its subsidiaries and its affiliates, and it is not intended as a substitute for obtaining advice from a financial advisor or any other professional.
We make no representations, warranties or warranties, express or implied, as to the accuracy, completeness or timeliness of the contents of this publication.


Contact Us
Company and Team
BiyaPay Products
Customer Services


is a broker-dealer registered with the U.S. Securities and Exchange Commission (SEC) (No.: 802-127417), member of the Financial Industry Regulatory Authority (FINRA) (CRD: 325027), member of the Securities Investor Protection Corporation (SIPC), and regulated by FINRA and SEC.
registered with the US Financial Crimes Enforcement Network (FinCEN), as a Money Services Business (MSB), registration number: 31000218637349, and regulated by FinCEN.
registered as Financial Service Provider (FSP number: FSP1007221) in New Zealand, and is a member of the Financial Dispute Resolution Scheme, a New Zealand independent dispute resolution service provider.