- EasyCard
- Trade
- Help
- Announcement
- Academy
- SWIFT Code
- Iban Number
- Referral
- Customer Service
- Blog
- Creator
Latest on the Dow Jones Decline and What It Means for the Market


Image Source: pexels
The dow jones experienced a sharp decline as investors reacted to the latest Federal Reserve decision and heightened geopolitical tensions. On June 18, the dow closed lower, with notable volatility across the market. Technology and utilities sectors posted gains, while energy and communication sectors saw losses. Rising bond yields, with the 10-year Treasury yield reaching 4.39%, signaled caution. Many investors now ask, why did the dow drop today? Recent market snapshots highlight shifting sentiment and prompt renewed focus on why did the dow drop today, as the stock market faces increased uncertainty.
Key Takeaways
- The Dow Jones dropped sharply due to the Federal Reserve holding interest rates steady, rising bond yields, and increased geopolitical tensions.
- Technology and utilities sectors gained, while energy and communication sectors lost ground during the market decline.
- Rising inflation and global economic challenges continue to affect investor confidence and market performance.
- Investors use tools like the Fear and Greed Index and VIX to gauge market sentiment and manage risk during uncertain times.
- Despite recent drops, experts remain cautiously optimistic about the Dow’s long-term growth, with potential rate cuts and strong earnings supporting recovery.
Why Did the Dow Drop Today?

Image Source: pexels
The recent decline in the Dow Jones Industrial Average has raised concerns among investors and analysts. Several factors contributed to this sharp drop, including the Federal Reserve’s latest policy decision, ongoing geopolitical tensions, and technical signals from the market itself. Understanding why did the dow drop today helps investors make sense of the broader moves in u.s. equity markets and prepare for what may come next.
Fed Decision
The Federal Reserve’s decision to hold interest rates steady, without signaling an imminent rate cut, played a central role in the market’s reaction. Many investors had hoped for a more dovish stance, especially as inflation remains above the Fed’s target. The lack of a clear path to lower rates led to a wave of selling across stocks. Rising bond yields, with the 10-year Treasury yield climbing to 4.39%, added further pressure. This environment made borrowing more expensive and reduced the appeal of riskier assets like equities. As a result, stocks retreated, and the dow jones industrial average experienced one of its steepest declines this year.
Geopolitical Tensions
Geopolitical risks have also weighed heavily on the market. Recent events in the Middle East and ongoing tensions between the U.S. and China have increased uncertainty for global investors. The following table summarizes how major geopolitical risks have affected key assets:
| Geopolitical Risk | Key Affected Assets | Expected Price Impact Direction |
|---|---|---|
| Middle East regional war | Brent crude oil, VIX, U.S. high yield | Prices rise (oil, VIX), credit spreads widen |
| U.S.-China strategic competition | Taiwanese dollar, Taiwanese equities | Prices fall (equities, high yield), currency depreciation |
| Russia-NATO conflict | Russian equities, Russian ruble, Brent oil | Russian assets fall, oil prices rise |
| Major cyber attack(s) | U.S. high yield utilities, U.S. dollar | Mixed impacts, increased volatility |
| Emerging markets political crisis | Latin America consumer staples, Brazil debt | Emerging market assets weaken |
Short-term market performance often suffers during periods of heightened geopolitical risk. For example, an empirical study covering 37 countries from 1975 to 2019 found a significant negative relationship between geopolitical risk and stock market development. The effect is especially strong in North America and Europe. This helps explain why did the dow drop today, as investors responded to headlines about conflict and instability by moving out of stocks and into safer assets.
Dow Technicals
Technical indicators provided further warning signs for the dow jones industrial average. The index dropped 850 points in a single trading day, falling below the 42,000 level for the first time since November 2023. This move marked a fresh 8-week low and represented a 6.55% decrease from the recent swing high just above 45,000. The dow also pierced its Exponential Moving Average (EMA) below 42,000, ending a long period of outperformance relative to its long-term moving average.
Investors often watch these technical levels closely. When the index breaks below key averages, it can trigger additional selling as traders react to signals of weakness.
These numerical changes and technical breaches demonstrate a clear downward trend. Investor sentiment has shifted, with many now questioning the stability of the current rally. The combination of policy uncertainty, geopolitical risk, and technical breakdowns explains why did the dow drop today and why stocks across u.s. equity markets have faced renewed pressure.
Stock Market Reactions
Sector Moves
Different sectors showed varied performance during the recent decline in u.s. equity markets. Technology and utilities managed to post gains, while energy and communication sectors faced losses. The following table highlights how sectors and major indices performed relative to their moving averages. This data helps investors understand which areas of the market held up better during the sell-off.
| Sector / Index | 5-Day % Above MA | 20-Day % Above MA | 50-Day % Above MA | 100-Day % Above MA | 150-Day % Above MA | 200-Day % Above MA |
|---|---|---|---|---|---|---|
| S&P 500 Index | 32% | 44% | 63% | 50% | 47% | 45% |
| Consumer Discretionary | 33% | 39% | 59% | 41% | 37% | 37% |
| Consumer Staples | 24% | 26% | 32% | 37% | 42% | 37% |
| Energy | 43% | 83% | 91% | 70% | 52% | 48% |
| Financials | 53% | 44% | 67% | 49% | 42% | 48% |
| Health Care | 20% | 52% | 62% | 30% | 33% | 30% |
| Industrials | 16% | 29% | 73% | … | … | … |
| Russell 1000 Index | 36% | 46% | 66% | 50% | 44% | 43% |
| Russell 2000 Index | 37% | 47% | 62% | 44% | 35% | 34% |
| Russell 3000 Index | 36% | 46% | 64% | 47% | 38% | 38% |
| Dow Industrials | 37% | 47% | 57% | 50% | 60% | 57% |
| Nasdaq 100 | 26% | 47% | 70% | 62% | 63% | 61% |
| Nasdaq Composite | 36% | 46% | 63% | 50% | 45% | 45% |
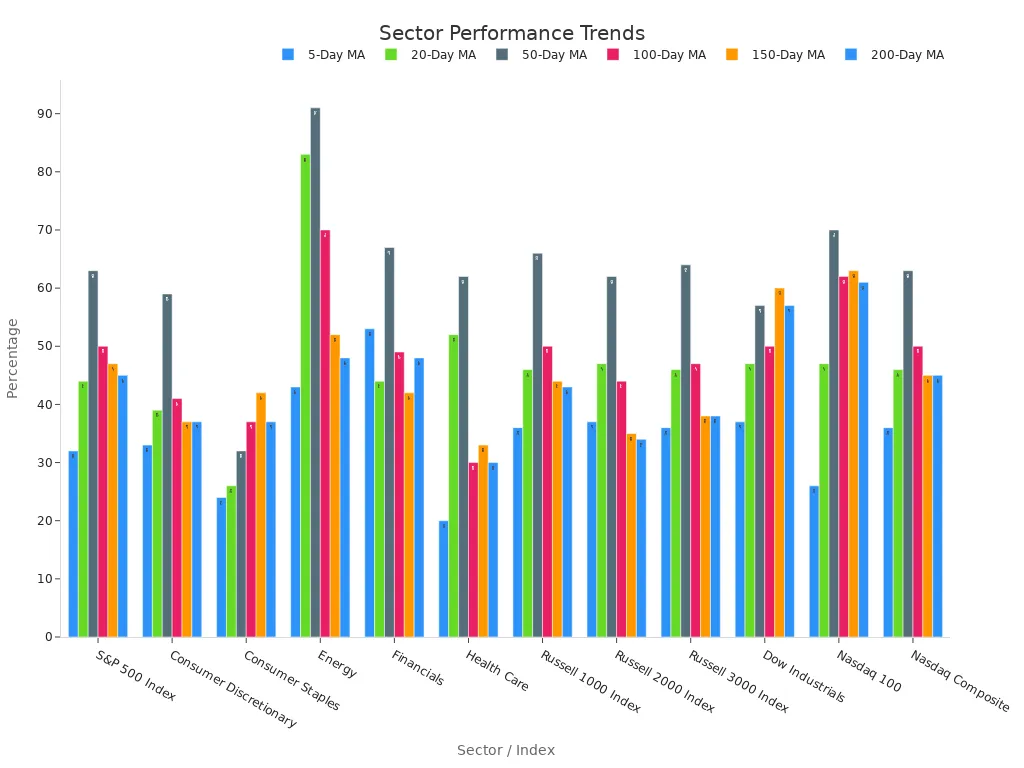
Performance across sectors often shifts quickly during periods of volatility. Investors saw energy stocks lose ground, while financials and technology showed mixed results. This pattern reflects how different parts of the market respond to changes in sentiment and economic signals.
Other Indices
The drop in the Dow did not happen in isolation. Other major indices also reacted strongly.
- All three major indexes—Dow, S&P 500, and Nasdaq—fell hard on the day.
- They finished near session lows.
- The Dow took the worst hit, dropping more than 800 points.
- The S&P 500 and Nasdaq also declined significantly, showing a broad market reaction.
Stocks across u.s. equity markets faced pressure as rising Treasury yields and weak auction results added to concerns. Market performance reflected a shift in investor sentiment, with many turning cautious. Social media trends showed increased discussion about volatility and risk. Many investors watched for signs of stability, but performance remained weak through the session.
Note: High volatility often signals uncertainty in u.s. equity markets. Investors should monitor both sector moves and index trends to understand overall market performance.
Economic Factors
Inflation
Inflation data continues to shape the market. Recent reports show excess inflation in both the United States and the Euro area. This trend has a negative correlation with returns in interest rate swaps and equity index futures. The following table summarizes key inflation measures and their impact on the market:
| Inflation Measure / Trend | Market Impact / Correlation | Direction & Significance | Markets / Regions | Frequency / Tenor |
|---|---|---|---|---|
| Excess inflation in G2 (US & Euro area) | Predictive correlation with IRS receiver returns | Negative, significant | Developed & Emerging Markets (except Switzerland, Japan) | Monthly, weekly, quarterly |
| Excess core PCE inflation (US) | Correlation with 5-year IRS bond returns | Negative, significant | US Treasury bonds | Weekly, monthly, quarterly |
| Inflation expectations | Impact on equity valuations and credit risk | Downward shift increases equity valuations and CDS risk | US markets | Long-term |
High inflation data often leads to reduced consumer spending trends. When prices rise, families spend less on goods and services. This change in spending affects the overall market and slows the economy.
Fed Policy
The Federal Reserve has made several policy changes to address inflation and support the economy.
- The Fed lowered the federal funds rate to near zero to encourage spending.
- Forward guidance helped set expectations for future rates, which influenced investor behavior.
- Quantitative easing involved large-scale purchases of Treasury and mortgage-backed securities, adding liquidity to the market.
- The Fed adjusted its bond purchases over time, including tapering in late 2021, which affected bond yields and market volatility.
The adoption of the ample reserves framework in January 2019 allowed the Fed to maintain stable control over policy rates. This approach reduced volatility in short-term funding markets and supported market stability during economic shocks.
Global Trends
Global economic trends also influence the market. US trade deficits remain a significant factor. Labor market conditions show both strength and signs of weakness. Inflation data in the Eurozone is declining, and the European Central Bank has started to cut rates. Japan faces demographic changes, such as record low birth rates, which impact its economy. Consumer spending trends, business investment, and supply chain pressures all play roles in shaping the market. These factors, combined with financial stability indicators, help explain recent market behavior.
Market Outlook
Image Source: unsplash
Investor Sentiment
Investor sentiment remains a key driver of market direction. Analysts track several indicators to gauge how investors feel about current conditions and what may come next. These tools help forecast shifts in market performance and highlight possible turning points.
- Fear and Greed Index: This index combines seven factors, such as volatility and momentum, to score the market from extreme fear to extreme greed. Extreme readings often signal a change in direction.
- VIX Volatility Index: Known as the “fear gauge,” the VIX measures expected volatility. High values suggest anxiety, while low values show calm. Spikes in the VIX often come before sharp moves in performance.
- Put-Call Ratio: This ratio tracks the volume of put options versus call options. High ratios point to bearish sentiment, while low ratios suggest optimism.
- AAII Sentiment Survey: This weekly poll shows how retail investors feel about the market. High bearish readings have often come before rallies.
- Commitment of Traders Report: This report details futures market positions by trader type, offering insight into large shifts in sentiment.
- Social Media Sentiment Metrics: Analysts also watch real-time trends on platforms like Twitter to spot sudden changes in investor mood.
Investors use these indicators to anticipate changes in market direction and to manage risk during periods of uncertainty.
What’s Next for the Dow
Forecasts for the Dow suggest a mix of caution and optimism. BlackRock’s analysis points to strong profit guidance and the potential for interest rates to peak soon. Historical data shows that election years often start with volatility but tend to improve after major political events. Since 1928, the Dow has averaged a 7.3% return in election years.
Mathematical models project the Dow could reach 50,000 points by 2030, based on earnings growth and long-term trends. Technical analysis highlights important support and resistance levels near 40,000 and 41,381 points. Many analysts expect the Federal Reserve to consider rate cuts later in 2024, which could boost market performance.
Price predictions for 2024 range from 34,000 to 45,000 points. Analysts look at macroeconomic factors, company earnings, and spending trends to shape their outlook. Investors should watch for changes in consumer spending and shifts in global economic conditions. These factors will likely influence both short-term and long-term performance.
Recent declines in the Dow reflect several key factors:
- The Dow fell 748 points in one day, with two-day losses over 1,200 points.
- Consumer sentiment dropped, and inflation expectations rose to 3.5%.
- Investors rotated into defensive sectors as the market weakened.
Investors should monitor leverage ratios, inventory turnover, and return on equity. Scenario analysis and diversification help manage risk. Staying alert to economic and geopolitical changes remains essential.
FAQ
What caused the Dow Jones to drop recently?
Several factors led to the decline. The Federal Reserve kept interest rates steady and did not signal cuts. Geopolitical tensions increased uncertainty. Technical indicators showed weakness. These combined to push the Dow Jones lower.
How did other stock indices react to the Dow’s decline?
The S&P 500 and Nasdaq also fell sharply. All major indices finished near session lows. Investors showed caution across the market, not just in the Dow Jones.
Which sectors performed best during the market drop?
Technology and utilities sectors posted gains. Energy and communication sectors saw losses. Investors often move to defensive sectors like utilities during uncertain times.
Should investors make changes to their portfolios now?
Analysts recommend reviewing risk levels and maintaining diversification. Investors should avoid panic selling. Monitoring economic data and global events helps guide decisions.
How do rising bond yields affect the stock market?
Higher bond yields make borrowing more expensive. They reduce the appeal of stocks compared to bonds. This shift can lead to lower stock prices as investors seek safer returns.
As the Dow Jones faces volatility from Fed policies and global tensions, efficient cost management and flexible fund allocation are crucial for investors. BiyaPay simplifies your investment journey with its multi-asset wallet, offering free conversions between USDT and over 200 cryptocurrencies into fiat currencies like USD or HKD. This eliminates expensive exchange fees, enabling you to swiftly adjust your portfolio across sectors like technology or utilities. With remittance fees as low as 0.5%, BiyaPay ensures cost-effective transfers, even in turbulent markets. Its secure platform and one-minute registration process provide the reliability you need to navigate uncertainty. Ready to stay agile in today’s market? Sign up with BiyaPay now and manage your investments with confidence.
*This article is provided for general information purposes and does not constitute legal, tax or other professional advice from BiyaPay or its subsidiaries and its affiliates, and it is not intended as a substitute for obtaining advice from a financial advisor or any other professional.
We make no representations, warranties or warranties, express or implied, as to the accuracy, completeness or timeliness of the contents of this publication.


Contact Us
Company and Team
BiyaPay Products
Customer Services


is a broker-dealer registered with the U.S. Securities and Exchange Commission (SEC) (No.: 802-127417), member of the Financial Industry Regulatory Authority (FINRA) (CRD: 325027), member of the Securities Investor Protection Corporation (SIPC), and regulated by FINRA and SEC.
registered with the US Financial Crimes Enforcement Network (FinCEN), as a Money Services Business (MSB), registration number: 31000218637349, and regulated by FinCEN.
registered as Financial Service Provider (FSP number: FSP1007221) in New Zealand, and is a member of the Financial Dispute Resolution Scheme, a New Zealand independent dispute resolution service provider.