- EasyCard
- Trade
- Help
- Announcement
- Academy
- SWIFT Code
- Iban Number
- Referral
- Customer Service
- Blog
- Creator
Latest Stock Market Updates as Stocks Slide


Image Source: unsplash
Stocks going down have captured attention across the financial world today. The stock market shows sharp declines, with major indexes reflecting increased volatility and investor caution. The IMF’s April 2025 Global Financial Stability Report highlights rising risks, such as high valuations and elevated leverage, which weigh on stocks. Reliable stock market news and detailed financial reports, including Form 10-Ks, help investors track the latest market updates and understand market health. News about stocks going down often signals deeper trends within the stock market. Investors rely on accurate news to make informed decisions as they navigate these changes.
Key Takeaways
- Stocks are falling due to Federal Reserve rate decisions, inflation worries, and global tensions like conflicts and trade issues.
- Technology and utilities sectors face the biggest losses as investors shift to safer assets like gold and the Japanese yen.
- Investors use real-time data and financial news to track market changes and make smarter decisions during volatile times.
- Economic indicators such as jobless claims and retail sales help investors understand market health and plan ahead.
- A cautious, long-term investment strategy with diversification helps reduce risk during uncertain market conditions.
Why Stocks Going Down

Image Source: unsplash
Key Drivers
Several factors have contributed to stocks going down in the current trading session. The Fed’s recent interest rate decision has played a central role. Investors expected a more dovish stance, but the Fed signaled caution due to persistent inflation risks. This stance has led to uncertainty across the stock market.
Geopolitical tensions have also weighed heavily on u.s. equity markets. The ongoing conflict between Israel and Iran, along with strained relations between the U.S. and China, has increased volatility. Oil prices have surged by up to 13%, and gas prices have climbed 5%, reflecting concerns about supply disruptions. Brent crude volatility has reached its highest level since 2022. These developments have pushed investors toward safe-haven assets like gold and the Japanese yen.
Stagflation concerns have resurfaced as economic data shows mixed signals. Continuing unemployment claims have risen to 1.956 million, the highest since November 2021, pointing to labor market weakness. However, the US Consumer Price Index (CPI) and Producer Price Index (PPI) for May came in lower than expected, suggesting that inflation pressures may be easing. The US dollar index has dropped to its lowest level since 2022, as markets recalibrate expectations for two possible Fed rate cuts by year-end.
Note:
Financial authorities highlight that the U.S. Treasury yield curve signals a high recession risk, but this signal appears distorted due to unusual inflation normalization since 2023. Economic momentum is split, with strong national private demand but weakening state-level activity. Corporate profit margins remain resilient, and private sector debt service ratios are low, reducing the risk of a debt-driven recession. Market recession odds have decreased since early 2023, showing that recession fears are not the main reason for stocks going down. Instead, central bank rate hikes and inflation concerns, especially around fiscal and trade policy, have triggered the current decline.
Market Reaction
The stock market has responded with sharp declines across major indexes. The Dow has dropped over 500 points, marking its third consecutive day of losses. The S&P has fallen by 1.7%, while the Nasdaq has slid 2.1%. Technology and utilities sectors have seen the steepest declines, as investors rotate out of growth stocks and into defensive assets.
- Investor sentiment indexes, built from trading volume, put-call ratios, and advance-decline ratios, show a clear rise in bearish sentiment.
- The VIX fear index has surged above 20, signaling heightened anxiety and volatility.
- Empirical studies using models like GARCH and statistical tests such as ARCH-LM confirm that bearish sentiment leads to lower returns and increased volatility.
- Both individual and institutional investors have reacted differently, but overall, the market has seen a move toward risk aversion.
U.S. equity markets have also seen a shift in trading patterns. Investors have increased allocations to safe-haven assets, including gold, the Japanese yen, and the Swiss franc. The number of IPOs has slowed, and market turnover has risen, reflecting caution. Despite these moves, corporate profit margins remain strong, which may limit the downside for stocks in the medium term.
The Fed’s monetary policy and interest rate decision continue to drive market expectations. Leading indicators like the Beige Book, CPI, and PPI provide forward-looking insights that shape investor sentiment. As the stock market digests these signals, volatility remains elevated, and stocks going down has become a key theme for traders and long-term investors alike.
Stock Market News
Index Performance
A market snapshot shows that the stock market faced significant pressure today. The dow, s&p, and nasdaq all posted losses as investors reacted to new economic data and global events. These indices serve as benchmarks for the u.s. equity markets, reflecting the broader health of the economy. According to recent financial reports, the dow dropped over 500 points, while the s&p fell by 1.7%. The nasdaq declined by 2.1%, led by weakness in technology and utilities.
| Indicator | Period | Value | % Change |
|---|---|---|---|
| AAII Stock Fund Allocation | May 2025 | 34.70% | -2.25% |
| US Investor Sentiment, % Bullish | Week of Jun 12 2025 | 36.67% | +12.28% |
| CME S&P 500 Short Positions | Week of Jun 10 2025 | 2.807M | N/A |
| Fama-French Monthly Market Return | Apr 2025 | -0.84 | N/A |
| NAAIM Exposure Index Number | Week of Jun 11 2025 | 82.66 | +1.27% |
| S&P 500 Earnings Per Share | Q4 2024 | 57.69 USD | +10.96% |
| S&P 500 P/E Ratio | Q4 2024 | 27.99 | -2.74% |
These numbers highlight the volatility in the stock market and shifts in investor sentiment. The dow’s decline signals caution, while the s&p and nasdaq reflect sector-specific pressures.
Notable Movers
Several stocks stood out in today’s trading session due to unusual volume and price changes. Market news identified these movers by comparing current trading volume to average levels and tracking real-time updates.
- Technology stocks experienced sharp declines, with some hitting new 52-week lows.
- Utilities lagged as investors rotated into safer assets.
- Energy stocks saw mixed results, influenced by oil price spikes from geopolitical risk.
- Volume spikes often followed company earnings reports or analyst rating changes.
- Real-time data flagged top gainers and losers every 30 minutes, helping traders spot momentum shifts.
Investors use technical indicators like moving averages and RSI to confirm trends in notable stocks. High volume often signals strong buying or selling interest, especially after major news or economic events.
Stock market news continues to monitor these trends, providing updates that help investors navigate the fast-changing environment in the u.s. equity markets.
Main Factors
Fed Policy
The fed plays a major role in shaping stock market trends. Its decisions on monetary policy, such as setting the federal funds rate, influence borrowing costs and investment returns. As of June 2025, the inflation rate remains just above 2%, and the unemployment rate stays low. The fed keeps its target range for interest rates between 4.25% and 4.5%. Most market futures expect no immediate changes. The fed’s approach relies on hard economic data, including jobless claims and retail sales, before making policy adjustments. The New York fed uses an ample reserves system to stabilize short-term rates, which helps reduce market swings. The table below summarizes recent fed policy data:
| Indicator/Measure | Numerical Data/Projection | Description/Context |
|---|---|---|
| Federal Funds Rate | 4.5% (steady as of March 2025) | Rate held steady after previous reductions from 5.5% to 4.5% |
| Core Consumer Price Inflation (YoY) | 2.6% in January 2025 (down from 3.1% in January 2024) | Inflation moderating toward Fed’s 2% target |
| Quantitative Tightening Cap | Reduced from $25 billion to $5 billion monthly (April 2025) | Slowing pace of Treasury redemptions to ease tightening |
| Economic Growth Outlook | Slower growth projected for 2025 | Reflects impact of tariffs and policy shifts |
The fed’s actions affect consumer spending trends and retail activity, as higher rates can slow borrowing and reduce retail sales.
Geopolitics
Geopolitical events often cause sudden changes in the stock market. Conflicts and tensions, such as those between Israel and Iran or the U.S. and China, increase uncertainty for investors. Research shows that events like the Russia-Ukraine war led to a 50% drop in Russian market value in one day. The VIX index, which measures market fear, rises during these times. Investors often move money into safe assets like gold or the Japanese yen. The chart below shows how major geopolitical events have affected markets:
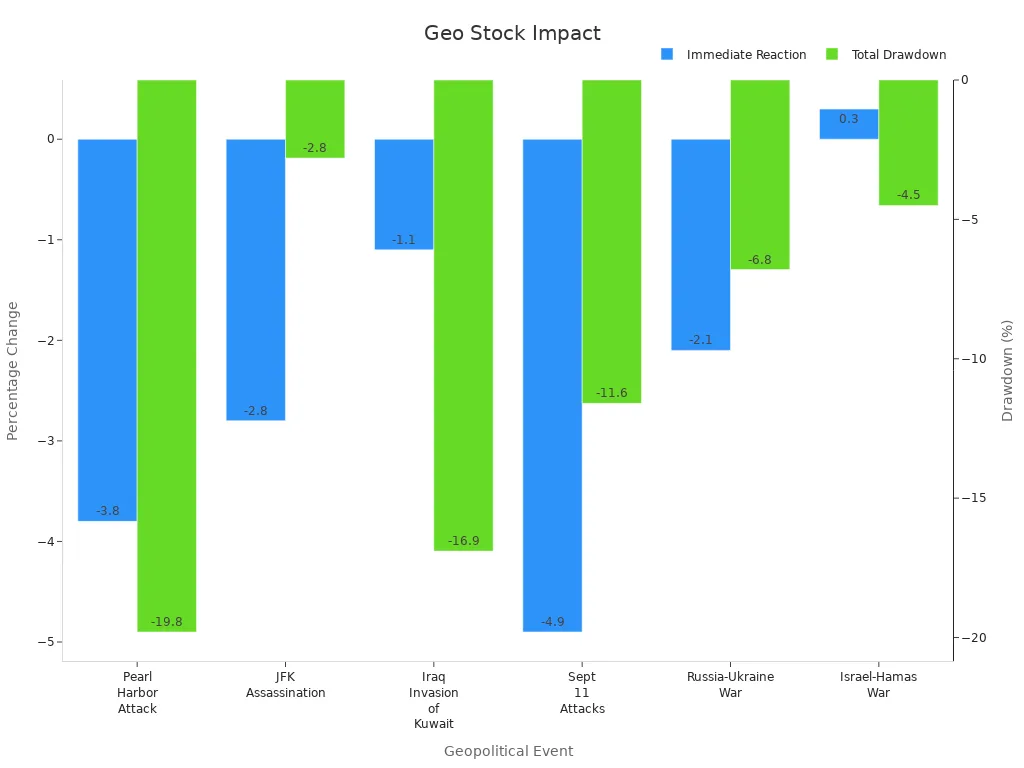
Geopolitical risks also impact retail and consumer spending trends. When uncertainty rises, people may cut back on retail purchases, which can lower retail sales. Investors can manage risk by diversifying across sectors and using hedging strategies.
Economic Data
Economic data provides key signals for the stock market. Analysts use leading indicators, such as retail sales, manufacturing orders, and consumer sentiment, to predict future trends. Coincident indicators, like GDP growth and industrial production, show the current state of the economy. Lagging indicators, such as jobless claims and inflation, confirm trends after they happen. Financial institutions that use real-time economic data can reduce earnings volatility and improve performance. For example, banks that monitor retail sales and other indicators closely have seen a 26% drop in earnings swings during economic cycles. Investment products based on strong economic analysis have outperformed benchmarks by 3.8% per year over the past decade. This shows the value of tracking retail sales and other data to understand market direction.
Latest Market Updates

Image Source: pexels
Sector Highlights
The stock market has seen the biggest impact in the technology and utilities sectors. Technology stocks have dropped as investors worry about slower growth and higher costs. Utilities have also faced pressure, but they show signs of transformation. Many utilities now focus on intelligent optimization, better customer experience, and predictive maintenance. Companies invest in digital twin technologies, which help reduce unplanned stoppages by 20%. Major utilities like Duke Energy and National Grid use these tools to improve operations.
- AI and GenAI adoption is rising in utilities.
- Mergers and acquisitions in transmission and distribution increased 21% year-over-year.
- Utilities use creative financing, such as partnerships and asset sales, to support growth.
- Despite a 3% decline in deal volume in early 2024, capital investment outlook for 2025 remains strong.
- Funding for digital twin technologies reached over USD 1.2 billion in two years.
Retail sales trends also affect these sectors. When retail sales slow, technology and utilities often see less demand for new projects. Retail companies watch the stock market closely to plan their investments and manage risk.
| Statistic / Trend | Detail |
|---|---|
| Electrical digital twin market growth | CAGR of 16.13% (2024-2030) |
| Projected market size by 2030 | USD 4,836.51 million |
| Monthly cost savings from digital twin | EUR 3.03 million (offshore oil rig) |
Stock Market Sentiment
Investor sentiment in the stock market remains cautious. Many investors feel skeptical about short-term gains and prefer a long-term strategy. Sentiment analysis uses news, tweets, blogs, and forums to measure public mood. Social media platforms like Twitter and Reddit show mixed opinions about stocks. Financial reports and company earnings calls also shape how investors feel.
- Sentiment data comes from social media, financial news, and company websites.
- Economic indicators, such as retail sales and employment rates, influence market mood.
- Advanced AI models help analyze large amounts of sentiment data quickly.
- Firms like BlackRock use sentiment analysis to guide investment decisions.
Retail investors pay close attention to real-time data feeds. These feeds include order books, trade volumes, and price quotes from exchanges like NYSE. Real-time analysis helps investors react to changes in retail sales and stock prices. Staying updated with live data allows both retail and institutional investors to manage risk during volatile periods in the stock market.
| Market Segment | Feed Name | Description Summary |
|---|---|---|
| NYSE Equities | Integrated Feed | Order-by-order view of trades and orders |
| BBO | Real-time top of book quotes | |
| Trades | Real-time last sale data | |
| Order Imbalances | Real-time buy/sell imbalance data | |
| Multiple Markets | NYSE Pillar Depth | Top 10 bid and offer price points across exchanges |
| NYSE BQT | Consolidated best bid/offer and trades for all NYSE exchanges |
Real-time data and analysis are essential for navigating volatility in the stock market. Investors who track retail sales and sector trends can make better decisions and protect their portfolios.
The stock market decline stems from central bank policy, inflation risks, and global tensions. Investors should watch economic data, including jobless claims, and sector trends for signals. Experts recommend a cautious, long-term strategy. Reliable news and real-time analysis help investors make informed choices.
1. Accurate data supports sound investment analysis.
2. Financial reviews examine revenue and cost-saving opportunities.
3. Long-term planning uses forecasts and risk assessments to build strong strategies.
FAQ
What caused the recent stock market decline?
Multiple factors led to the decline. The Federal Reserve’s interest rate decision, inflation risks, and geopolitical tensions between Israel, Iran, the United States, and China all played a role. Investors reacted by moving money into safer assets.
Which sectors faced the biggest impact?
Technology and utilities experienced the largest drops. Investors worried about slower growth and higher costs in these sectors. Energy stocks showed mixed results due to oil price changes.
How do investors use real-time data?
Investors track real-time data feeds for prices, trading volumes, and order imbalances. This information helps them make quick decisions and manage risk during volatile periods.
What strategies help during market volatility?
Long-term investing and diversification help reduce risk. Investors often review financial news, monitor economic data, and avoid making emotional decisions during market swings.
Why do geopolitical events affect stock prices?
Geopolitical events create uncertainty. Investors fear disruptions in trade or supply chains. They often move money into safe assets like gold or the Japanese yen when tensions rise.
As stocks slide amid Fed policies and global uncertainties, managing costs and maintaining flexibility are key to navigating volatile markets. BiyaPay empowers investors with its multi-asset wallet, offering free conversions between USDT and over 200 cryptocurrencies into fiat currencies like USD or HKD. This eliminates costly exchange fees, allowing you to reallocate funds swiftly to safer assets like gold or diversified sectors. With remittance fees as low as 0.5%, BiyaPay ensures efficient capital movement, even during turbulent times. Its secure platform and one-minute registration process provide the reliability needed to act fast. Stay ahead of market shifts—join BiyaPay today and manage your investments with ease and confidence.
*This article is provided for general information purposes and does not constitute legal, tax or other professional advice from BiyaPay or its subsidiaries and its affiliates, and it is not intended as a substitute for obtaining advice from a financial advisor or any other professional.
We make no representations, warranties or warranties, express or implied, as to the accuracy, completeness or timeliness of the contents of this publication.


Contact Us
Company and Team
BiyaPay Products
Customer Services


is a broker-dealer registered with the U.S. Securities and Exchange Commission (SEC) (No.: 802-127417), member of the Financial Industry Regulatory Authority (FINRA) (CRD: 325027), member of the Securities Investor Protection Corporation (SIPC), and regulated by FINRA and SEC.
registered with the US Financial Crimes Enforcement Network (FinCEN), as a Money Services Business (MSB), registration number: 31000218637349, and regulated by FinCEN.
registered as Financial Service Provider (FSP number: FSP1007221) in New Zealand, and is a member of the Financial Dispute Resolution Scheme, a New Zealand independent dispute resolution service provider.