- EasyCard
- Trade
- Help
- Announcement
- Academy
- SWIFT Code
- Iban Number
- Referral
- Customer Service
- Blog
- Creator
Market Collapse Explained with Definition and Common Indicators


Image Source: unsplash
A market collapse occurs when asset prices fall sharply across a financial market, causing widespread loss of value. A stock market crash represents a sudden, dramatic drop in stock prices within a short period. Research shows that market collapse disrupts investor behavior and increases uncertainty, as seen in historical data from global markets. During a collapse, bubbles burst and investor sentiment shifts, often resulting in rapid changes in market participation. Statistical studies confirm that market collapse prediction remains challenging because price deviations and investor psychology play major roles.
Key Takeaways
- A market collapse means asset prices fall sharply across many sectors, causing big losses and economic disruption.
- Key warning signs include sudden price drops, rising unemployment, inverted yield curves, and increased market volatility.
- Historical crashes like 1929 and 2008 show that high valuation ratios often precede major market declines.
- Panic selling and investor fear can worsen a collapse, creating a cycle of falling prices and lost confidence.
- Staying calm, reviewing your portfolio regularly, and seeking professional advice help protect investments during downturns.
Definition
What Is a Market Collapse?
A market collapse describes a situation where asset prices fall sharply across a financial market. This event causes a sudden loss of value for investors and can disrupt the entire economy. Unlike regular market fluctuations, a collapse involves rapid and severe declines that affect most sectors at once.
Several numerical indicators help distinguish a market collapse from normal market movements:
- Elevated NCSKEW and DUVOL values signal higher risk by showing increased volatility and asymmetry in returns.
- Potential Tipping Points Indicators (PTPIs) become volatile before and during a collapse, serving as early warning signals.
- Increased correlations among stocks and volatility spikes in PTPIs often appear right before a collapse.
- Empirical studies show that PTPI volatility rises as a market approaches a tipping point, providing predictive power.
Note: Complexity theory suggests that as stocks interact more closely, the risk of a collapse increases. This pattern helps experts identify when a market is moving from normal fluctuations to a full-scale collapse.
Statistical measures such as standard deviation, maximum drawdown, and implied volatility also help quantify the severity of a market collapse. Standard deviation measures how much returns move away from their average, while maximum drawdown shows the largest loss from peak to trough. These tools allow analysts to track and compare the intensity of different collapses.
Stock Market Crash Explained
A stock market crash is a specific type of market collapse. It refers to a sudden, dramatic drop in stock prices over a short period. Crashes often happen without much warning and can erase years of gains in days or weeks.
Historical data shows that certain valuation thresholds often precede a stock market crash. For example, when the S&P 500 Shiller P/E ratio rises above 30, significant declines tend to follow. The table below highlights major periods when this threshold was crossed and the resulting market declines:
| Period | Event Description | Shiller P/E Threshold | Market Decline (%) | Indexes Affected |
|---|---|---|---|---|
| Aug-Sep 1929 | Preceding the Great Depression | >30 | 89% | Dow Jones |
| Jun 1997 - Aug 2001 | Dot-com bubble peak and burst | 44.19 (peak in 1999) | 49% (S&P 500), 78% (Nasdaq) | S&P 500, Nasdaq Composite |
| Sep 2017 - Nov 2018 | Market correction in Q4 2018 | >30 | ~20% | S&P 500 |
| Dec 2019 - Feb 2020 | COVID-19 crash onset | >30 | 33% | S&P 500 |
| Aug 2020 - May 2022 | 2022 bear market | ~40 (Jan 2022) | N/A | N/A |
| Nov 2023 - Present | Current period with Shiller P/E above 30 | >30 | N/A | N/A |
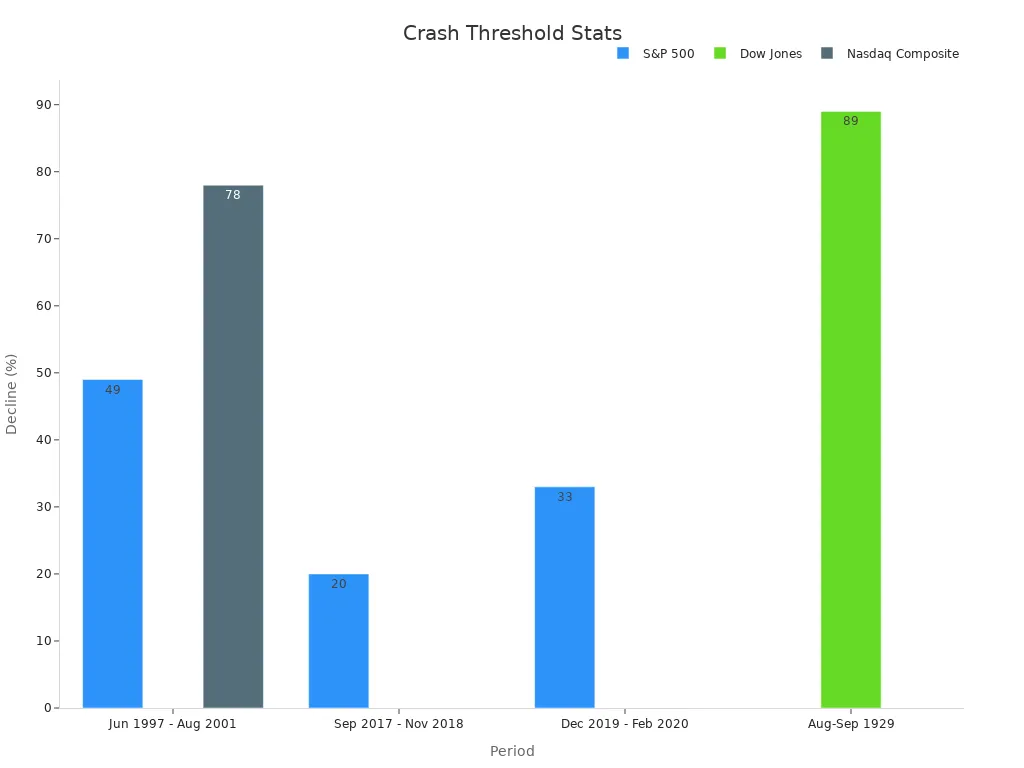
Every time the S&P 500 Shiller P/E ratio has crossed above 30 since 1871, the market has experienced significant declines, ranging from 20% to 89%. This pattern does not predict the exact timing of a stock market crash, but it serves as a consistent warning sign.
Other valuation metrics, such as the price-to-book (P/B) ratio, also provide insight. For instance, the S&P 500’s P/B ratio reached 5.30 in late 2024, surpassing previous peaks before major corrections. When these ratios become extended, a sizable correction often follows.
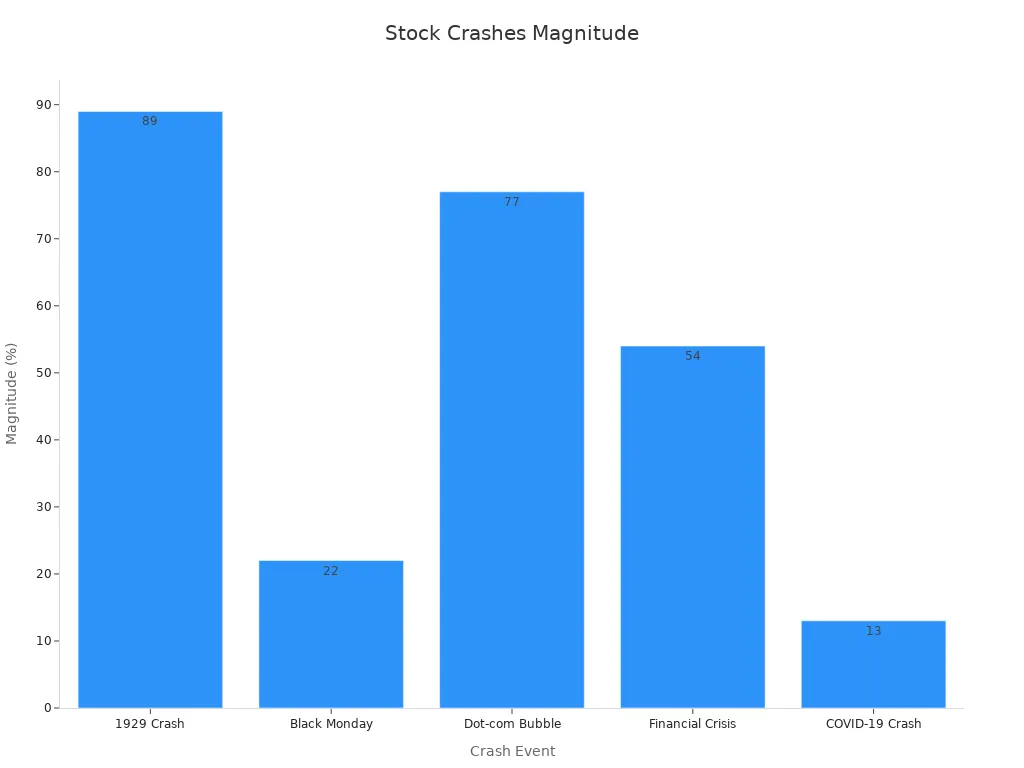
The table below summarizes the magnitude, speed, and recovery duration of major stock market crashes:
| Market Collapse | Magnitude of Decline | Speed of Decline | Recovery Duration |
|---|---|---|---|
| Black Monday (1987) | 22.6% drop in a single day | Largest one-day percentage drop | Market recovered within 2 years |
| Dot-com Bubble (2000-2002) | NASDAQ lost over 80% over 2 years | Gradual decline after peak in 2000 | Aftereffects lasted several years |
| Global Financial Crisis (2008-2009) | Dow Jones fell over 50% from peak to trough | Decline over ~1.5 years | Recovery took several years |
| COVID-19 Pandemic (2020) | S&P 500 dropped over 30% in weeks | Fastest entry into bear market in history | Sharp rebound due to stimulus |
| Japanese Asset Bubble (1989-1992) | Nikkei dropped over 80% by 1992 | Burst over 3 years | Led to a decade-long stagnation |
| Oil Crisis (1973) | Dow Jones fell over 45% | Decline over months | Economic impact prolonged |
A stock market crash can devastate investor portfolios and shake public confidence. The speed and depth of these events set them apart from ordinary corrections. By tracking valuation metrics and volatility indicators, investors and analysts can better understand the warning signs of a potential crash.
Indicators

Image Source: pexels
Sudden Price Drops
A sudden price drop stands as one of the most visible signs of a market collapse. When stock prices fall sharply—often by 10% or more within days—investors and analysts take notice. These sharp declines can trigger a chain reaction, leading to further losses and a rapid market decline. In many cases, a drop of 20% or more from a recent peak signals a bear market, which often coincides with a financial crisis.
Several key indicators help identify these critical moments:
- Yield curve inversion: Short-term bond yields rise above long-term yields, signaling a slowdown in the economy.
- Rising unemployment: A sustained increase in unemployment rates often appears before a market collapse.
- Declining consumer confidence: Drops in consumer sentiment and spending can signal trouble ahead.
- Tightening credit conditions: Widening credit spreads and cautious lending practices restrict growth.
- Significant and sustained market downturns: Extended periods of falling prices often precede recessions.
The Hindenburg Omen, a technical indicator, sometimes signals potential market tops and corrections. It looks for a specific percentage of stocks hitting new highs and lows on the same day, combined with negative market breadth. While not perfect, clusters of these signals have predicted sharp market declines in the past.
Panic Selling
Panic selling describes a situation where investors rush to sell their assets out of fear, often ignoring the underlying value of their holdings. This behavior can quickly turn a normal correction into a full-blown financial panic. During panic-selling, trading volumes surge as investors try to exit positions at any price. High trading volume, combined with sudden volatility, often marks the peak of panic trading.
Market data shows that during intraday crashes, high-frequency traders withdraw from the market, causing liquidity to dry up. For example, on June 24, 2016, during the Brexit announcement, aggressive trading and high order cancellations led to extreme volatility. The quote-to-trade ratio spiked, and prices moved rapidly as panic trading took hold.
The sequence of a market bubble often follows a predictable path:
- Displacement: A new technology or event attracts attention.
- Boom: Prices rise as more investors join in.
- Euphoria: Asset prices soar, and caution fades.
- Profit-taking: Savvy investors begin to sell.
- Panic: Widespread panic selling and panic trading cause prices to collapse.
Loss of investor confidence fuels panic-selling. As more investors panic sell, prices drop further, creating a feedback loop. Public panic spreads quickly, and investor confidence erodes, making recovery difficult. Panic trading can overwhelm normal market mechanisms, leading to a rapid market decline.
Economic Warning Signs
Economic warning signs often appear before or during a market collapse. High unemployment and rising inflation signal stress in the economy. For example, during the 1970s and early 1980s, the United Kingdom saw unemployment peak near 12% as policymakers tried to control inflation. This combination of high inflation and unemployment often signals a financial crisis.
Historical data confirms that spikes in unemployment rates coincide with major market collapse events:
| Period | Economic Event | Approximate Unemployment Rate (%) |
|---|---|---|
| 1930s | The Great Depression | 20–25 |
| 1970s | Oil Crisis & Stagflation | 6–9 |
| Early 1980s | Recessions | 7–10 |
| 2008-2009 | Global Financial Crisis | 8–10 |
| 2020 (COVID-19) | Pandemic-led labor shifts | 14 (peak) |
Not every rise in unemployment leads to a recession, but when combined with other signals—such as GDP contraction and rising layoffs—the risk of a market collapse increases. High inflation, especially when paired with high unemployment, creates a negative environment for growth and investor confidence.
Analysts also watch for tightening credit conditions, falling consumer spending, and declining GDP. These factors, when seen together, often point to a weakening economy and a higher risk of financial panic. A loss of investor confidence can quickly turn these warning signs into a full-scale market decline.
Stock Market Crash History

Image Source: pexels
Major Crashes
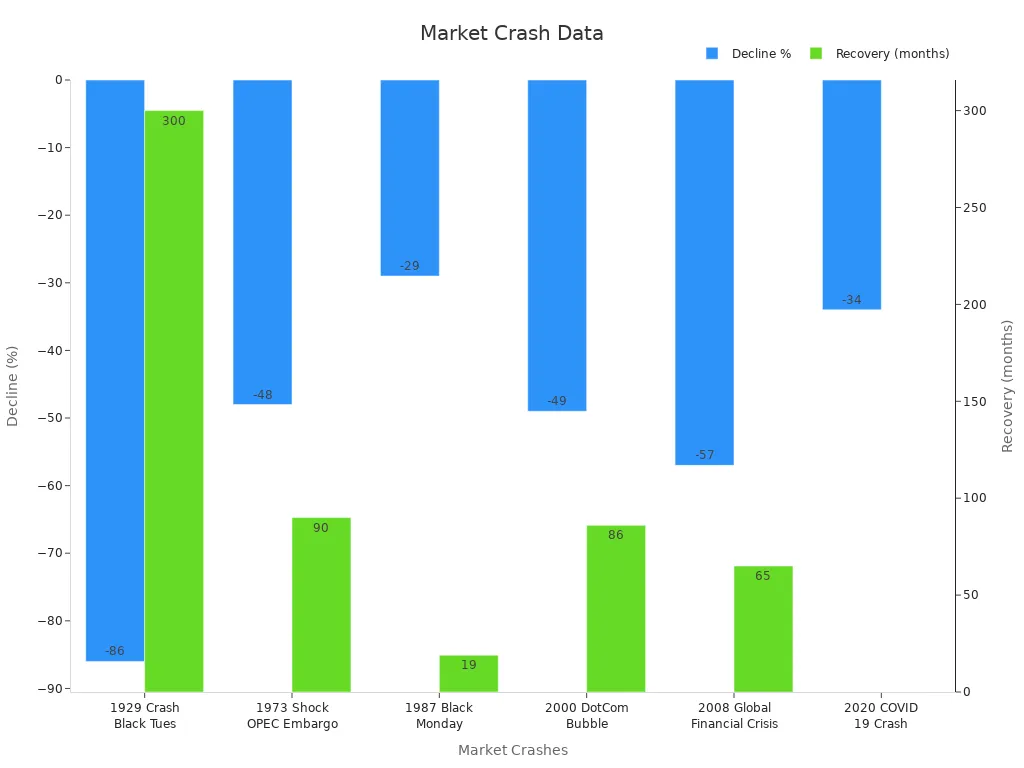
Historical stock market crashes have shaped the financial world and left lasting effects on economies. The 1929 great depression crash began with massive daily drops, including a 12.82% decline on October 28 and an 11.73% drop on October 29. The Dow Jones Industrial Average lost about 89.2% over less than three years. The market did not recover to its 1929 peak until 1954. The black monday crash in 1987 saw a 22.6% drop in a single day, with a total decline of 29%. The dot-com crash from 2000 to 2002 erased nearly half the value of the S&P 500 and over 75% from the Nasdaq. The 2008 stock market crash, known as the great recession, resulted in a 57% drop and a slow recovery over 65 months.
| Market Crash | Decline Percentage | Recovery Duration |
|---|---|---|
| 1929 Great Crash (Black Tuesday) | -86% | Approximately 25 years (7,256 days / 300 months) |
| 2008 Global Financial Crisis | -57% | About 65 months (1,379 days) |
| 1973 Nixon Shock / OPEC Oil Embargo | -48% | 90 months (1,899 days) |
| 1987 Black Monday | -29% | 19 months (402 days) |
| 2000 Dot Com Bubble | -49% | 86 months (1,808 days) |
| 2020 COVID-19 Crash | -34% | 5+ months (117+ days, ongoing) |
Lessons Learned
Each stock market crash has delivered important lessons. The 1929 crash led to the great depression, causing significant losses and a severe drop in public confidence. The 2008 great recession exposed weaknesses in credit systems and income distribution. Structural break analysis and power law models show that aftershocks and recovery times vary by event. The COVID-19 crash recovered faster than 2008, reflecting different market dynamics.
Statistical studies reveal that firms with higher risk lost more value during crashes. Liquidity and debt ratios played key roles, especially in 2008 when credit dried up. Behavioral factors like fear and herd behavior increased volatility and deepened losses. Historical stock market crashes have shown a significant impact on the economy, changing income distribution, credit conditions, and investor behavior. Policymakers and investors now monitor warning signs more closely to avoid repeating past mistakes.
Causes
Economic Factors
Economic factors play a central role in triggering a market collapse. When the economy slows, key indicators such as rising unemployment and falling output signal trouble. During the Great Recession, the collapse of Lehman Brothers and the bursting of the housing bubble led to a severe financial crisis. Credit became scarce, and households reduced spending. Unemployment rates more than doubled, causing a long-lasting increase in joblessness. This economic disturbance reduced both the quantity and quality of labor output, which lowered overall production. These patterns show how downturns can have deep and lasting effects, often leading to a full-blown economic crisis.
A review of major market crashes highlights the impact of multiple economic factors:
| Market Crash Event | Economic Factors Involved | Quantitative Impact / Description |
|---|---|---|
| Great Depression Crash (1929) | Speculative bubbles, panic buying, overvaluation | Share prices skyrocketed then collapsed, leading to widespread bankruptcies |
| Black Monday (1987) | Computer trading, derivatives, overvaluation, illiquidity, trade and budget deficits | Major U.S. market indexes declined by at least 30% |
| Dot-com Crash (2000-2001) | Speculative trading in technology stocks, overvaluation | Collapse of technology stock prices after speculative IPOs and capital burn |
| Stock Market Crash (2007/08) | Collapse of mortgage-backed securities, speculative trading | Triggered Great Recession; financial institutions bankruptcies due to housing price decline and debt defaults |
| COVID Crash (March 2020) | Pandemic impact on multiple sectors, government reaction | Rapid market collapse with soaring unemployment rates |
Speculation and Bubbles
Speculation often drives asset prices far above their true value. When a speculative bubble forms, traders influence each other, creating a bandwagon effect. This phase can last for months or years. Eventually, a sudden shift in investor attitudes causes the bubble to burst. The Japanese stock market between 1987 and 1992 provides a clear example. Strong bandwagon effects and changes in the investment environment led to rapid price increases, followed by a sharp crash. This pattern matches the typical sequence of market downturns: boom, euphoria, and then collapse. Speculative bubbles often end with panic selling and a swift drop in prices.
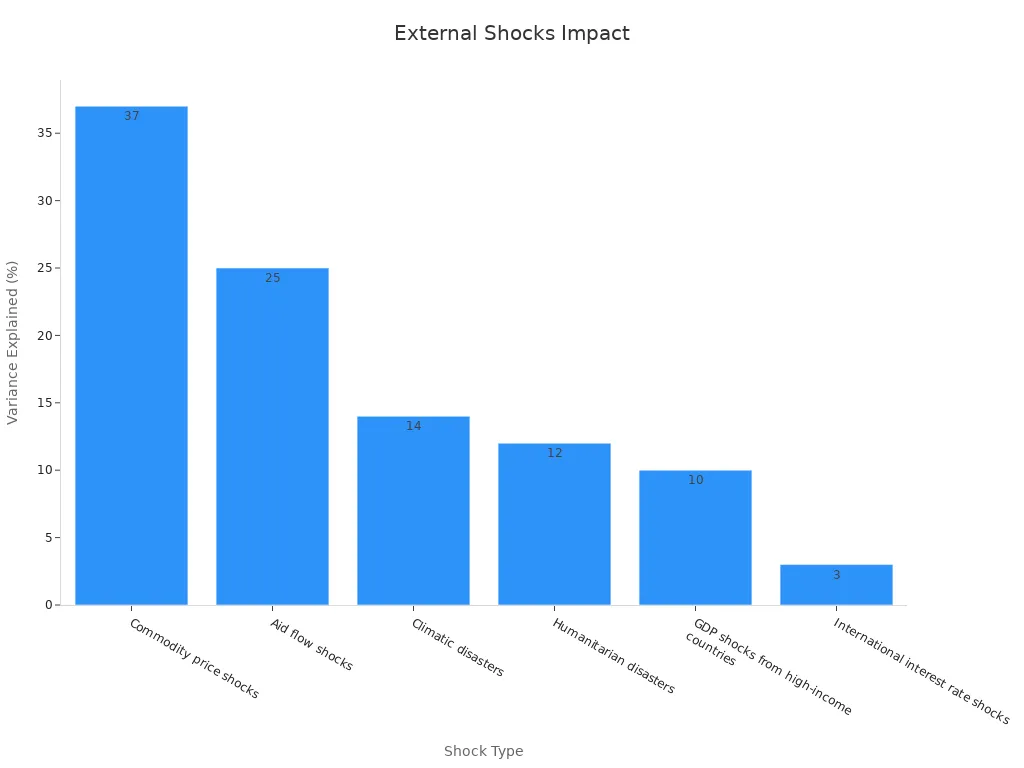
External Shocks
External shocks can destabilize markets quickly. These shocks include commodity price swings, aid flow changes, natural disasters, and global interest rate shifts. In emerging markets, external shocks have explained up to 11% of the variance in real per capita GDP. For example, commodity price shocks can increase GDP by 1% per standard deviation, while humanitarian disasters can cause a 4% decline. The 2008 Global Financial Crisis showed how international economic shocks can ripple through economies, causing widespread instability. Over time, some countries have become more resilient by adopting countercyclical monetary policies.
Economic shocks, whether internal or external, often act as the final trigger for a financial crisis. When combined with speculation and weak economic factors, these shocks can turn a vulnerable market into a collapse.
Market Collapse Prediction
Warning Signs
Market collapse prediction relies on identifying early warning signs that often appear before a major downturn. Analysts monitor several key indicators to spot trouble ahead:
- Heightened volatility and abnormal trading volumes signal increased uncertainty.
- Diverging asset correlations and changes in market liquidity measures can point to instability.
- Credit spreads and leverage ratios often widen before a collapse.
- Inflation trends, especially when rising quickly, influence central bank decisions and can stress markets.
- A drop of 20% or more in stock prices from recent peaks signals possible recession conditions.
- An inverted yield curve, where short-term bond yields exceed long-term yields, has predicted past recessions.
- High unemployment rates and decreases in real GDP reflect economic contraction.
Mathematical models support market collapse prediction by using differential equations, agent-based modeling, time series analysis, and machine learning algorithms. These models help analysts track feedback loops, chain reactions, and shifts in investor sentiment. Behavioral economics also plays a role, as herd behavior and sudden changes in confidence can trigger rapid declines.
Limitations of Prediction
Despite advances in modeling, market collapse prediction faces serious challenges. No model can guarantee precise timing or magnitude of a crash. The table below highlights some key limitations:
| Evidence Type | Description |
|---|---|
| Historical Failures | Models failed during the 2008 crisis; rating agencies misjudged risk, leading to widespread defaults. |
| Model Limitations | Most models use past data, which may not reflect future market conditions or human behavior. |
| Unknown Unknowns | Unforeseen variables can disrupt predictions, reducing model reliability. |
| Notable Example | Long Term Capital Management’s advanced models failed, requiring intervention to prevent a market meltdown. |
| Difficulty Predicting Rarity | Extreme crashes are rare, making accurate prediction difficult. |
| Variable Predictive Power | No single indicator consistently predicts crashes; effectiveness changes over time. |
Advanced models, such as alarm indices and Bayesian analysis, attempt to improve market collapse prediction. However, markets often enter unstable phases where even small events can trigger a collapse. The complexity of financial systems and the role of collective behavior make exact prediction nearly impossible. Analysts continue to refine their tools, but uncertainty remains a core challenge.
What to Do
Stay Calm
Market downturns can create fear and uncertainty. Investors often feel pressure to react quickly. However, staying calm helps prevent rash decisions. Emotional reactions, such as panic selling, can lock in losses and damage long-term returns. Investors who remain calm are more likely to make rational choices and avoid the cycle of fear that leads to a loss of investor confidence. Remember, markets have recovered from downturns in the past.
Tip: Take a step back and review your investment goals before making any changes.
Portfolio Review
A regular portfolio review helps investors manage risk during volatile periods. Reviewing asset allocation ensures that investments match risk tolerance and financial goals. Studies show that diversified portfolios, which include stocks, bonds, and alternative assets, tend to perform better during downturns than portfolios focused only on stocks. Adaptive withdrawal strategies and balanced asset mixes improve the chances of sustaining investments through market volatility. Financial professionals recommend periodic reassessment and adjustments to maintain a healthy balance.
Key steps for a portfolio review:
- Check current asset allocation.
- Rebalance if one asset class has grown too large.
- Consider adding bonds or alternative investments for stability.
- Avoid making large changes based on short-term market moves.
A disciplined approach to portfolio review can help investors recover faster and reduce losses.
Seek Advice
Professional guidance can provide clarity during uncertain times. Financial advisors offer personalized strategies based on individual needs and market conditions. They help investors avoid common mistakes and stay focused on long-term goals. Seeking advice also helps restore investor confidence after a sharp decline. Many advisors use historical data and proven strategies to guide clients through market downturns.
Note: Investors should choose advisors with experience in managing risk and navigating market cycles.
Understanding a market collapse or stock market crash helps investors recognize warning signs and make informed decisions. Historical data shows that events like the 1929 crash and the 2008 financial crisis caused major losses but also led to important changes in market rules and investor behavior.
| Market Collapse Event | Impact Highlights | Aftermath / Significance |
|---|---|---|
| 1929 Stock Market Crash | Massive market plunge, global trade collapse | Led to Great Depression, bank failures |
| Black Monday (1987) | Largest one-day percentage decline | Prompted circuit breakers, quick market rebound |
| 2008 Financial Crisis | Global stock crashes, credit freezes | Global recession, new regulations |
Practical steps, such as diversification and staying invested, have helped investors recover after downturns. Circuit breakers and other tools now reduce panic and volatility. Research confirms that financial literacy and planning lower stress and improve long-term stability. Staying informed and proactive supports better financial outcomes.
FAQ
What is the difference between a market collapse and a correction?
A market collapse involves a rapid, severe drop in asset prices across markets. A correction refers to a smaller decline, usually around 10%, that often signals a healthy adjustment rather than a crisis.
How can investors protect their portfolios during a market collapse?
Investors can diversify assets, review risk tolerance, and avoid panic selling. Professional advice from financial advisors helps create strategies for volatile periods. Regular portfolio reviews also support better decision-making.
What role does investor psychology play in market collapses?
Investor psychology drives fear and herd behavior. When panic spreads, many sell at once, causing prices to fall faster. Behavioral factors often turn a downturn into a full-scale collapse.
Can anyone predict a market collapse with certainty?
No one can predict a market collapse with certainty. Analysts use indicators and models, but unexpected events and complex market behavior make exact timing impossible.
Which economic indicators signal a possible market collapse?
Key indicators include rising unemployment, high inflation, inverted yield curves, and falling consumer confidence. Analysts also watch for tightening credit conditions and sharp drops in GDP.
Navigating a market collapse requires strategic cost management and quick access to diversified assets. BiyaPay supports investors with its multi-asset wallet, enabling free conversions between USDT and over 200 cryptocurrencies into fiat currencies like USD or HKD. This eliminates costly exchange fees, allowing seamless portfolio adjustments during volatile periods. With remittance fees as low as 0.5%, BiyaPay ensures efficient fund transfers, helping you rebalance or move to safer assets like bonds without delay. Its secure platform and one-minute registration offer the reliability needed to act decisively. Protect your investments in uncertain times—sign up with BiyaPay today and take control of your financial strategy with confidence.
*This article is provided for general information purposes and does not constitute legal, tax or other professional advice from BiyaPay or its subsidiaries and its affiliates, and it is not intended as a substitute for obtaining advice from a financial advisor or any other professional.
We make no representations, warranties or warranties, express or implied, as to the accuracy, completeness or timeliness of the contents of this publication.


Contact Us
Company and Team
BiyaPay Products
Customer Services


is a broker-dealer registered with the U.S. Securities and Exchange Commission (SEC) (No.: 802-127417), member of the Financial Industry Regulatory Authority (FINRA) (CRD: 325027), member of the Securities Investor Protection Corporation (SIPC), and regulated by FINRA and SEC.
registered with the US Financial Crimes Enforcement Network (FinCEN), as a Money Services Business (MSB), registration number: 31000218637349, and regulated by FinCEN.
registered as Financial Service Provider (FSP number: FSP1007221) in New Zealand, and is a member of the Financial Dispute Resolution Scheme, a New Zealand independent dispute resolution service provider.