- EasyCard
- Trade
- Help
- Announcement
- Academy
- SWIFT Code
- Iban Number
- Referral
- Customer Service
- Blog
- Creator
Navigating Share Market Turbulence as Global Events Unfold


Image Source: pexels
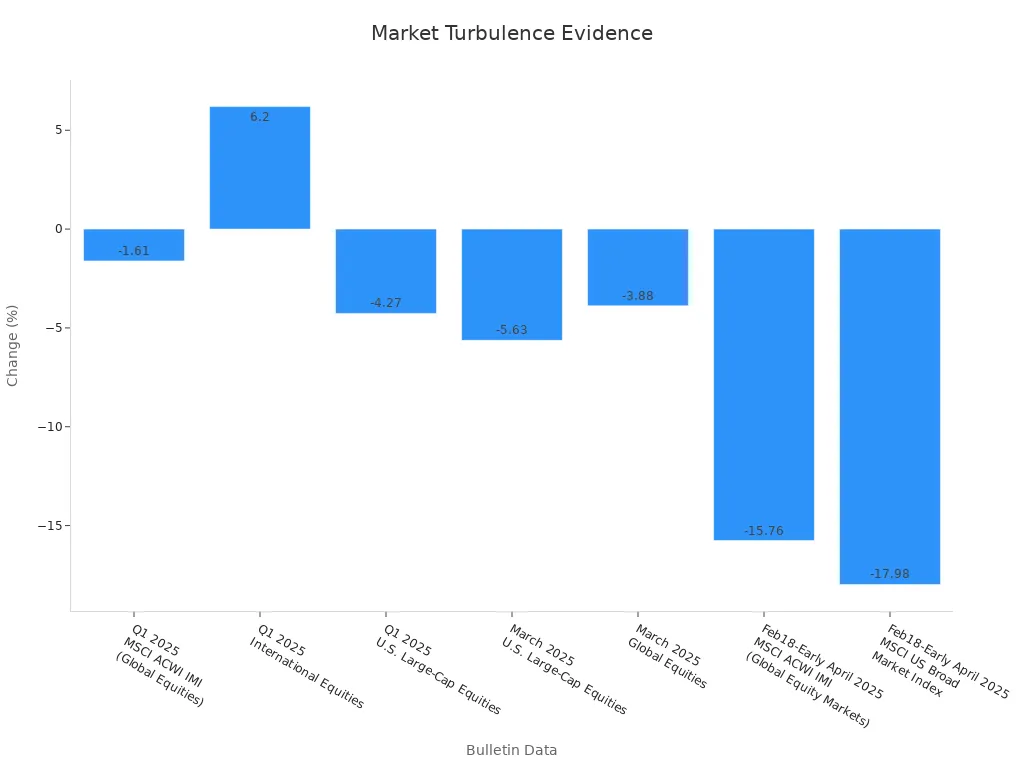
Global events have shaken investors across every region. The share market crash today began in April 2025, when new tariffs and geopolitical unrest caused the largest global selloff since 2020. Investors in the United States, Europe, and Asia saw sharp market declines, with the S&P 500 correcting over 10% and Japan’s Nikkei 225 losing 7% in a single day.
| Region/Market | Date(s) | Key Event or Statistic |
|---|---|---|
| United States | April 2, 2025 | Largest global decline since 2020 crash |
| Canada (TSX) | April 3-4 | Dropped 3.8% and 4.6%; 7-month low |
| Japan (Nikkei 225) | April 6-7 | Lost 7% in one day; third-largest daily point loss |
| Australia (S&P/ASX 200) | April 7 | Dropped 6% within 30 minutes |
| Europe (STOXX 600) | April 3-7 | Worst week in 5 years; 8.4% loss |
Investors now face global uncertainty as policy changes, inflation, and shifting central bank strategies drive market volatility. Many investors diversify investments, seek safe-haven assets, and monitor global trends. Uncertainty remains high, so investors must take practical steps to manage risk and find opportunities in an unpredictable investment landscape.
Key Takeaways
- Global events like new tariffs and geopolitical tensions triggered a major share market crash in 2025, causing sharp declines across the US, Europe, and Asia.
- Economic slowdowns, inflation, and changing central bank policies are driving market volatility and uncertainty worldwide.
- Diversifying investments across sectors and regions helps reduce risk and supports recovery during market turbulence.
- Investors should monitor central bank actions, inflation trends, and geopolitical developments to make informed decisions.
- Staying informed and using risk management strategies empower investors to protect assets and find opportunities in uncertain markets.
Share Market Crash Today

Image Source: pexels
Causes of the 2025 Crash
The share market crash today began with a series of global shocks that affected investors in every region. New US tariffs on imports from China and other countries triggered immediate disruptions in global trade. These tariffs led to a 25% drop in container bookings from China to the US. Major US ports, such as Seattle, saw vessel arrivals fall from two ships daily to only two ships in a week. Shipping traffic shifted to European ports like Antwerp and Rotterdam, which faced five to six times their normal volume. Nearly 28% of global commercial vessels have connections to China, so tariffs targeting these ships created further dislocation in trade flows. Experts noted that port infrastructure could not adapt quickly, which made the economic impact worse.
Geopolitical unrest added to the uncertainty. Tensions in Eastern Europe and the South China Sea increased risk for investors. Many investors moved their money into defensive assets such as gold, which caused sharp declines in stocks and cryptocurrencies. The global nature of these events meant that investors in the US, Europe, and Asia all faced the same risks at the same time.
Macroeconomic events also played a role. The first quarter of 2025 saw a 2.2% annualized contraction in US GDP. This level of contraction has matched past recessions, such as the Great Recession in 2008-2009 and the COVID-19 recession in 2020. Each time GDP fell by more than 2% in a quarter, the stock market experienced a major crash. The table below shows how these contractions have lined up with past market declines:
| Period | Annualized GDP Contraction | Context | S&P 500 Decline |
|---|---|---|---|
| 2008-2009 | 2.1% (Q3 2008), 8.5% (Q4 2008), 4.5% (Q1 2009) | Financial Crisis / Great Recession | 57% |
| 2020 | 5.5% (Q1 2020), 28.5% (Q2 2020) | COVID-19 Recession | 34% |
| 2025 (Q1) | 2.2% (estimated) | Current GDP contraction aligning with past recessions | Market correction ongoing, potential for further decline |
Trade policy changes, especially new tariffs, have a history of causing economic slowdowns and market downturns. In 2025, these policies reduced investor confidence and increased volatility in global stocks. Investors responded by pulling money out of riskier assets, which made the share market crash today even more severe.
Immediate Market Reactions
The scale of the selloff during the share market crash today shocked investors worldwide. Major indices like the S&P 500 dropped over 10% in a matter of days. Japan’s Nikkei 225 lost 7% in a single session. The STOXX 600 in Europe suffered its worst week in five years, falling 8.4%. Stocks in Australia and Canada also saw steep declines. Investors reacted quickly, moving funds into safe-haven assets and reducing exposure to stocks.
Investor sentiment turned sharply negative. Studies show that after a crash, negative sentiment increases volatility and leads to more selling. In the Indian stock market, statistical models like GARCH (1,1) reveal that volatility remains high after a crash and takes time to return to normal. When investors feel uncertain, they often withdraw from the market, which causes further drops in stocks and increases volatility. Bearish sentiment leads to lower returns, while even bullish sentiment can cause short-term spikes in volatility.
Note: Market updates from sources like Investors.com and Schwab provide ongoing news about stock market movements, Federal Reserve statements, and economic indicators. However, these updates do not offer a complete analysis of the causes behind the share market crash today. They highlight general trends, policy changes, and investor sentiment, but lack a focused explanation for the crash.
The global nature of the crash meant that investors everywhere faced similar risks. Many investors diversified their portfolios, sought out defensive sectors, and paid close attention to global news. The share market crash today showed how quickly global events can change the outlook for stocks and force investors to adapt their strategies.
Global Market Outlook
Image Source: pexels
Economic Growth Trends
The global market outlook for 2025 reflects a period of slower economic growth and persistent uncertainty. Leading economic reports show that the global economy faces headwinds from trade tensions, inflation, and policy shifts. EY-Parthenon’s Global Economic Outlook (January 2025) projects global GDP growth at about 3.1% for the year. However, this average masks significant differences across regions:
- Advanced economies expect modest growth near 1.8%. The United States leads among these, but its growth rate is slowing.
- Emerging markets anticipate stronger growth, averaging 4.1%. China’s growth slows to 4.5%, while India’s economy expands rapidly at 6.4%.
- Global inflation continues to decline but remains above pre-pandemic levels. Risks from trade protectionism and geopolitical tensions persist.
- Monetary policy diverges across regions, reflecting different economic conditions and inflation dynamics.
The IMF’s World Economic Outlook (April 2025) revises global growth projections downward. The report highlights intensified downside risks, including historically high tariff rates and unpredictable policy environments. Inflation is expected to fall, but at a slower pace than previously forecasted.
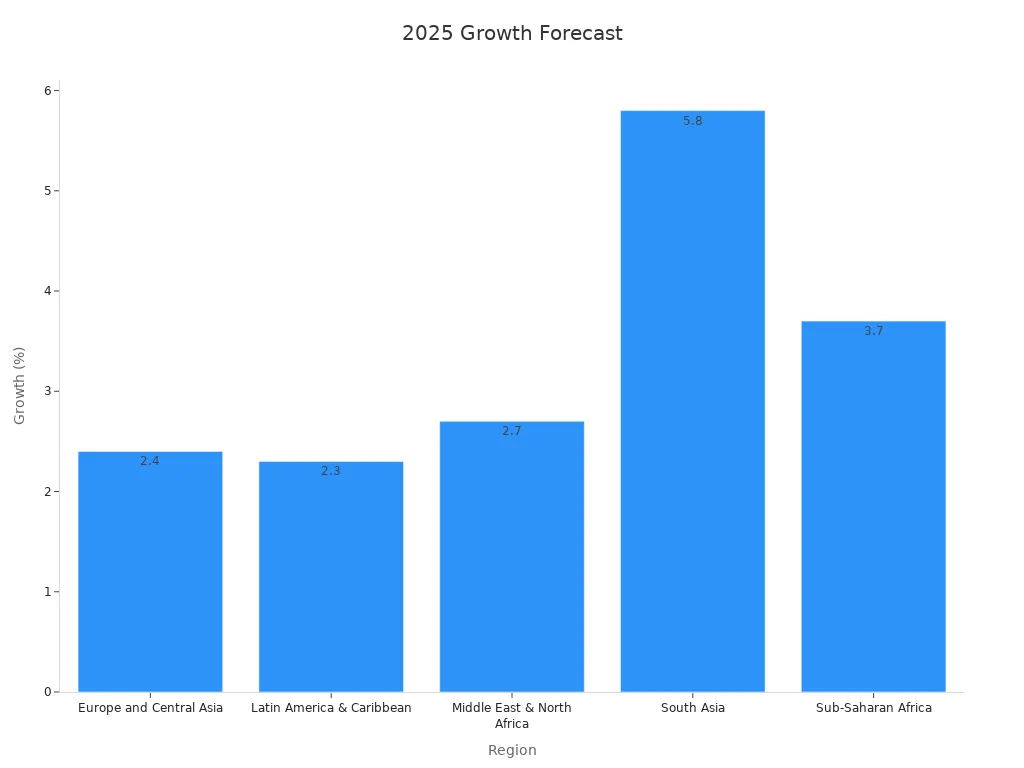
The World Bank’s Global Economic Prospects (June 2025) also signals a slowdown. The report estimates global growth at 2.3% in 2025, the weakest pace since 2008 outside of a recession. Nearly 70% of economies have seen their growth forecasts cut due to trade tensions and policy uncertainty. Developing economies face challenges from slower investment growth and persistent inflation pressures.
| Region | 2025 Growth Forecast | Notes on Trends and Risks |
|---|---|---|
| Europe and Central Asia | 2.4% | Growth slowing before slight recovery in 2026-27 |
| Latin America & Caribbean | 2.3% | Steady growth expected, mild strengthening later |
| Middle East & North Africa | 2.7% | Growth rising, strengthening further in 2026-27 |
| South Asia | 5.8% | Growth moderating but remains strong |
| Sub-Saharan Africa | 3.7% | Growth expected to edge up |
The United States, a key driver of the global economy, shows signs of slowing. The BEA’s advance estimate for Q1 2025 reports a 0.3% annualized contraction in real GDP. This contraction results mainly from increased imports and decreased government spending. However, private demand remains strong, with real final sales to private domestic purchasers rising by 3.0%. The following table summarizes the projected changes in major GDP components:
| GDP Component | 2024 Growth Rate | 2025 Projected Growth Rate |
|---|---|---|
| Real GDP Growth | 2.8% | 1.4% |
| Consumer Spending (PCE) | 2.8% | 2.3% |
| Business Spending | 4.0% | 1.6% |
| Exports | 3.3% | 2.0% |
| Imports | 5.3% | 3.3% |
| Government Spending | 3.4% | 1.9% |
This data confirms a broad slowdown in economic growth across all major sectors. The risk of a US recession remains a concern, but underlying private demand offers some resilience. The global market outlook suggests that most regions will experience moderate growth, with emerging markets leading the way.
Note: The global market outlook for 2025 highlights the importance of monitoring inflation, trade policy, and regional economic trends. Investors should pay close attention to these factors when considering the equity market outlook and stock market forecast.
Central Bank Policy Effects
Central banks play a critical role in shaping the global market outlook. Their decisions on interest rates and monetary policy directly impact economic growth, inflation, and financial market direction. The Federal Reserve and other major central banks have become more responsive to inflation and labor market data since 2024. Financial markets now react quickly to central bank statements and policy changes.
| Transmission Channel | Description | Impact on Market Direction and Economy |
|---|---|---|
| Interest Rate Channel | Central bank rate hikes increase borrowing costs, reducing consumer and business spending. | Lower demand leads to reduced inflation and slower economic growth, influencing market prices and investment decisions. |
| Balance Sheet Channel | Higher rates reduce net worth of businesses and individuals, tightening credit access. | Spending and price pressures decrease, dampening economic activity and market momentum. |
| Bank Lending Channel | Increased rates reduce bank profitability, making banks less willing to lend. | Credit availability tightens, slowing economic expansion and affecting market liquidity. |
| Exchange Rate Channel | Higher interest rates attract foreign capital, causing currency appreciation. | Exports become more expensive, imports cheaper, leading to GDP contraction and shifts in trade-sensitive markets. |
| Inflation Expectations | Rate hikes signal commitment to controlling inflation, influencing wage and price contracts. | Lower expected inflation stabilizes prices, affecting long-term market valuations and investment strategies. |
| Unconventional Policies | When rates hit near zero, central banks use quantitative and credit easing to inject liquidity. | These policies influence market interest rates and credit conditions beyond traditional rate adjustments. |
The Federal Reserve influences short-term market interest rates by adjusting the interest on reserve balances. This action sets a floor for the federal funds rate, guiding borrowing costs and investment decisions. When the Fed raises rates, borrowing becomes more expensive, which slows economic growth and reduces inflation. Lower rates encourage spending and investment, supporting economic recovery.
Investors should note that central bank communication and responsiveness shape financial market expectations. Bond market participants now pay close attention to labor market news, as employment data has become as important as inflation in guiding policy. This shift affects both equity and bond markets.
Emerging market central banks have also adapted their frameworks. They now focus more on risk management and scenario analysis, rather than relying solely on central forecasts. These banks must respond quickly to inflation pressures to prevent entrenched inflation. However, monetary policy transmission remains weaker in emerging markets compared to advanced economies. Global financial conditions and reliance on external financing can limit the effectiveness of domestic rate cuts.
- Strengthening central bank independence and governance builds credibility and public confidence.
- Policy actions and communication influence bond yields and the transmission of monetary policy through financial markets.
- When emerging market central banks loosen policy, global financial tightening can offset domestic efforts, reducing policy effectiveness.
The global market outlook for 2025 depends heavily on how central banks manage inflation and economic growth. Investors should monitor central bank decisions, as these will shape the direction of the global economy and influence the equity market outlook.
Stock Market Leadership
Sector Rotation
Sector rotation describes how leadership in the stock market shifts between different industries during periods of volatility. Investors often move their investment focus from one sector to another as economic conditions change. For example, when the global economy slows, defensive sectors like healthcare and consumer staples often outperform. During periods of strong growth, technology and consumer discretionary stocks may lead.
IBISWorld Industry Reports help investors understand these shifts. These reports analyze industry performance, volatility, and life cycle phases. They also provide SWOT analyses and outlooks, which highlight threats and opportunities. This information supports strategic investment decisions during market turbulence. Investor’s Business Daily tracks market trends and uses indicators like the CBOE Market Volatility Index to show which sectors lead or lag. Edward Jones’ Weekly Market Wrap notes that in early 2025, financials and healthcare showed resilience. The report suggests that volatility can create opportunities to buy quality stocks at lower prices. Investors who monitor sector rotation can adjust their portfolios to capture growth and manage risk.
International vs. US Stocks
Investors compare international stocks with US stocks to find the best opportunities during global market swings. Studies by Vanguard show that holding 20% to 50% of a portfolio in international stocks can reduce volatility over time. This approach helps balance risk, especially when US stock performance becomes unstable. International stocks often trade at a discount compared to US stocks, which may offer better value during periods of US market volatility.
Fidelity highlights that international stocks, especially those in emerging markets, can be more volatile due to political and economic risks. However, the sector composition differs. US markets focus on technology and growth, while international markets have more value sectors like energy and financials. This difference can help investors diversify their investment strategies. Charles Schwab’s outlook points out that international stocks have shown strength even as US stocks faced challenges. The table below compares key aspects:
| Aspect | Details |
|---|---|
| Correlation Trends | Emerging markets’ correlation with US stocks dropped from 0.82 (2021) to 0.16 (2023) |
| Volatility Comparison | US market 10-year standard deviation: 15.5; Global index with international stocks: 15.0 |
| Sector Composition | US: 29% technology; International: more energy, materials, financials |
Investors who diversify across global markets can capture growth from different regions and reduce overall risk. Monitoring stock performance in both US and international markets helps investors make informed investment choices.
Key Risk Factors
Tariffs and Trade Policy
Tariffs and trade policy changes have become a major source of economic policy uncertainty in the global trade backdrop. Policymakers often use tariffs to protect domestic industries, raise revenue, or open foreign markets. However, these goals can conflict. Economic models show that tariffs may benefit consumers only if trading partners do not retaliate. In reality, most countries respond with their own tariffs, which reduces the positive impact. Recent studies show that tariffs raise prices for imported goods in the United States. Businesses pass these costs to consumers, leading to higher prices and lower demand. Surveys reveal that over 30% of firms now list trade and tariffs as their top concern. Tariff-related uncertainty has caused a decline in business confidence and investment sentiment. Historical data from 2018–2019 shows that import prices rose almost one-for-one with tariffs, and domestic consumers bore most of the burden. Free trade agreements have reduced global tariff rates, but recent backlash has increased protectionist measures. These shifts create volatility in global markets and affect investor decisions.
- Tariffs increase costs for consumers and businesses.
- Trade policy uncertainty reduces investment and slows economic growth.
- Retaliatory tariffs can lower both U.S. and global GDP.
Inflation and Interest Rates
Inflation remains a central risk for investors in 2025. Key inflation reports show the annual inflation rate in the United States reached 2.3% in April 2025, the lowest since 2021. In May, inflation ticked up to 2.4% as food and transportation prices rose, even as energy costs fell. Projections suggest inflation will stay near 2.4% to 2.5% in the near term. The Federal Reserve closely monitors these trends and adjusts interest rates to manage inflationary pressures. When inflation rises, the Fed may increase rates, making borrowing more expensive and slowing economic activity. If inflation falls, the Fed may lower rates to encourage spending. The inflationary effect of rising prices can erode purchasing power and reduce consumer confidence. Investors watch inflation and interest rates because they influence stock and bond prices. Persistent inflationary trends can lead to higher interest rates, which often result in lower equity valuations. The global market outlook depends on how central banks respond to inflationary risks and maintain stability.
Geopolitical Unrest
Geopolitical unrest poses a significant threat to global markets. Conflicts such as the Russia-Ukraine war and tensions in the South China Sea have increased volatility and uncertainty. Studies show that geopolitical events can cause sharp declines in local stock markets, as seen when the Russian market index dropped over 50% in one day. These events also increase policy uncertainty and undermine investor confidence. Investors often react by moving assets into safe havens like gold. Geopolitical risks can disrupt supply chains, affect trade flows, and change government spending priorities. Surveys indicate that 34% of investors now view geopolitical risk as their top concern, ahead of recession or interest rate worries. While large cap equities may recover quickly, smaller markets and sectors can experience lasting damage. The rise of BRICS+ countries and shifting alliances add new layers of complexity to the global market environment. Investors must monitor geopolitical developments and adjust their strategies to manage risk in an uncertain world.
Strategies for Investors
Diversification
Investors can manage risk by spreading investments across different asset classes, sectors, and regions. Diversification reduces the impact of a single asset’s poor performance on the overall portfolio. Studies from Abacus Wealth and Fidelity show that diversified portfolios withstand shocks better than concentrated ones. For example, during the 2008 financial crisis and the COVID-19 pandemic, diversified portfolios lost less value and recovered faster. Investors should include a mix of stocks, bonds, and cash. They can also diversify by company size, industry, and geography. Regular portfolio reviews help maintain effective diversification, especially during periods of high inflation and market volatility.
Diversification does not remove all risks, but it helps investors avoid large losses and supports long-term investment discipline.
Risk Management
A strong risk management framework helps investors protect assets during downturns. Enterprise Risk Management (ERM) frameworks, such as ISO 31000 and COSO, guide investors through risk identification, assessment, treatment, and monitoring. Investors use tools like scenario analysis, stress testing, and Value at Risk (VaR) to measure potential losses. They can reduce risk by hedging with options or spreading investments across sectors. Regulatory frameworks, such as Basel III, require banks like Hong Kong banks to maintain capital buffers, which increases resilience during crises. Investors who follow these steps can respond quickly to inflation shocks and sudden drops in stocks.
Tax Planning
Tax planning allows investors to keep more of their investment returns, especially in volatile markets. Strategies include tax smoothing, scenario planning, and regular reviews of tax laws. Investors can use tax-advantaged accounts and harvest losses to offset gains. Even small reductions in tax rates can increase after-tax earnings and support portfolio growth. Internal controls and technology help investors stay compliant with changing regulations. Case studies from Scandinavia and East Asia show that adaptive tax planning stabilizes revenue and manages fiscal risks, even when inflation rises.
Staying Informed
Investors who stay informed about global events and market shifts make better decisions. Real-time financial data from sources like Bloomberg, CNBC, and Reuters provides updates on stocks, inflation, and economic indicators. Investors can use watchlists and alerts to track important assets. Quick access to news helps investors react to changes, manage risk, and find new investment opportunities. Platforms that use machine learning, such as Daloopa, improve data accuracy and speed. Staying informed supports strategic planning and helps investors adapt to inflation, policy changes, and market volatility.
Investors must adapt their strategies as global events and market volatility continue to reshape the investment landscape. Studies show that proactive engagement, such as increased investor relations activities, helps manage risk and reduces the chance of negative outcomes. Experts forecast that climate risks and rapid changes in technology will require even greater resilience and forward-thinking approaches.
- Investors should diversify portfolios, monitor emerging markets, and stay informed about technology and sustainability trends.
- Data-driven decision-making and continuous research support better risk management.
- Proactive strategies help investors capture new opportunities and protect assets in uncertain times.
Staying alert and flexible allows investors to navigate challenges and build long-term success.
FAQ
What should investors do during a market crash?
Investors should review their portfolios, avoid panic selling, and focus on long-term goals. Diversification and regular monitoring help reduce risk. Many experts recommend staying informed and consulting financial advisors for guidance.
How do global events impact stock prices?
Global events, such as new tariffs or geopolitical unrest, often cause sharp changes in stock prices. These events can increase uncertainty and lead to higher market volatility. Investors may see both risks and opportunities during these periods.
Why is diversification important in volatile markets?
Diversification spreads investments across different assets, sectors, and regions. This approach lowers the impact of a single asset’s poor performance. Studies show diversified portfolios recover faster after market downturns.
How can investors manage risk from inflation?
Investors can manage inflation risk by including assets like Treasury Inflation-Protected Securities (TIPS) or real estate. Regular portfolio reviews and adjusting asset allocation also help protect against rising prices.
Where can investors find reliable market updates?
Investors can use trusted sources like Bloomberg, CNBC, and Reuters for real-time news. Many financial platforms offer alerts and watchlists to help investors track important market changes quickly.
As global markets face turbulence from tariffs and geopolitical unrest, minimizing costs and staying agile are vital for investors. BiyaPay streamlines your strategy with its multi-asset wallet, offering free conversions between USDT and over 200 cryptocurrencies into fiat currencies like USD or HKD. This eliminates costly exchange fees, enabling swift diversification into defensive assets like gold or healthcare stocks. With remittance fees as low as 0.5%, BiyaPay ensures cost-efficient fund transfers, even in volatile markets. Its secure platform and one-minute registration provide the reliability needed to adapt quickly. Ready to navigate market uncertainty with confidence? Join BiyaPay now and optimize your investment approach today.
*This article is provided for general information purposes and does not constitute legal, tax or other professional advice from BiyaPay or its subsidiaries and its affiliates, and it is not intended as a substitute for obtaining advice from a financial advisor or any other professional.
We make no representations, warranties or warranties, express or implied, as to the accuracy, completeness or timeliness of the contents of this publication.


Contact Us
Company and Team
BiyaPay Products
Customer Services


is a broker-dealer registered with the U.S. Securities and Exchange Commission (SEC) (No.: 802-127417), member of the Financial Industry Regulatory Authority (FINRA) (CRD: 325027), member of the Securities Investor Protection Corporation (SIPC), and regulated by FINRA and SEC.
registered with the US Financial Crimes Enforcement Network (FinCEN), as a Money Services Business (MSB), registration number: 31000218637349, and regulated by FinCEN.
registered as Financial Service Provider (FSP number: FSP1007221) in New Zealand, and is a member of the Financial Dispute Resolution Scheme, a New Zealand independent dispute resolution service provider.