- EasyCard
- Trade
- Help
- Announcement
- Academy
- SWIFT Code
- Iban Number
- Referral
- Customer Service
- Blog
- Creator
Understanding the Technology Driving Stock Market Forecasts


Image Source: pexels
Technology shapes how experts approach stock market prediction today. AI, deep learning, big data analytics, and technical indicators form the backbone of modern stock pred tools. Many financial institutions now use AI to automate research, improve speed, and boost accuracy.
- In 2024, 91% of financial firms adopted AI for tasks like fraud detection and high-speed trading.
- Deep learning models, such as LSTM, find patterns in stock pred data that older methods miss.
- Big data analytics lets science teams process massive data sets, including social media and economic signals.
| Technology | Role in Stock Market Prediction |
|---|---|
| AI and Deep Learning | Detect hidden patterns and trends |
| Technical Indicators | Guide trading decisions |
| Science & Analytics | Enhance data reliability and model performance |
Modern science now relies on these advances to push the limits of stock market prediction accuracy.
Key Takeaways
- AI and deep learning help experts find hidden patterns in large stock market data, improving prediction accuracy beyond traditional methods.
- Big data analytics and technical indicators like EMA and RSI provide valuable information that supports better trading decisions and portfolio management.
- Hybrid and ensemble models combine different technologies and data sources, including sentiment analysis, to create more reliable and accurate stock forecasts.
- High-quality data and continuous model updates are essential to maintain prediction accuracy, especially during volatile market conditions.
- Despite advances, challenges like data quality, model transparency, market volatility, and ethical concerns remain, requiring ongoing innovation and human oversight.
Stock Market Prediction Tech

Image Source: pexels
Modern stock market prediction relies on a blend of advanced technologies. These tools help experts analyze large amounts of data, spot patterns, and make more accurate forecasts. The main technologies include ai, deep learning methods, big data analytics, technical indicators, and hybrid or ensemble models. Many teams also use sentiment analysis and news data to improve their results.
AI in Stock Market Prediction
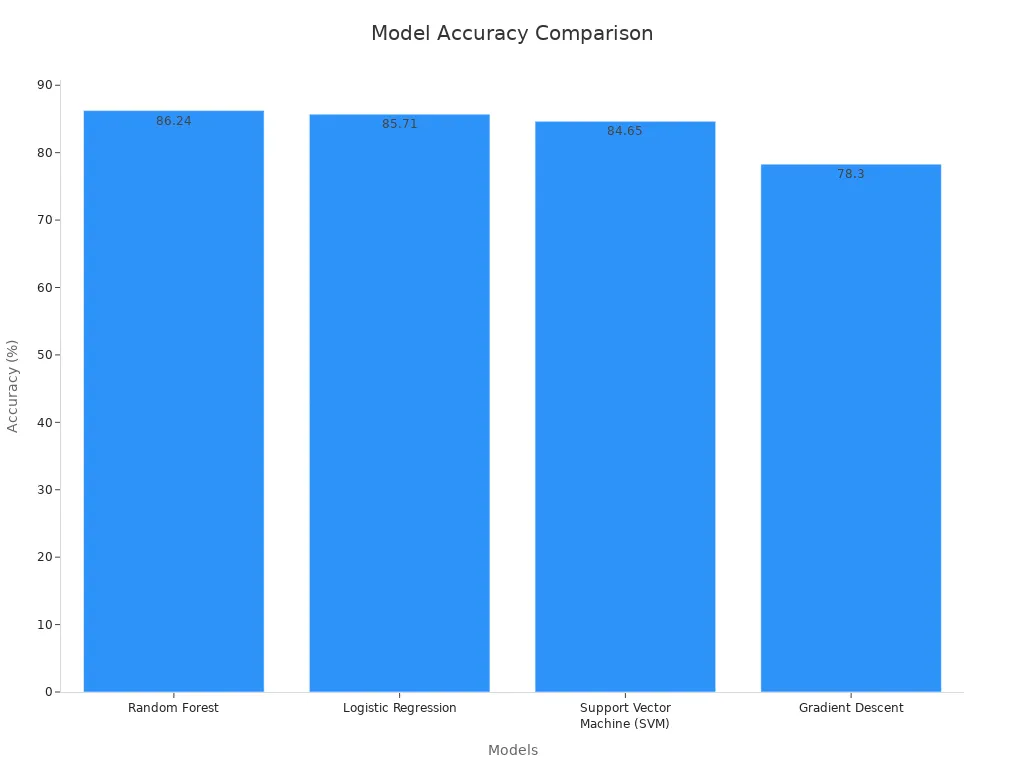
ai has changed how experts approach stock pred. It can process huge data sets and find patterns that humans might miss. ai models use ml to learn from past data and predict future trends. These models often outperform traditional methods. For example, random forest, a popular ai-based machine learning model, achieves higher accuracy than older techniques.
| Model | Accuracy (%) | Description of Effectiveness |
|---|---|---|
| Random Forest | 86.24 | Highest accuracy; effective in handling non-linearities and high-dimensional data; superior to traditional methods |
| Logistic Regression | 85.71 | Strong performance; models linear relationships well |
| Support Vector Machine (SVM) | 84.65 | Promising but requires further tuning; handles some non-linearities |
| Gradient Descent | 78.30 | Lowest accuracy; limited in capturing non-linear relationships; more traditional/fundamental optimization method |
ai models use more than just accuracy. They also rely on risk-adjusted return metrics like the Sharpe Ratio and Sortino Ratio. These metrics help experts balance risk and reward, which is important for trading decisions. ai models have also shown strong results in precision, recall, and F1-score, often reaching values above 90%. In many cases, ai outperforms human analysts and reduces extreme prediction errors when combined with human expertise.
Deep Learning Methods
deep learning methods use neural networks with many layers to analyze complex data. These models can spot hidden trends in stock pred that simpler models miss. Long Short-Term Memory (LSTM) networks and Convolutional Neural Networks (CNN) are common choices. They help capture both time-based and feature-based patterns in stock market prediction.
A new Black-Litterman framework uses deep learning-based return forecasts and market efficiency adjustments. This approach improves prediction accuracy and portfolio performance, especially during market changes. Meta-learning models also show better results than traditional deep learning methods, offering high accuracy with less data and fewer resources.
Big Data Analytics
big data analytics allows experts to process massive amounts of information from many sources. This includes price data, trading volumes, social media, and economic news. By using big data analytics, teams can build more reliable stock pred models.
| Methodology | Accuracy Range (%) | Notes on Performance |
|---|---|---|
| Support Vector Machine | ~53.65 - 85 | Often outperforms decision trees and logistic regression in prediction accuracy. |
| Decision Tree | ~52.73 - 85 | Performance varies; effective with important variables. |
| Random Forest | ~52.4 - 98 | Shows strong predictive capabilities; sometimes outperforms other models. |
| Logistic Regression | ~54.24 - 80 | Provides moderate accuracy; sometimes outperformed by SVM and random forest. |
Studies show that these big data analytics methods can reach accuracy levels from about 50% up to 98%. They use metrics like sensitivity, specificity, and balanced accuracy to measure performance. These methods help science teams build models that handle complex and changing market data.
Technical Indicators
Technical indicators are formulas that use price and volume data to predict future stock movements. Some of the most reliable indicators include the exponential moving average (EMA), relative strength index (RSI), and KDJ line strategy. These tools have proven effective in both in-sample and out-of-sample tests over many years.
A study using data from 1950 to 2018 found that EMA, RSI, and KDJ outperform traditional indicators. When combined with advanced forecasting methods, these indicators improve accuracy and portfolio performance. Machine learning models like XGBoost and Random Forest also use technical indicators to boost prediction results.
Hybrid and Ensemble Models
Hybrid and ensemble models combine different algorithms to improve stock market prediction. These models can mix ai, ml, deep learning methods, and technical indicators. By blending strengths from each approach, hybrid models handle complex data better and reduce errors.
Hybrid CNN-LSTM models, for example, use CNN for feature extraction and LSTM for time-based patterns. Adding sentiment analysis from news and social media further improves accuracy. This approach captures both structured and unstructured data, making forecasts more reliable.
Note: The integration of sentiment analysis and news data into hybrid models leads to smoother optimization, better generalization, and higher profitability in stock pred.
Ensemble models like XGBoost, bagging, and boosting also outperform single-model approaches. They combine weaker models into a stronger predictor, improving accuracy and robustness. Studies show that heterogeneous ensembles can improve accuracy by up to 80%, while homogeneous ensembles offer stable gains.
| Ensemble Model Type | Description | Accuracy Improvement Range | Additional Notes |
|---|---|---|---|
| Heterogeneous Ensemble | Combines diverse algorithms on same dataset | 2.59% to 80.10% improvement | High accuracy, versatility, robustness |
| Homogeneous Ensemble | Uses multiple data subsets with same algorithm (bagging, boosting) | 3.83% to 33.89% improvement | More stable improvements, beneficial for unstable algorithms |
Hybrid and ensemble models now set the standard for stock market prediction, especially when they include sentiment analysis and news data.
How It Works
Data Collection
Stock market prediction starts with collecting large amounts of data. Teams gather price histories, trading volumes, economic news, and social media posts. They use ai tools to scan and organize this information quickly. Data preprocessing steps, such as normalization and imputation, help clean the data. These steps remove errors and fill in missing values. Reliable data collection leads to better model performance. Experts use metrics like mean squared error (MSE) and mean absolute error (MAE) to check if the data supports accurate predictions. Cross-validation and back-testing help confirm that the collected data works well for forecasting. When teams use high-quality data, they gain stronger data-driven insights.
Model Training
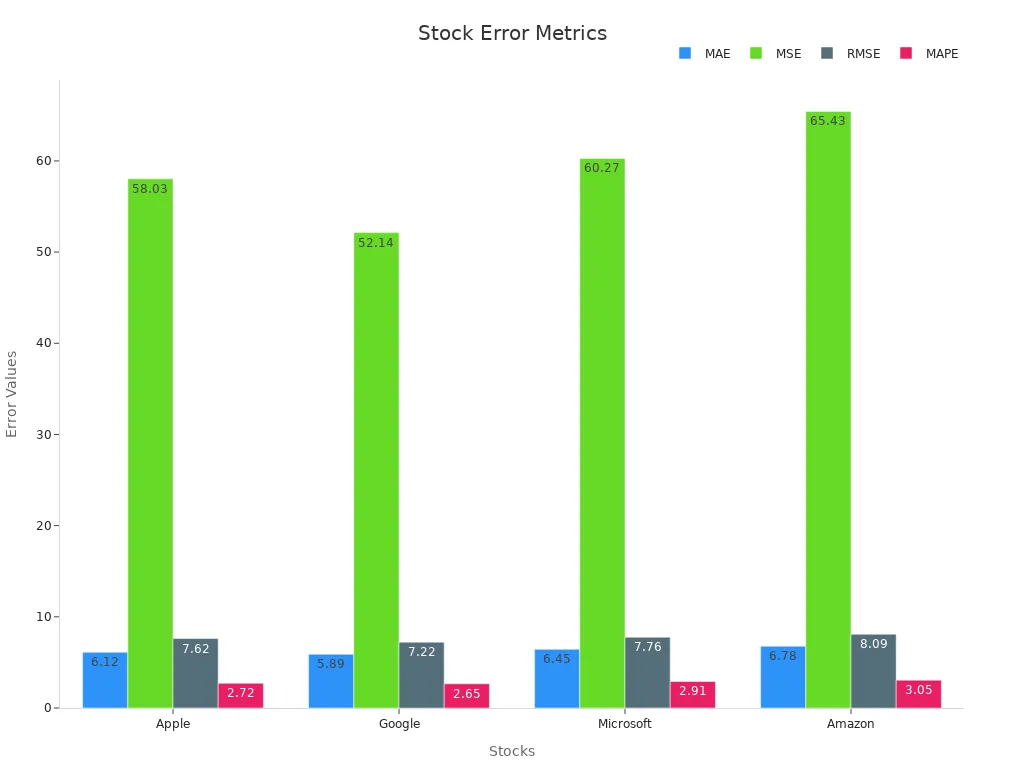
After collecting and cleaning the data, teams train the financial predicting model. They use ai models like LSTM, Random Forest, and XGBoost. These models learn from past data to spot patterns and trends. The training process often uses a sliding window approach, where the model looks at sequences of 60 days to predict future prices. Sentiment analysis from news articles adds another layer of information. This step improves accuracy by 8–12%. Early stopping and the Adam optimizer prevent overfitting and speed up learning. The table below shows how an LSTM model performed on major stocks using four error metrics:
| Stock | MAE | MSE | RMSE | MAPE (%) |
|---|---|---|---|---|
| Apple | 6.12 | 58.03 | 7.62 | 2.72 |
| 5.89 | 52.14 | 7.22 | 2.65 | |
| Microsoft | 6.45 | 60.27 | 7.76 | 2.91 |
| Amazon | 6.78 | 65.43 | 8.09 | 3.05 |
AutoML tools like TPOT and H2O.ai automate this process. They select features, train models, and rank results. This helps teams find the best ai pipeline for stock prediction.
Real-Time Analysis
Once trained, ai models move to real-time analysis. They process new data as it arrives from sources like QuickBooks, payroll systems, and market feeds. These models use supervised and unsupervised learning, deep learning, and reinforcement learning. Real-time dashboards show predicted versus actual results. Alerts warn teams if performance drops. Statistical tests, such as the Kolmogorov-Smirnov Test and Population Stability Index, check for data drift. Continuous monitoring and retraining keep the ai models accurate, even when market conditions change. This approach gives traders and analysts up-to-date data-driven insights for fast decisions.
Applications
Algorithmic Trading
Algorithmic trading uses ai to help traders find trading opportunities and make fast decisions. Many financial institutions rely on ai-powered algorithms to execute trades in milliseconds. Over 50% of hedge fund trades and 58% of FOREX trades now use algorithms. High-frequency trading, powered by ai, improves liquidity and helps with price discovery. These systems also reduce bid-ask spreads, making markets more efficient for investors. However, they can increase short-term volatility and sometimes cause flash crashes.
| Strategy / Fund | Annual Return (%) | Notes |
|---|---|---|
| XYZ Investment Group (Statistical Arbitrage) | 20 | Outperformed broader market; fast execution and risk minimization via advanced tech. |
| Renaissance Technologies (Medallion Fund) | 35 | Consistent high returns since 1988; uses mathematical/statistical techniques. |
| AQR Capital Management (AQR Alpha Fund) | 20+ | Annualized returns since 1998 using algorithmic trading for institutional clients. |
Deep learning and convolutional neural networks help traders recognize complex patterns. Decision trees support real-time decisions, and agile methods allow quick adaptation to market changes. Traders use technical indicators like EMA and RSI to spot trading opportunities and manage risk.
Sentiment Analysis
Sentiment analysis uses ai to study news, social media, and financial reports. Financial institutions use these tools to understand how investors feel about the market. Studies show that negative news often predicts falling stock prices. When ai combines sentiment from Reddit, Yahoo Finance, and other sources, prediction accuracy can reach over 70%. In China, sentiment analysis has proven especially useful for small and growth stocks during volatile times.
- Sentiment analysis with support vector machines achieved nearly 90% accuracy in predicting market direction.
- Negative tweets often signal higher market volatility.
- News sentiment gives more reliable signals than social media alone.
Traders and investors use these insights to adjust their strategies. Ai models help financial institutions react quickly to changes in market mood, giving them an edge in finding trading opportunities.
Portfolio Management
Portfolio management has changed with ai and big data. Financial institutions now offer robo-advisors that use ai to build and manage portfolios for investors. These tools provide low-cost, personalized advice, especially for younger investors. Surveys show that more investors trust ai-driven portfolio management each year.
During the bearish market in 2022, ai-driven funds lost less money than human-managed funds. Ai-driven funds had a mean return of -17.08%, while human-managed funds lost -30.74%. Ai also improved risk-adjusted performance, using measures like the Sharpe ratio and Jensen’s alpha. In bullish markets, human managers sometimes outperform ai, showing that both approaches have strengths.
Ai helps financial institutions protect investors during downturns and find trading opportunities in all market conditions.
Challenges

Image Source: pexels
Data Quality
Data quality stands as a major challenge for financial institutions using ai in stock market prediction. Poor or biased data can lead to inaccurate results. Outdated or incomplete records often cause models to fail in current markets. Financial institutions must focus on data accuracy, completeness, and consistency. They use data governance and validation processes to improve results. Studies show that professional integration services can boost forecast accuracy by 10-20%. Data validation rules reduce errors by 35%. Hybrid human-automation models can improve forecast accuracy by up to 40%. High-quality data helps investors make better decisions and reduces financial risk.
| Improvement Area | Statistic / Metric | Impact / Result |
|---|---|---|
| Forecast Accuracy Improvement | 10-20% increase with expert services | Enhanced accuracy |
| Error Reduction | 35% reduction due to validation rules | Fewer errors |
| Forecast Accuracy Boost | 30-40% improvement from hybrid models | Better forecasts |
Model Interpretability
Many ai models, especially deep learning systems, act as “black boxes.” Investors and financial institutions often struggle to understand how these models make decisions. Complex factors like economic trends, political events, and investor sentiment influence stock prices. Traditional models cannot capture these nonlinear patterns. Deep learning models such as CNNs and LSTMs can find hidden trends, but their complexity makes them hard to explain. Explainable ai tools like SHAP and LIME help, but they sometimes lower accuracy. This trade-off between interpretability and performance remains a key issue for financial institutions and investors.
Market Volatility
Market volatility creates another challenge for ai-driven stock prediction. Sudden events, such as economic crises or natural disasters, disrupt model forecasts. Financial institutions use numerical metrics like R-squared and the Clark-West test to measure forecast accuracy during volatile periods. Technical indicators work well during economic growth, while macroeconomic variables perform better in recessions. Combining both types of data gives the most reliable results. Investors need to adjust their risk management strategies to handle these rapid changes. Even the best ai models can struggle when markets shift quickly.
- Market volatility and non-stationarity reduce model reliability.
- Sudden regime shifts require constant model updates.
- Systemic risks can arise when many financial institutions use similar ai models, leading to herding behavior.
Ethics and Regulation
Ethics and regulation play a growing role in ai-based stock prediction. Financial institutions must ensure fairness, transparency, and accountability. Regulatory bodies watch for issues like market manipulation and unfair trading. Algorithmic trading faces scrutiny for its impact on market integrity. Investors want to trust that ai systems act responsibly. Real-world cases, such as the use of ai in sentiment analysis and algorithmic trading, show the need for clear rules. Financial institutions must balance innovation with ethical standards to protect investors and maintain market stability.
Impact on Forecasts
Accuracy Gains
Advances in ai have led to major improvements in stock market forecast accuracy. Deep learning models now outperform older methods by finding patterns that traditional tools miss. These models use many accuracy metrics to measure their performance. Some of the most common metrics include precision, recall, F1-score, and ROC AUC for classification tasks. For regression, experts use mean squared error (MSE), mean absolute error (MAE), and root mean squared error (RMSE). These metrics help investors and traders see how well ai models predict market movements.
| Metric Category | Metric Name | Description | Role in Accuracy Improvement |
|---|---|---|---|
| Classification Metrics | Accuracy | Fraction of correct predictions | Shows overall correctness |
| Precision | True positives among predicted positives | Finds relevant positive cases | |
| Recall | True positives among actual positives | Measures completeness | |
| F1-score | Harmonic mean of precision and recall | Balances precision and recall | |
| ROC AUC | Area under ROC curve | Evaluates class distinction | |
| Regression Metrics | MSE | Average squared error | Highlights large errors |
| MAE | Average absolute error | Shows average prediction error | |
| RMSE | Square root of MSE | Gives error in original units | |
| R squared (R2) | Proportion of variance explained | Indicates model fit |
Multifactor deep learning models have shown better results than single-method approaches. They detect abrupt market changes and adapt to new data quickly. ai systems use anomaly detection and adaptive learning rates to handle sudden shifts. Robustness testing across different markets helps avoid overfitting. These improvements give investors more confidence in ai-driven forecasts.
Note: Even with high accuracy, the best statistical results do not always mean the best trading or investment outcomes. Experts must choose the right metrics for each application.
Remaining Risks
Despite these gains, technology-driven forecasts still face risks. Out-of-sample tests show that some models work better in certain markets but not in others. The predictive power of uncertainty indices drops as the forecast period grows longer. For example, the VIX index predicts better at longer horizons, but daily predictions lose strength. High-frequency data can make real-time forecasting less reliable for traders.
- Rolling window regressions reveal that extreme events, such as the 2008 financial crisis or the COVID-19 pandemic, cause time-varying risks.
- Forecast combination methods, like using the mean or median of several models, help manage uncertainty and outliers.
- Composite uncertainty indices improve performance but still face challenges from market-specific events.
Residual risks come from unpredictable market events and the limits of ai models. Static risk management can lower long-term exposure, but dynamic risks remain. Uncertainty quantification lets investors and traders judge the value of extra information. However, different users have different needs and goals. Cooperation among large investors helps spread risk, but no system can remove all uncertainty. ai continues to improve, but investors and traders must stay alert to new risks in complex markets.
AI, deep learning, and big data analytics have changed how experts predict the stock market.
- AI-powered hedge funds often outperform traditional methods.
- AI uses natural language processing to find insights in news and reports.
- AI-driven sentiment analysis tracks real-time market mood.
- AI supports high-frequency trading for faster, more accurate trades.
- AI and big data analytics uncover patterns that older tools miss.
- AI models use deep learning to improve predictions over time.
- AI reduces human bias and helps manage risk.
- AI gives personalized investment advice for better results.
- AI automates decisions by learning from past data.
- AI continues to drive innovation in finance.
Technology brings better accuracy, but challenges remain. Ongoing innovation and human oversight help keep stock market prediction reliable.
FAQ
What is the main advantage of using AI in stock market prediction?
AI can process large amounts of data quickly. It finds patterns that humans often miss. This helps experts make better forecasts and reduce errors.
How do technical indicators help traders?
Technical indicators use price and volume data to show trends. Traders use these signals to decide when to buy or sell stocks. Common indicators include EMA, RSI, and KDJ.
Can AI models predict sudden market crashes?
AI models can spot warning signs before some crashes. However, they cannot predict every sudden event. Extreme situations, such as natural disasters, still surprise most models.
Is sentiment analysis important for stock prediction?
Sentiment analysis studies news and social media to understand market mood. It helps experts see how investors feel. This information can improve prediction accuracy, especially during volatile times.
As AI and big data transform stock market predictions, managing costs and streamlining investments are key to leveraging these insights. BiyaPayempowers traders with its multi-asset wallet, offering free conversions between USDT and over 200 cryptocurrencies into fiat currencies like USD or HKD. This eliminates costly exchange fees, enabling you to act swiftly on AI-driven market signals. With remittance fees as low as 0.5%, BiyaPay ensures cost-efficient portfolio adjustments, even in volatile markets. Its secure platform and one-minute registration provide the reliability needed for data-driven trading. Ready to capitalize on advanced forecasting tools? Join BiyaPay now and enhance your investment strategy with confidence.
*This article is provided for general information purposes and does not constitute legal, tax or other professional advice from BiyaPay or its subsidiaries and its affiliates, and it is not intended as a substitute for obtaining advice from a financial advisor or any other professional.
We make no representations, warranties or warranties, express or implied, as to the accuracy, completeness or timeliness of the contents of this publication.


Contact Us
Company and Team
BiyaPay Products
Customer Services


is a broker-dealer registered with the U.S. Securities and Exchange Commission (SEC) (No.: 802-127417), member of the Financial Industry Regulatory Authority (FINRA) (CRD: 325027), member of the Securities Investor Protection Corporation (SIPC), and regulated by FINRA and SEC.
registered with the US Financial Crimes Enforcement Network (FinCEN), as a Money Services Business (MSB), registration number: 31000218637349, and regulated by FinCEN.
registered as Financial Service Provider (FSP number: FSP1007221) in New Zealand, and is a member of the Financial Dispute Resolution Scheme, a New Zealand independent dispute resolution service provider.