- EasyCard
- Trade
- Help
- Announcement
- Academy
- SWIFT Code
- Iban Number
- Referral
- Customer Service
- Blog
- Creator
Understanding the Triggers of a Down Stock Market in the Modern Era


Image Source: pexels
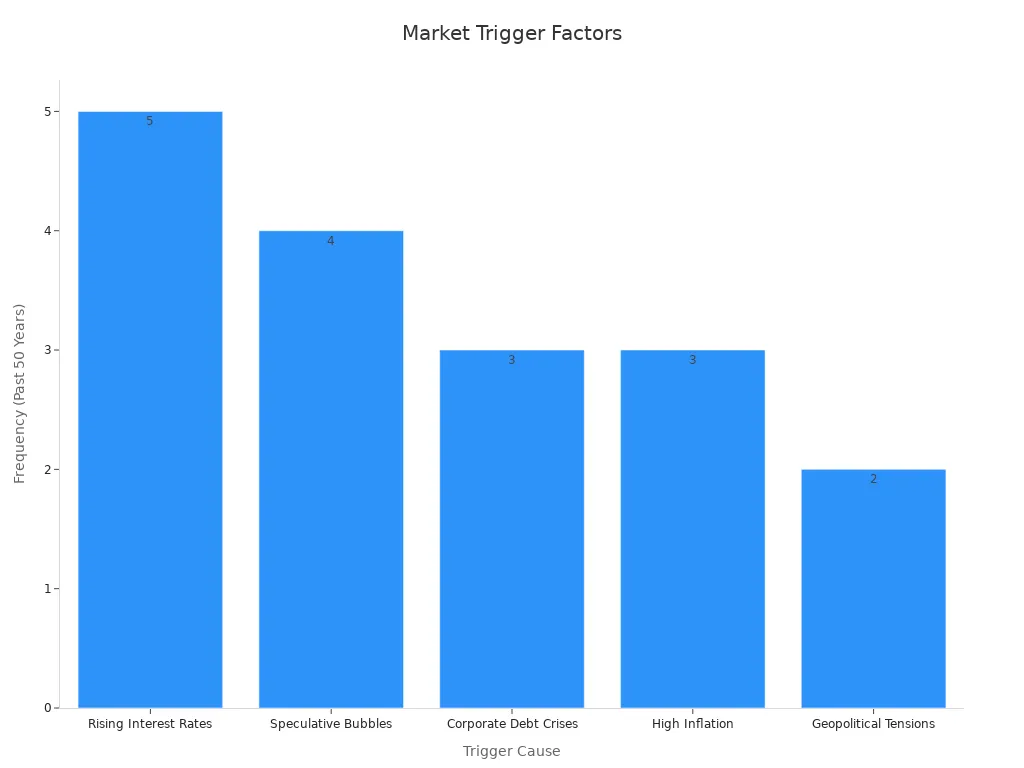
A down stock market often starts when economic signals turn negative, investor confidence drops, or global tensions rise. Recent data shows that rising interest rates, speculative bubbles, and corporate debt crises have triggered a stock market decline several times over the past five decades.
| Trigger Cause | Description | Frequency in Past 50 Years |
|---|---|---|
| Rising Interest Rates | Higher rates reduce spending, borrowing, and corporate profits. | 5 times |
| Speculative Bubbles | Prices rise far above actual value, then drop quickly. | 4 times |
| Corporate Debt Crises | Companies overloaded with debt default, triggering panic. | 3 times |
| High Inflation | Rising prices lead to tighter monetary policy, choking growth. | 3 times |
| Geopolitical Tensions | Wars, sanctions, or global conflicts create fear and uncertainty. | 2 times |
Investors should note that recent U.S. reports highlight slowing consumer spending, falling confidence, and policy uncertainty—factors that can quickly turn a healthy stock market into a down stock market. These triggers may affect investment plans and risk levels for many.
Key Takeaways
- Economic troubles like rising interest rates, inflation, and recessions often start a down stock market by reducing spending and profits.
- Global events such as wars, trade conflicts, and political uncertainty create fear that can quickly lower stock prices.
- Investor emotions and behaviors, especially panic selling and herd mentality, can deepen market drops and increase volatility.
- Advanced technology helps predict trends and manage risks but can also speed up market swings during crashes.
- Diversifying investments, staying informed, and using risk management strategies protect portfolios and help investors navigate downturns.
Down Stock Market Triggers
Economic Factors
Economic factors play a central role in triggering a down stock market. When a recession hits, companies face lower profits, and unemployment rises. This leads to a drop in consumer spending and investor confidence. The Consumer Confidence Index (CCI) often predicts future household consumption and savings, which can signal a coming downturn. Rising interest rates make borrowing more expensive and encourage investors to move money from stocks to safer assets. Inflation, both high and persistent, erodes purchasing power and increases costs for businesses. Deflation, on the other hand, can signal weak demand and falling prices, which also hurt the stock market.
Government fiscal and monetary policies, such as changes in taxes, spending, or money supply, directly affect economic conditions. For example, tight monetary policy and higher interest rates can trigger a stock market crash by reducing liquidity. The largest single-day drop in the Nasdaq Composite Index, a 12.32% fall on March 16, 2020, shows how external shocks like the COVID-19 pandemic can cause a sudden crash. Supply and demand imbalances, where more investors want to sell than buy, also drive prices down. Economic woes, such as stagflation or poor economic data, often lead to a prolonged downturn and increased stock market volatility.
Note: Research shows that macroeconomic triggers, such as economic recessions and credit cycles, cause the largest and longest stock market crashes, with gradual declines and slow recoveries.
Geopolitical Events
Geopolitical events create uncertainty and can quickly lead to a stock market downturn. Wars, terrorism, and international conflicts disrupt trade and supply chains, causing sharp declines in stock prices. The Russian–Ukrainian conflict in February 2022 led to a more than 50% drop in the Russian market capitalization-weighted index in one day. The S&P 500 index fell by about 5.2% after the 9/11 terror attack in 2001. The Sino-U.S. trade conflict also caused significant losses in the Chinese stock market.
| Geopolitical Event | Stock Market Impact | Source / Study Details |
|---|---|---|
| Russian–Ukrainian Conflict (2022) | Russian market index dropped by over 50% in one day; global impact | Boubaker et al. (2022); JFin-SWufe SpringerOpen article |
| 9/11 Terror Attack (2001) | S&P 500 fell by about 5.2% immediately after the attack | Iwanicz-Drozdowska et al. (2021); ScienceDirect article |
| Sino-U.S. Trade Conflict | Significant negative impact on Chinese stock market | He et al. (2021); JFin-SWufe SpringerOpen article |
| Basque Country Terrorist Attacks | Basque stocks underperformed; GDP per capita gap of ~10% compared to other regions | Abadie and Gardeazabal (2003); JFin-SWufe SpringerOpen article |
Geopolitical risk increases policy uncertainty and investor risk aversion, leading to sharp market crashes and volatility spillovers across global markets. The Geopolitical Risk Index (GPR) measures these shocks and helps analysts understand their impact on stock market volatility. Climate risk and the COVID-19 crisis have further heightened geopolitical risk and market volatility in recent years.
Policy Changes
Policy changes and government announcements often coincide with stock market downturns. When authorities intervene during a crash, such as the U.S. Plunge Protection Team (PPT) did during Black Monday in 1987 and the 2008 global credit crisis, markets may experience temporary rallies or further volatility. The PPT also met during the December 2018 market drop, when the Dow Jones Industrial Average fell by 650 points. These meetings signal to investors that the government recognizes the severity of the downturn.
- The PPT recommended regulatory changes to Congress in 1999 related to derivatives markets, showing that policy activity often follows financial market crashes.
- Policy-driven news, especially from the U.S., has a significant influence on global stock market jumps and downturns. About one-third of jumps in non-U.S. markets link to U.S. developments, with China-related triggers rising in frequency.
- Research finds that policy news tends to trigger more upward than downward jumps, but when markets have performed poorly, policy news is less likely to cause an upward move.
Policy uncertainty, especially in the political environment and policy uncertainty, can increase market volatility and trigger a stock market crash. Investors watch for changes in interest rates, government spending, and regulatory actions, as these can quickly shift market sentiment and lead to a crash.
Investor Behavior
Investor behavior is a powerful force behind stock market crashes. Behavioral finance research shows that many investors act irrationally, often following herd behavior or reacting emotionally to news. During a downturn, panic selling can accelerate losses and deepen the crash. Investor sentiment, both optimistic and pessimistic, drives price fluctuations and long-term trends.
- 73% of wealth management clients changed their investment behavior after portfolio value declines.
- 34% moved assets into active investments, while 33% shifted toward savings and deposits.
- Younger investors showed a higher tendency to switch to active investments and digital assets during volatility.
- Over half sought additional independent financial advice, and 62% planned to review financial plans in response to future volatility.
During the October 1987 crash, nearly 1,000 investors reported high anxiety and believed they could predict the market. Many interpreted the crash as driven by other investors’ psychology, not just economic causes of stock market crash. Both buyers and sellers thought the market was overvalued before the crash, and some changed their strategies in anticipation of a downturn.
Investor sentiment can cause sudden changes in market yields and asset prices, impacting financial market stability. Waves of optimism and pessimism, especially during crises, shape decisions and can forecast future market corrections. Understanding investor psychology is crucial for predicting and managing stock market crashes.
Technological Factors
Technological factors have become increasingly important in both triggering and mitigating stock market crashes. Digital transformation, including data analytics, automation, and artificial intelligence, enhances operational efficiency and risk management. These advances help reduce panic-driven sell-offs and stabilize stock prices during a downturn.
- Predictive analytics and machine learning models forecast market trends, improving investment timing and asset allocation. For example, JPMorgan Chase reported an 8.7% improvement in returns using these tools.
- Machine learning algorithms detect anomalies and automate trading, reducing manual errors. Goldman Sachs achieved a 40% reduction in manual trade execution.
- Advanced risk modeling techniques, such as Value at Risk (VaR) and Monte Carlo simulations, enable dynamic risk assessment and faster exposure adjustments during market volatility.
- Market sentiment analysis uses natural language processing on social media and news to predict market movements with 65-70% accuracy. Citigroup improved portfolio performance by 18% using these methods.
- Portfolio diversification strategies use sophisticated correlation and covariance analyses to optimize asset allocation, reducing risk during market crashes when asset correlations increase.
Digital transformation, known as ‘New Quality Productivity,’ improves corporate governance, stakeholder engagement, and technological innovation. Firms that adopt strategic digital governance experience systemic improvements that act as protective factors against extreme market fluctuations. However, program trading and algorithmic trading can sometimes amplify volatility and contribute to a stock market crash, as seen in recent crashes.
Tip: Banks and financial institutions that leverage advanced technology and data-driven methods show greater resilience during market turbulence, helping to mitigate the impact of a down stock market.
Causes of Stock Market Crash
Image Source: pexels
Speculative Bubbles
Speculative bubbles represent one of the most common causes of stock market crash. A stock market bubble forms when asset prices rise far above their fundamental value, often driven by investor optimism and herd behavior. Overvaluation of stocks becomes widespread, and the market disconnects from economic reality. When the bubble bursts, prices fall sharply, leading to a crash.
- Historical market crashes such as the Dutch tulip bubble, South Sea bubble, Internet bubble, and the 2008 global financial crisis all followed this pattern.
- Researchers use statistical models like the GSADF test and LPPLS model to identify bubble phases and predict their collapse.
- Bubbles cause prices to deviate from fundamentals, misallocating resources and increasing the risk of a crash.
- Empirical studies show that bubble bursts often lead to severe economic downturns and stock market depressions.
- Despite different origins, bubbles display similar explosive growth and collapse patterns, which can be detected and forecasted.
A stochastic statistical model applied to the United States, Japan, and China. demonstrates that speculative bubbles cause stock prices to move away from their true value. The model links bubble formation to macroeconomic factors and shows that as prices deviate further from fundamentals, the likelihood of a crash increases. In emerging markets, non-cointegration tests confirm that bubbles frequently cause stock prices to stray from their underlying value, especially during periods of macroeconomic uncertainty. Research on Japan’s 1980s asset price bubble reveals that bubble behavior can spread across markets, amplifying the impact of a crash. Behavioral finance studies also show that chartist traders and optimistic retail investors contribute to explosive price dynamics, increasing crash risk. When economic policy uncertainty rises, speculative trading intensifies, making a stock market crash more likely.
Excessive Leverage
Excessive leverage plays a critical role in many stock market crashes. Leverage refers to borrowing money to invest in stocks, amplifying both gains and losses. When investors or companies take on too much debt, they become vulnerable to even small declines in asset prices.
Financial ratios such as the debt-to-equity ratio and debt-to-total assets ratio help measure leverage. Overleveraged companies struggle to meet interest and principal payments, which strains cash flow and limits their ability to operate. This financial stress can lead to bankruptcy, asset sales, and a loss of investor confidence. During a downturn, these vulnerabilities can trigger a downward spiral, causing a crash in the broader stock market.
Hong Kong banks and other financial institutions monitor leverage ratios closely to manage risk. When excessive leverage spreads across the market, it can create systemic risk. In past crashes, overleveraged firms faced insolvency, which contributed to widespread panic and market panic. The overvaluation of assets often encourages more borrowing, making the eventual crash even more severe.
Panic Selling
Panic selling occurs when investors rush to sell their stocks out of fear, often during a sudden downturn. This behavior can turn a normal correction into a full-blown stock market crash. Panic selling is driven by psychological factors such as loss aversion, overconfidence, and emotional overreaction.
During the global COVID-19 market downturn, researchers observed that panic selling led to realized losses and missed long-term gains. Investors who sold during the crash often failed to benefit from the rapid recovery that followed. In the Japanese market, studies show that irrational and rapid stock disposals increased volatility and deepened losses. Financial literacy can reduce panic selling, but overconfidence in financial knowledge sometimes has the opposite effect.
Behavioral finance experiments reveal that when investors choose their own assets, they are less likely to panic sell. Cognitive biases like the IKEA effect and status quo bias help explain why some investors hold on during a crash, while others sell in a panic. Historical data links panic selling to long-lasting changes in investor behavior, reducing household wealth and financial stability.
Note: Panic selling not only accelerates a crash but also causes persistent deviations from fundamental values, making recovery more difficult.
Market Illiquidity
Market illiquidity refers to the inability to buy or sell assets quickly without causing a significant price change. Illiquidity can amplify the severity of a stock market crash, as it becomes harder for investors to exit positions during a downturn.
| Liquidity Metric / Historical Data | Description | Impact on Market Crashes |
|---|---|---|
| Effective bid-ask spread | Measures transaction costs via bid-ask price differences | Higher spreads signal lower liquidity, increasing crash risk |
| Amihud illiquidity ratio | Return-to-volume ratio measuring price impact | Elevated ratios correlate with larger price drops during crises |
| Portion of zero daily returns | Used as an illiquidity measure in emerging markets | Higher ratios indicate illiquidity, correlating with increased crash severity |
| LTCM collapse (1998) | Over-leveraged portfolio forced liquidation in illiquid markets | Triggered a short-term global market crash |
| 2007-2008 Financial Crisis | Global liquidity shocks caused 40-60% equity market declines | Dry-up of liquidity intensified market crashes worldwide |
When liquidity dries up, transaction costs rise, and price swings become more extreme. The collapse of Long-Term Capital Management in 1998 and the 2007-2008 financial crisis both illustrate how illiquidity can trigger or worsen a crash. Central banks often respond by injecting liquidity to stabilize the market. Quantitative measures like the Amihud illiquidity ratio and effective bid-ask spreads help analysts monitor market conditions and anticipate potential crashes.
Investors should watch for signs of illiquidity, such as widening bid-ask spreads and declining trading volumes, as these often precede a stock market crash.
Stock Market Crash Dynamics
Black Swan Events
Black swan events are rare and unpredictable incidents that cause major disruptions in financial markets. These events often trigger a stock market crash because investors cannot prepare for them. Examples include the 2008 global financial crisis, the 9/11 terrorist attacks, and the COVID-19 pandemic. Each event led to sharp declines in stock prices and increased market uncertainty. The 1987 stock market crash, known as Black Monday, saw the Dow Jones Industrial Average fall by 22.6% in one day. During these times, investors often move their money into safer assets like gold or government bonds. The table below highlights some of the most impactful black swan events:
| Black Swan Event | Description | Market Impact |
|---|---|---|
| 2008 Financial Crisis | Lehman Brothers collapse | Global stock price declines, liquidity crunch |
| 9/11 Terrorist Attacks (2001) | Attack on World Trade Center | Sudden drop, slow recovery |
| 1987 Black Monday | Largest one-day percentage drop | Extreme volatility, rapid decline |
| COVID-19 Pandemic (2020) | Global health crisis | Record rapid drops, high volatility |
These events show that a stock market crash can happen quickly and unexpectedly, causing long-term effects on economies worldwide.
Supply and Demand Imbalance
Supply and demand imbalances often lead to sudden changes in stock market volatility. When supply chains break down, or demand surges unexpectedly, prices can swing sharply. For example, the COVID-19 pandemic caused factory shutdowns and transportation delays, which led to shortages and price spikes. The 2021 Suez Canal blockage stopped a major trade route, increasing shipping costs and causing product shortages. The Russia-Ukraine war limited the supply of key metals, affecting manufacturing and raising costs. These disruptions can start as supply shocks but often turn into demand shocks, making it hard for markets to recover quickly. When supply and demand do not match, a crash can follow as investors react to uncertainty.
- Global events like trade disruptions and natural disasters increase stock market volatility.
- Economic indicators such as inflation and unemployment can make these imbalances worse or better.
Herd Behavior
Herd behavior happens when investors follow the actions of others instead of making independent decisions. This behavior can amplify market movements and increase the risk of a stock market crash. Behavioral finance research shows that herding leads to more buying during booms and more selling during downturns. When many investors act together, they can drive prices away from true value, causing bubbles or deep losses. Surveys reveal that risk perception and dividend policies influence how strongly investors follow the crowd. Herd behavior increases stock market volatility and can turn a small decline into a major crash. Recognizing these patterns helps investors and policymakers manage risk during uncertain times.
Market Impact
Image Source: pexels
Short-Term Effects
A down stock market can cause immediate changes in both financial and public health sectors. Investors often react quickly, leading to sharp price swings and increased volatility. This volatility does not just affect portfolios. It also impacts people’s health. Studies show that when the stock market drops, there is a noticeable rise in cardiovascular problems. For example:
- Every 100-point increase in market volatility links to about a 1% rise in cardiovascular deaths and a 3% increase in stroke cases.
- Within 48 hours of a sharp market drop, cardiovascular mortality can rise by over 4%.
- These health effects can last up to five days after a major market event.
Psychological stress from sudden losses can trigger these health issues. The stress response activates the nervous system and can lead to depression. These findings highlight that the effects of a stock market downturn go beyond finances. They can touch every part of society.
Long-Term Recovery
The process to recover from a downturn often takes years. After a major drop, the stock market does not bounce back overnight. Economic studies on past crises, such as the Great Recession, show that recovery involves more than just rising stock prices. Labor markets take time to heal. Unemployment rates may double, and job quality can decline. The employment-to-population ratio often recovers slowly.
Researchers have found that:
- Wage growth remains weak for several years after a downturn.
- Labor market mismatches can persist, making it harder for workers to find suitable jobs.
- Regional mobility helps some areas recover from a downturn faster than others.
- Job creation and destruction at the company level shape the pace of recovery.
Hysteresis effects, where high unemployment lingers, can slow the return to normal. Social impacts, such as earnings losses and changes in labor market rules, also play a role. To recover from a downturn, both individuals and economies must adapt. Policymakers often use targeted support and reforms to help the market and society recover from a downturn. Over time, most markets do recover from a downturn, but the path can be slow and uneven.
Investor Strategies
Staying Informed
Investors who stay informed can better navigate a down stock market. They set clear research goals and use tools like surveys and social listening to gather timely data. By analyzing trends and acting quickly, investors adjust their strategies before losses grow. Financial studies show that understanding market cycles helps investors shift to defensive stocks during downturns. For example, during the 2008 crisis, those who recognized the contraction phase reduced losses by reallocating assets. Investors also benefit from regular updates, clear reports, and historical context. These steps help them avoid emotional decisions and focus on long-term goals.
Tip: Investors should use SWOT analysis and benchmarking to compare investments and spot new opportunities. This approach supports better resource allocation and risk management.
Diversification
Diversification remains a key strategy for managing risk in the stock market. Investors spread their assets across different sectors, countries, and asset classes. Studies show that international diversification reduces volatility, especially during global shocks like COVID-19. Portfolios that include stocks, bonds, gold, and oil perform better and show lower risk than single-asset portfolios. For example, shifting investments from unstable regions to stable markets, such as moving from the Middle East to Southeast Asia, helped investors maintain positive returns during political crises.
- Diversified portfolios have higher Sharpe ratios and lower volatility.
- Cross-asset diversification offers resilience during market downturns.
Risk Management
Effective risk management protects investors during market declines. Many use frameworks like COSO ERM or scenario-based portfolio optimization. These methods help identify, assess, and mitigate risks. Empirical studies confirm that integrating ESG factors lowers financial and liquidity risks. Hong Kong banks, for example, use model risk management and regular reviews to ensure stability. Investors also use regret-based optimization and scenario analysis to adjust portfolios as conditions change. These measures to take during a stock market crash help limit losses and support recovery.
| Risk Management Technique | Description | Benefit |
|---|---|---|
| Scenario Analysis | Simulates different market outcomes | Prepares for uncertainty |
| ESG Integration | Considers environmental, social, and governance factors | Reduces risk exposure |
| Portfolio Optimization | Balances risk and return using models | Improves decision-making |
Stock market crashes often result from a mix of excessive leverage, inflation, policy uncertainty, tax changes, and rapid technological shifts. The table below highlights these main causes and their impacts:
| Cause Category | Description | Example / Impact |
|---|---|---|
| Excessive Leverage | Borrowing increases risk and can force panic selling. | Quick selling to repay loans triggers declines. |
| Inflation and Rising Interest Rates | High inflation and rate hikes hurt profits and stock prices. | Investors move money out of stocks, causing downturns. |
| Policy Uncertainty | Sudden government actions create fear and panic selling. | Example: 2016 Indian demonetisation led to a sharp market drop. |
| Tax Changes | Tax adjustments affect confidence and stability. | Combined with recession, they add to instability. |
| Market Bubbles and Technology | Bubbles and AI-driven trading can inflate prices and speed up crashes. | Herd mentality and fast trading amplify losses. |
Understanding these triggers helps investors make better decisions. Historical trends and case studies show that those who analyze patterns and manage risk proactively often achieve stronger results. Staying informed and prepared allows investors to turn market challenges into new opportunities.
FAQ
What is the main difference between a market correction and a crash?
A market correction usually means a drop of 10% or less from recent highs. A crash involves a much sharper and faster decline, often over 20%, and can cause panic among investors.
How do rising interest rates affect stock prices?
Rising interest rates increase borrowing costs for companies. This reduces profits and can lower stock prices. Investors may also move money from stocks to safer assets like bonds.
Can technology prevent future stock market crashes?
Technology can help by improving risk management and market analysis. However, automated trading sometimes increases volatility. No system can fully prevent crashes, but advanced tools can reduce their impact.
Why do investors panic sell during downturns?
Investors panic sell because fear and uncertainty take over. They want to avoid further losses. Behavioral finance shows that emotions often drive these quick decisions, not logic or data.
How can investors protect their portfolios during a downturn?
Investors can protect portfolios by diversifying assets, staying informed, and using risk management strategies. Many choose stable sectors or defensive stocks. Regular reviews and professional advice also help reduce losses during market declines.
Navigating a down stock market demands cost efficiency and agility to mitigate risks from economic and geopolitical triggers. BiyaPay empowers investors with its multi-asset wallet, offering free conversions between USDT and over 200 cryptocurrencies into fiat currencies like USD or HKD. This eliminates costly exchange fees, enabling seamless shifts to defensive assets during volatility. With remittance fees as low as 0.5%, BiyaPay ensures affordable fund transfers to optimize your portfolio. Its secure platform and one-minute registration provide the reliability needed to stay proactive. Don’t let market triggers derail your strategy—sign up with BiyaPay today and safeguard your investments with confidence.
*This article is provided for general information purposes and does not constitute legal, tax or other professional advice from BiyaPay or its subsidiaries and its affiliates, and it is not intended as a substitute for obtaining advice from a financial advisor or any other professional.
We make no representations, warranties or warranties, express or implied, as to the accuracy, completeness or timeliness of the contents of this publication.


Contact Us
Company and Team
BiyaPay Products
Customer Services


is a broker-dealer registered with the U.S. Securities and Exchange Commission (SEC) (No.: 802-127417), member of the Financial Industry Regulatory Authority (FINRA) (CRD: 325027), member of the Securities Investor Protection Corporation (SIPC), and regulated by FINRA and SEC.
registered with the US Financial Crimes Enforcement Network (FinCEN), as a Money Services Business (MSB), registration number: 31000218637349, and regulated by FinCEN.
registered as Financial Service Provider (FSP number: FSP1007221) in New Zealand, and is a member of the Financial Dispute Resolution Scheme, a New Zealand independent dispute resolution service provider.