- EasyCard
- Trade
- Help
- Announcement
- Academy
- SWIFT Code
- Iban Number
- Referral
- Customer Service
- Blog
- Creator
What Are Financial Analysts Saying About a Potential Stock Market Crash


Image Source: unsplash
Recent expert forecasts do not predict a certain stock market crash in 2025, but they point to sharp declines and volatility in major global indexes. Financial analysts show moderate optimism, yet they warn about significant risks. Many investors worry about the likelihood of a crash, warning signs, and how severe losses might become. The table below shows the dramatic swings in April 2025, highlighting the need for careful investment decisions and strong risk management.
| Market/Index | Key April 2025 Moves |
|---|---|
| S&P 500 | Lost 6.65% in one day |
| Nasdaq Composite | 1,600-point loss; 5.8% drop; bear market entered |
| Dow Jones Industrial | Fell 3.98% and 5.5% on consecutive days |
| Russell 2000 | Dropped 6.59%, bear market |
Investors should stay alert to stock market crash forecast signals and focus on sound investment strategies.
Key Takeaways
- Financial analysts expect moderate stock market gains in 2025 but warn about high volatility and risks from economic and political uncertainty.
- Warning signs like sharp GDP drops, persistent inflation, and sudden interest rate changes could signal increased chances of a market downturn.
- Diversifying investments across different assets, sectors, and regions helps reduce risk and protect portfolios during market swings.
- Investors should use risk management tools and stay informed about market trends to make better decisions and respond quickly to changes.
- Opportunities exist in technology, AI, and international markets, but balancing growth and value stocks is key to managing risks.
2025 Stock Market Outlook
Analyst Consensus
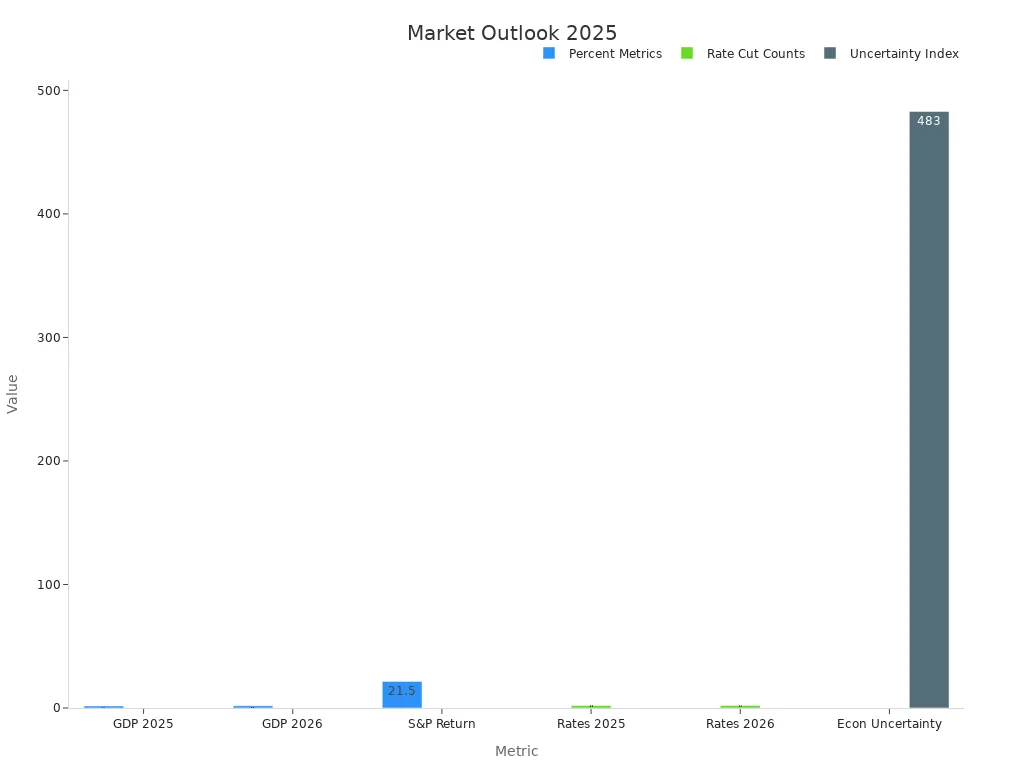
Most major financial institutions expect moderate gains for the stock market in 2025. Morgan Stanley, Schwab, Fidelity, and BlackRock point to healthy fundamentals and manageable risks. The overall stock market outlook reflects cautious optimism, with a focus on steady economic growth and controlled credit risk. Analysts highlight that the US GDP should grow between 1.0% and 1.9%, with a baseline of 1.5%. The Federal Reserve projects two rate cuts in 2025, which could support investor sentiment and reduce volatility.
| Metric / Indicator | Projection / Range / Data Point | Source / Context |
|---|---|---|
| U.S. GDP Growth (2025) | 1.7% | Federal Reserve economic projections (March 2025) |
| Federal Funds Rate Cuts (2025) | 2 rate cuts expected | Federal Open Market Committee “dot plot” |
| S&P 500 Earnings Growth (2025) | 3.9% to 8.5% | Strategas Research estimates |
| S&P 500 Average Return After High Uncertainty | 21.5% over 12 months following spikes in uncertainty | Historical data since 1985, Strategas Research |
| Fixed Income Yields | >6% in select segments | Attractive yields with low credit risk |
| Equity Risk Premium (2025–2034) | Positive but historically low | Schwab Asset Management long-term capital market expectations |
Analyst estimates suggest that stocks will outperform bonds, but the margin will be smaller than in previous years. The S&P 500 delivered a 25% gain in 2024, driven by a few large technology companies. Most US stocks had modest returns, showing that market gains remain concentrated.
Diverging Views
Some analysts see risks that could challenge the optimistic longer-run outlook. They point to high volatility, policy uncertainty, and geopolitical tensions. The US election in 2025 may increase volatility, especially if one party controls all branches of government. Policy changes in trade, immigration, and energy could affect stocks and investor sentiment.
- Global economic growth should remain strong, except for a slowdown in Chin.
- Developed market interest rates are likely to stay higher for longer, with the US near 4% and the euro area below 2%.
- Inflation in emerging markets may slow, but tariffs and currency changes could cause temporary price increases.
- Geopolitical risks, such as armed conflict and extreme weather, add to market uncertainty.
Business sentiment indicators and mixed economic data also contribute to diverging analyst views. Some experts note that, despite policy support, certain sectors like energy have underperformed in the past. This history adds complexity to the 2025 outlook.
Investors should prepare for increased volatility and dispersion across stocks, sectors, and regions. Flexibility and diversification remain key strategies for managing risk in the coming year.
Key Drivers for 2025
Economic Growth
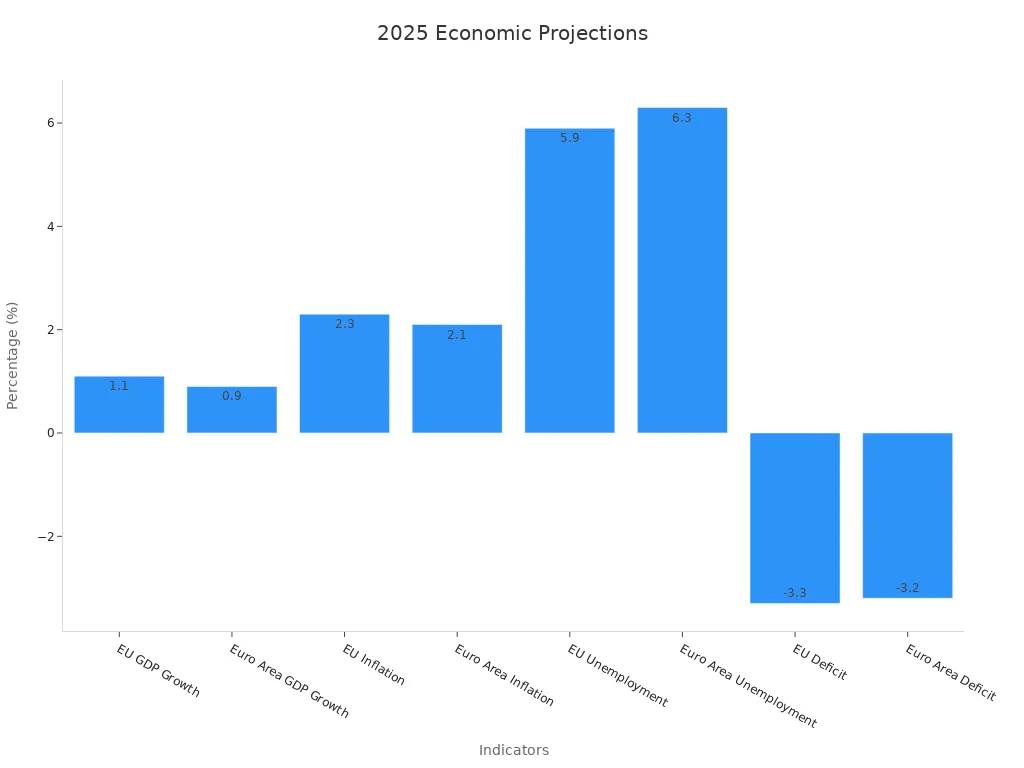
Economic growth remains a central factor shaping the 2025 market outlook. The IMF projects global economic growth at 3.3% for 2025, which is below the historical average. Advanced economies expect slower growth, while emerging markets like India and China show higher rates. The EU and euro area face moderate growth, with GDP rates of 1.1% and 0.9% respectively. Inflation is expected to ease, supporting stable value for currencies and assets.
| Indicator | 2024 Value | 2025 Projection | 2026 Projection |
|---|---|---|---|
| EU GDP Growth | 1.0% | 1.1% | 1.5% |
| Euro Area GDP Growth | 0.9% | 0.9% | 1.4% |
| EU Inflation | 2.6% | 2.3% | 1.9% |
| Euro Area Inflation | 2.4% | 2.1% | 1.7% |
| EU Unemployment | 5.9% | 5.9% | 5.7% |
| Euro Area Unemployment | 6.4% | 6.3% | 6.1% |
| EU Deficit | -3.2% | -3.3% | -3.4% |
| Euro Area Deficit | -3.1% | -3.2% | -3.3% |
The IMF notes that downside risks, such as trade tensions and policy uncertainty, could slow growth and impact value in both growth and value stocks.
Interest Rates
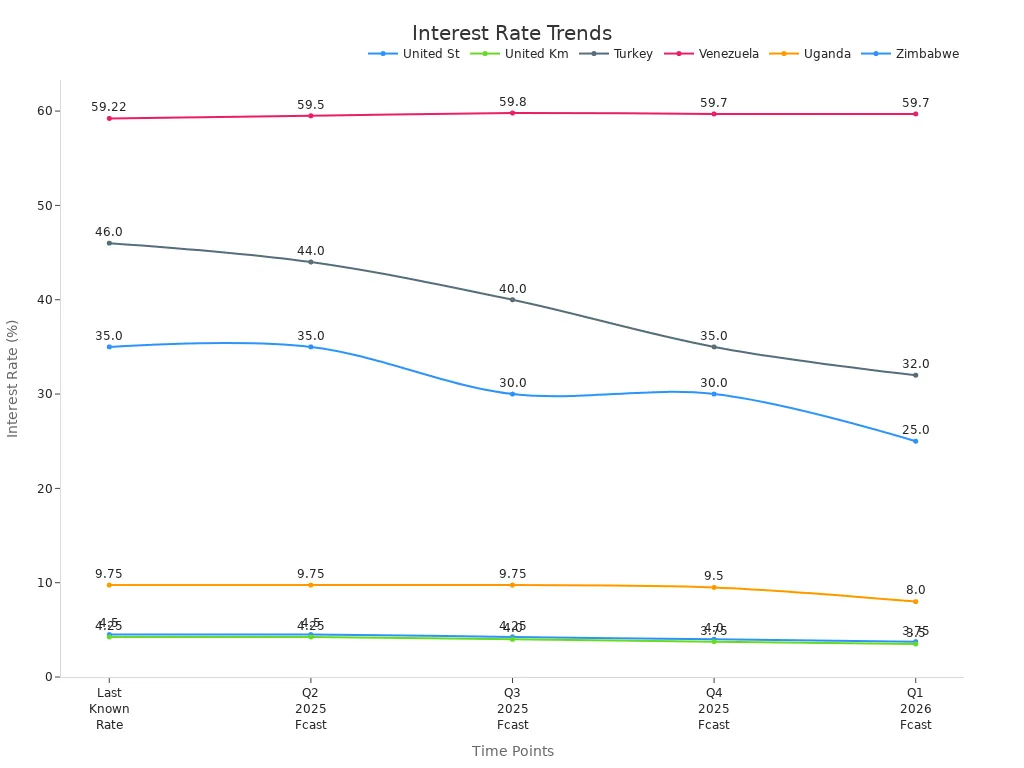
Interest rates play a critical role in determining the value of investments and the cost of borrowing. In 2025, the United States is forecasted to lower its policy rate from 4.5% to 4.0% by year-end. The United Kingdom expects a similar trend. High inflation in some emerging markets, such as Turkey and Venezuela, keeps their rates elevated. Lower rates in advanced economies may support economic growth and help stabilize stocks.
| Country | Last Known Rate (mid-2025) | Q2 2025 Forecast | Q3 2025 Forecast | Q4 2025 Forecast | Q1 2026 Forecast |
|---|---|---|---|---|---|
| United States | 4.50% | 4.50% | 4.25% | 4.00% | 3.75% |
| United Kingdom | 4.25% | 4.25% | 4.00% | 3.75% | 3.50% |
| Turkey | 46.00% | 44.00% | 40.00% | 35.00% | 32.00% |
| Venezuela | 59.22% | 59.50% | 59.80% | 59.70% | 59.70% |
| Uganda | 9.75% | 9.75% | 9.75% | 9.50% | 8.00% |
| Zimbabwe | 35.00% | 35.00% | 30.00% | 30.00% | 25.00% |
Policy and Elections
Policy changes and elections create u.s. policy uncertainty, which can affect market value and investor confidence. The 2024 U.S. presidential election and possible policy shifts under Kamala Harris or Donald Trump will influence economic growth, inflation, and demand for safe-haven assets. A divided government may limit major fiscal changes, while tariff and immigration policies could impact inflation and labor supply. Political polarization and shifting voter sentiment add to u.s. policy uncertainty, raising the risk of recession and market volatility.
Reliable polling and clear policy direction help reduce uncertainty and support stable growth and value stocks.
Global Factors
Several global factors will shape the 2025 outlook:
- Global GDP growth is forecasted at 3.1%, with advanced economies at 1.8% and emerging markets at 4.1%.
- The U.S. leads advanced economies with 2.2% growth, while China slows to 4.5% and India grows at 6.4%.
- Inflation is expected to decline but remains sensitive to protectionism and geopolitical tensions.
- Trade tensions and supply chain shifts continue to influence value and growth stocks.
- Central banks respond cautiously to inflation and geopolitical risks, leading to varied regional policies.
Market participants should monitor these drivers closely to protect value and capture opportunities in both growth and value stocks.
Stock Market Crash Forecast

Image Source: pexels
Warning Signs
Analysts have identified several warning signs that could point to a stock market crash forecast for 2025. These signals often appear before major downturns and help investors prepare for increased volatility and recession risk.
- The Federal Reserve Bank of Atlanta’s GDPNow model estimates a 2.2% annualized contraction in U.S. GDP for the first quarter of 2025. This figure exceeds the 2% threshold that experts consider a warning sign for recession risk.
- Historical data shows that when GDP contracts by more than 2% on an annualized basis, sharp declines in the stock market often follow. For example, during the 2008-2009 financial crisis, GDP fell between 2.1% and 8.5%, and the S&P 500 dropped 57%. In 2020, GDP fell by 5.5% and then 28.5%, with the S&P 500 losing 34%.
- On average, when GDP contracts more than 2% in the past 20 years, the S&P 500 has declined about 45%. This pattern supports the current stock market crash forecast and highlights the importance of monitoring economic growth.
Other warning signs include rising inflation, which erodes purchasing power and can lead to higher interest rates. When inflation remains high, central banks may raise rates to control prices, increasing the cost of borrowing and reducing corporate profits. This environment often leads to greater volatility and can trigger a market correction.
Investors should watch for these warning signs: sharp GDP contractions, persistent inflation, and sudden changes in interest rates. These factors often signal increased volatility and a higher chance of a market downturn.
Risk Factors
Several risk factors could trigger a stock market crash forecast in 2025. Experts point to overvaluation, excessive debt, and global instability as the main threats.
- Historical stock market crashes, such as those in 1929, 1987, and 2020, show that steep declines can happen quickly. A crash usually means a double-digit percentage drop within a few days. While no comprehensive statistical studies predict a crash in 2025, analysts rely on historical patterns and current uncertainties to assess risk.
- The S&P 500 price-to-earnings (P/E) ratio stands at 29.7, about 40% above its historical average of 20.2. This overvaluation increases the risk of a sharp correction. The Buffet Indicator, which compares market capitalization to GDP, also signals an overvalued market. John Hussman estimates that the market would need to fall about 63% to return to historical norms.
- The Shiller P/E ratio and earnings yield relative to cash yields confirm that valuations are at levels seen before previous bubbles. Market internals, such as declining market breadth and increased speculative activity, have weakened. These trends often appear before major crashes.
- The banking sector faces vulnerabilities. Unrealized losses on long-term bonds now exceed $650 billion, which could lead to credit tightening and liquidity problems. Hong Kong banks and others with large bond holdings may face increased risk if interest rates rise or if inflation remains high.
- Jeremy Grantham, a well-known market strategist, warns about the dangers of excessive debt. Since 1985, the U.S. debt-to-GDP ratio has tripled, but economic growth has slowed. Grantham argues that more debt does not lead to more growth. Instead, it increases systemic risk and the chance of a severe downturn. He believes that irrational exuberance, high valuations, and misaligned fundamentals could trigger a sharp market correction or crash in the near term, possibly in 2025.
Experts agree that the best investment strategy remains long-term thinking. Stocks have historically rebounded after crashes, but investors should stay alert to warning signs and manage risk carefully.
Equity Market Outlook: Opportunities and Risks

Image Source: pexels
Positive Catalysts
The equity market outlook for 2025 highlights several investment opportunities. Many analysts see strong potential for positive earnings growth and improved market sentiment. Recent data shows that the S&P 500 gained 5.3%, the Nasdaq rose 7.2%, and the Dow Jones increased 3.4% in the week ending May 16, 2025. International stocks also performed well, with the MSCI EAFE index up 11.21% year-to-date and China’s large-cap ETF up 17.08%.
| Catalyst Category | Specific Evidence |
|---|---|
| U.S. Market Gains | S&P 500 up 5.3%, Nasdaq up 7.2%, Dow Jones up 3.4%, Russell 2000 up 4.5% (week ending May 16, 2025) |
| Market Breadth | 77% of S&P 500 above 50-day MA, 66% above 100-day MA, 54% above 200-day MA (highest since March) |
| Volatility | VIX dropped from >50 to <20 between April 10 and May 16, fastest decline on record |
| International Equities | MSCI EAFE up 11.21% YTD; China Large-Cap ETF up 17.08%; Mexico market up 27.10% |
| Trade Relations | U.S.-China 90-day tariff reduction: U.S. tariffs on China cut from 145% to 30%, China tariffs on U.S. goods cut to 10% |
| Inflation | Headline CPI fell to 2.3%, lowest in 4 years, near Fed target |
| Economic Growth | Atlanta Fed GDPNow Q2 2025 estimate at 2.4% annualized growth |
| Earnings and Sector Trends | Strong earnings surprises in Technology; AI investments boosted by Gulf capital commitments |
| Market Recovery Speed | S&P 500 rebounded ~19% in 25 trading days after 15%+ drop, fastest turnaround in 40+ years |
Investors see opportunity in sectors like technology, energy, and financials. The commercial adoption of AI could drive a productivity boom, supporting higher returns. Mega-cap tech stocks trade at a discount compared to the dotcom bubble, suggesting more room for growth. A balanced approach between growth and value stocks can help capture these opportunities. Diversification into developed ex-US equities and emerging markets also reduces risk from market concentration.
Investors who focus on active management and seek alpha may benefit from a deconcentrating market environment.
Downside Risks
Despite the positive outlook, the equity market outlook for 2025 includes real risks. Volatility remains high due to policy uncertainty and trade tensions. Forward price-to-earnings multiples are above long-term averages, while earnings growth expectations have slowed. This combination signals stretched valuations and possible corrections.
- Equity market returns have become concentrated in a few large stocks, increasing the risk of material losses if those stocks fall.
- Ongoing trade policy and tariff uncertainty can hurt earnings forecasts, especially for companies with high foreign input costs.
- Foreign investors have started to move money away from U.S. stocks, which could lower demand and put pressure on prices.
- Emerging markets face volatility, with China’s economy expected to lose 2% of GDP from U.S. tariffs on 70% of its exports.
- Utilities and consumer staples, usually safe during downturns, now trade at premium valuations, offering less protection.
Investors use strategies like minimum volatility factors, gold, and cash-like assets to manage downside risk. Defensive positioning and diversification remain important for protecting portfolios.
The equity market outlook for 2025 suggests that investors should stay alert, balance growth and value, and focus on risk management to navigate both opportunities and challenges.
What Investors Should Do
Diversification
Diversification remains a core principle for investors seeking to protect their investment portfolios in 2025. By spreading investment across different asset classes, sectors, and regions, investors can reduce the impact of market downturns. Studies from past crises, such as the 2008 financial crisis and the COVID-19 pandemic, show that diversified portfolios experienced smaller losses and better risk-adjusted returns. For example, adding global bonds, gold, and commodities to a portfolio helped manage volatility and improved performance during turbulent periods.
| Asset Class | 10-15 Year Projected Annual Return | Notable Trend (2024) |
|---|---|---|
| U.S. Value-Added Real Estate | 10.1% | Strong long-term performance |
| Private Equity | 9.9% | Increased liquidity |
| Growth Equity | N/A | Valuations down 63% from 2021 |
A diversified investment approach also provides exposure to sectors with growth potential, such as technology and healthcare. This strategy helps investors capture opportunity while managing risk from market shocks and inflation.
Risk Management
Effective risk management allows investors to navigate uncertainty and protect their investment capital. Investors use several quantitative metrics to measure and control risk:
- Standard deviation shows how much investment returns vary over time.
- Sharpe ratio compares investment returns to risk, with higher values indicating better performance.
- Beta measures how much an investment moves compared to the overall market.
- Value at Risk (VaR) estimates the potential loss in a portfolio over a set period.
- Conditional Value at Risk (CVaR) looks at losses beyond the VaR threshold.
These tools help investors understand the risk in their portfolios and adjust their investment strategies. Historical data shows that investors who monitor these metrics can achieve more stable returns and avoid large losses. Investor behavior that focuses on risk management often leads to better long-term outcomes.
Staying Informed
Staying informed about market trends and emerging risks gives investors a clear advantage. Research on global options markets finds that informed investors can anticipate price movements and act before others. Foreign institutional investors, for example, use market data and news to make timely investment decisions, especially during periods of volatility.
Organizations that track emerging risks, such as technology changes or geopolitical events, often outperform their peers. Investors who follow market updates, economic indicators, and policy changes can identify opportunity early and adjust their investment strategies. Regularly reviewing investment portfolios and staying updated on market developments helps investors respond quickly to new risks and opportunities.
Analysts maintain moderate optimism for 2025, but they highlight real risks and volatility. Key market trends include:
- U.S. economic growth projected at 2.5–3.0% with strong consumer demand
- Investment-grade bonds yield 4–5%, matching S&P 500 earning yields
- Elevated valuations and tight credit spreads limit margin for error
- Thematic opportunities in AI, industrial growth, and utilities
Investors should review portfolio strategies, focus on diversification, and monitor key indicators. Staying prepared helps balance caution with opportunity in a changing market.
FAQ
What are the main warning signs of a potential stock market crash in 2025?
Analysts highlight sharp GDP contractions, persistent inflation, and sudden interest rate changes as key warning signs. Investors should monitor these indicators closely to stay prepared for increased volatility.
How can investors protect their portfolios during periods of high volatility?
Investors can use diversification, risk management tools, and regular portfolio reviews. Adding assets like global bonds, gold, and cash-like instruments helps reduce risk. A diversified approach often leads to more stable returns.
Are U.S. stocks overvalued compared to historical averages?
| Metric | Current Value | Historical Average |
|---|---|---|
| S&P 500 P/E | 29.7 | 20.2 |
The S&P 500 trades above its historical average, which increases the risk of a correction.
What role do global factors play in the 2025 market outlook?
Global factors such as trade tensions, policy changes, and economic growth in China and other emerging markets influence market performance. Investors should track these trends to identify risks and opportunities.
Navigating a down stock market demands cost efficiency and agility to mitigate risks from economic and geopolitical triggers. BiyaPay empowers investors with its multi-asset wallet, offering free conversions between USDT and over 200 cryptocurrencies into fiat currencies like USD or HKD. This eliminates costly exchange fees, enabling seamless shifts to defensive assets during volatility. With remittance fees as low as 0.5%, BiyaPay ensures affordable fund transfers to optimize your portfolio. Its secure platform and one-minute registration provide the reliability needed to stay proactive. Don’t let market triggers derail your strategy—sign up with BiyaPay today and safeguard your investments with confidence.
*This article is provided for general information purposes and does not constitute legal, tax or other professional advice from BiyaPay or its subsidiaries and its affiliates, and it is not intended as a substitute for obtaining advice from a financial advisor or any other professional.
We make no representations, warranties or warranties, express or implied, as to the accuracy, completeness or timeliness of the contents of this publication.


Contact Us
Company and Team
BiyaPay Products
Customer Services


is a broker-dealer registered with the U.S. Securities and Exchange Commission (SEC) (No.: 802-127417), member of the Financial Industry Regulatory Authority (FINRA) (CRD: 325027), member of the Securities Investor Protection Corporation (SIPC), and regulated by FINRA and SEC.
registered with the US Financial Crimes Enforcement Network (FinCEN), as a Money Services Business (MSB), registration number: 31000218637349, and regulated by FinCEN.
registered as Financial Service Provider (FSP number: FSP1007221) in New Zealand, and is a member of the Financial Dispute Resolution Scheme, a New Zealand independent dispute resolution service provider.