- EasyCard
- Trade
- Help
- Announcement
- Academy
- SWIFT Code
- Iban Number
- Referral
- Customer Service
- Blog
- Creator
Comparing the Dow Jones Completion Index and the S&P 500 for Broader Market Coverage


Image Source: unsplash
Many investors search for true diversification, but not all indexes provide the same market reach. The Dow Jones TSM Completion index offers broader U.S. market coverage than the S&P 500. By understanding what each index includes, investors can make smarter choices for diversification. Index composition shapes portfolio outcomes, as studies show that clear indexing can push fund managers to improve returns and lower fees. Knowing the difference between these indexes helps investors build a portfolio that covers more of the market and manages risk effectively.
Key Takeaways
- The S&P 500 tracks the largest 500 U.S. companies, covering about 75% to 80% of the market but misses smaller firms.
- The Dow Jones Completion Index includes mid-cap, small-cap, and micro-cap stocks not in the S&P 500, filling important market gaps.
- Combining both indexes gives investors nearly full U.S. stock market exposure and reduces risk from relying on only large companies.
- Total market funds that track these indexes offer broad diversification, low fees, and help capture growth across all sectors.
- Investors should choose low-cost, well-tracked index funds and regularly rebalance portfolios to maintain broad market coverage and manage risk.
S&P 500 Index vs. Completion Index

Image Source: pexels
What the S&P 500 Index Covers
The S&P 500 Index stands as the most recognized benchmark for large-cap U.S. equity performance. This index tracks 500 of the largest publicly traded companies in the United States. It focuses on companies with a minimum market capitalization of $14.5 billion. The S&P 500 Index uses a free-float market capitalization-weighted method, which means larger companies have a greater impact on the index’s movement.
The S&P 500 Index represents about 80% of the total U.S. equity market capitalization, making it a core holding for many investors seeking exposure to leading American businesses.
The index covers all major sectors of the U.S. economy, but it does not include mid-cap, small-cap, or micro-cap stocks. The largest ten companies, such as Apple, Microsoft, and Nvidia, account for about 35% of the index’s total market cap. This concentration means that the performance of a few big companies can drive the entire index.
| Aspect | Details |
|---|---|
| Minimum Market Cap to Join | $14.5 billion |
| Total Market Cap (Feb 2025) | Approximately $53.7 trillion |
| Index Weighting Method | Free-float market capitalization-weighted |
| Top 10 Companies Market Cap % | About 35% of total index market cap |
| Top 10 Companies (Weight %) | Apple (6.4%), Microsoft (6.2%), Nvidia (6.0%), Amazon (3.8%), Alphabet (3.6%), Meta (2.7%), Berkshire Hathaway (2.0%), Broadcom (1.8%), Tesla (1.6%), JPMorgan Chase (1.4%) |
| Sector Weightings (%) | Information Technology (31.7%), Financials (14.23%), Health Care (9.55%), Consumer Discretionary (10.6%), Industrials (8.66%), Communication Services (9.62%), Consumer Staples (5.88%), Energy (3.02%), Utilities (2.48%), Real Estate (2.13%), Materials (1.94%) |
| Market Cap Influence | Larger companies have greater influence; removal/addition of largest stocks significantly affects index returns |
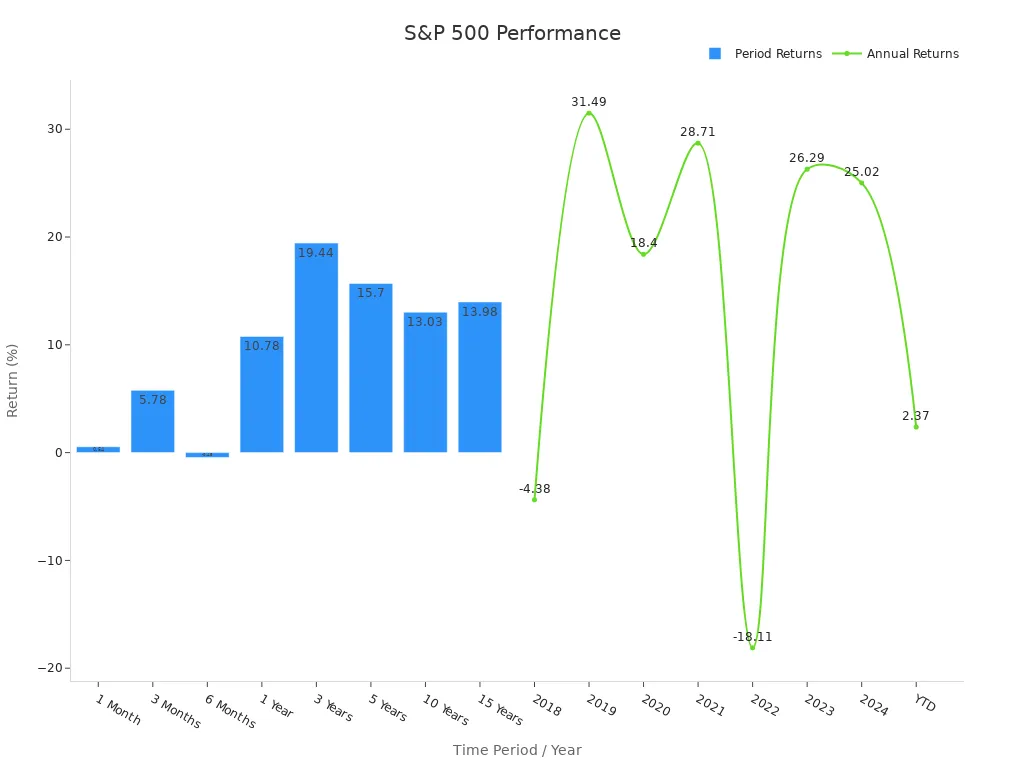
The S&P 500 Index has delivered strong long-term returns, but its performance can swing with the fortunes of its largest companies. The table below shows recent annual returns:
| Year | Annual Return (%) |
|---|---|
| 2018 | -4.38 |
| 2019 | 31.49 |
| 2020 | 18.40 |
| 2021 | 28.71 |
| 2022 | -18.11 |
| 2023 | 26.29 |
| 2024 | 25.02 |
| YTD | 2.37 |
The S&P 500 Index covers a wide range of sectors, but it does not represent the full U.S. equity market. Investors who hold only this index may miss out on the growth potential of smaller companies.
What the Completion Index Includes
The Completion Index, often called the Dow Jones U.S. Total Stock Market Completion Index, fills the gaps left by the S&P 500 Index. It tracks all U.S. equity companies that are not part of the S&P 500 Index. This includes mid-cap, small-cap, and micro-cap stocks across every sector and industry. The completion index provides exposure to thousands of companies, offering a much broader view of the U.S. equity market.
Investors use the completion index to gain access to the full spectrum of U.S. equity opportunities, beyond just the largest firms.
The completion index covers all nine sectors of the U.S. economy and spans 152 different industries. It includes companies from major indexes like the Russell 2000 and NASDAQ 100, as well as many others not found in the S&P 500 Index. This broad coverage helps investors diversify their portfolios and capture growth from emerging and smaller firms.
| Breadth Data Types (Examples) | Description |
|---|---|
| Advance/Decline Ratio | Ratio of stocks moving up vs. down in a given list |
| Percent of symbols above various SMAs (5, 10, 20, 50, etc.) | Percentage of stocks above their respective simple moving averages |
| New highs/lows over 14, 21, 63 days | Percentage of stocks making new highs or lows over different time frames |
| Net 52-week high/low difference | Difference between stocks making new 52-week highs and lows |
| Symbol Lists Represented | Description |
|---|---|
| Major Indexes | Includes S&P 500, Dow Jones 30, NASDAQ 100, Russell 2000, and others |
| All 9 US Economy Sectors | Covers all primary sectors of the US economy |
| All 152 US Economy Industries | Detailed industry-level coverage across the US economy |
Examples of breadth symbols in the completion index:
- $ADDJ30: Advance/decline ratio in Dow Jones 30 Index
- $MA50SP500: Symbols above SMA(50) in S&P 500 Index
- $MA200ENE: Symbols above SMA(200) in Energy sector
- $H14AO: Symbols at new 14-day high in Amex Oil Index
- $H21R2000: Symbols at new 21-day high in Russell 2000 Index
- $L63SD: Symbols at new 63-day low in Soft Drinks
- $HL52WALU: Net 52-week high/low symbols in Aluminum
The completion index gives investors access to the full U.S. equity market, except for the largest 500 companies. By combining the S&P 500 Index with the completion index, investors can achieve exposure to nearly the entire U.S. equity universe. This approach helps balance the influence of large-cap stocks with the growth potential of smaller firms.
How the Dow Jones TSM Completion Complements the S&P
Filling the Gaps in Market Coverage
The S&P covers the largest companies in the United States, but it does not represent the entire market. Many investors believe that holding only the S&P gives them full market exposure. This belief is not accurate. The S&P 500 covers about 75% to 80% of the U.S. equity market. That leaves a significant portion—about 20% to 25%—uncovered. The dow jones tsm completion index fills this gap.
The dow jones tsm completion index, also known as the dow jones u.s. total stock market completion index, includes all the stocks not found in the S&P 500. This index captures mid-cap, small-cap, and micro-cap companies. It even includes a small portion of large-cap stocks that do not meet the S&P’s strict criteria. By adding the completion index to a portfolio, investors can access the full range of U.S. stocks.
Investors who combine the S&P with the dow jones tsm completion index achieve broader market exposure and reduce concentration risk.
Key statistics show how the completion index addresses the gaps left by the S&P:
- The S&P 500 covers about 75% to 80% of the U.S. equity market.
- The dow jones tsm completion index fills the remaining 20% to 25%.
- The completion index includes a small portion of large-cap stocks, ranging from 1.5% to 10.1%.
- Funds tracking the s&p completion index, such as the Vanguard Extended Market Index, show about 1.5% to 3% large-cap exposure.
This complementary relationship ensures that investors do not miss out on the growth and diversification offered by the rest of the market.
Role of Mid, Small, and Micro Caps
Mid-cap, small-cap, and micro-cap stocks play a vital role in the U.S. market. The S&P focuses on the largest companies, but many innovative and fast-growing firms fall outside this group. The dow jones tsm completion index captures these companies, providing access to sectors and industries that the S&P does not cover.
Mid-cap stocks often represent companies that have moved beyond the start-up phase but have not yet reached the size of the largest corporations. Small-cap and micro-cap stocks include younger or more specialized firms. These companies can offer higher growth potential, though they may also carry more risk.
The completion index gives investors a way to balance their portfolios. By including the dow jones tsm completion, investors can:
- Diversify across more sectors and industries.
- Capture growth from emerging companies.
- Reduce reliance on the largest firms in the S&P.
A table below shows the differences in company size and market exposure:
| Index Type | Company Size | Market Coverage (%) | Example Companies |
|---|---|---|---|
| S&P 500 | Large Cap | 75-80 | Apple, Microsoft, Amazon |
| Completion Index | Mid/Small/Micro Cap | 20-25 | Roku, Etsy, Zebra Tech |
The dow jones tsm completion index and the S&P work together to provide total market exposure. Investors who use both indexes can track nearly every publicly traded company in the United States. This approach helps manage risk and capture opportunities across the entire market.
Achieving Total Stock Market Index Exposure

Image Source: pexels
Combining S&P 500 and Completion Index
Investors who want the broadest possible coverage of the U.S. equity market often combine the S&P 500 with the Completion Index. This approach creates a portfolio that closely matches a total stock market index. The S&P 500 covers the largest companies, while the Completion Index adds mid-cap, small-cap, and micro-cap stocks. Together, these two indexes give investors access to nearly every publicly traded company in the United States.
By holding both indexes, investors can reduce concentration risk and capture growth from all segments of the market.
This combination mimics the structure of total market index funds. These funds aim to track the performance of the entire U.S. stock market, not just the largest firms. Investors who use this strategy benefit from total stock market exposure, which helps smooth out returns over time.
Total Market Funds Explained
Total market funds, also called total market index funds, track indexes that represent the full U.S. equity market. The most common total stock market index is the Wilshire 5000 or similar benchmarks. These funds hold thousands of stocks, from the largest to the smallest companies. They use quantitative methods to match the index as closely as possible.
A recent study on mutual fund performance shows that total market funds using quantitative strategies tend to have low fees and minimal tracking error. For example, a leading total stock market index fund returned 18.00% over five years, while the Wilshire 5000 Index returned 17.99%. Over ten years, the fund returned 11.60%, almost identical to the index at 11.59%. This close tracking means investors can expect their returns to match the total market index over time.
| Time Horizon | Total Stock Market Index Fund Return | Wilshire 5000 Index Return | Tracking Error/Notes |
|---|---|---|---|
| 5 Years | 18.00% | 17.99% | Very close tracking performance |
| 10 Years | 11.60% | 11.59% | Very close tracking performance |
Total market funds offer several benefits:
- Broad diversification across all sectors and industries
- Low fees due to passive management
- Simple way to achieve total stock market index exposure
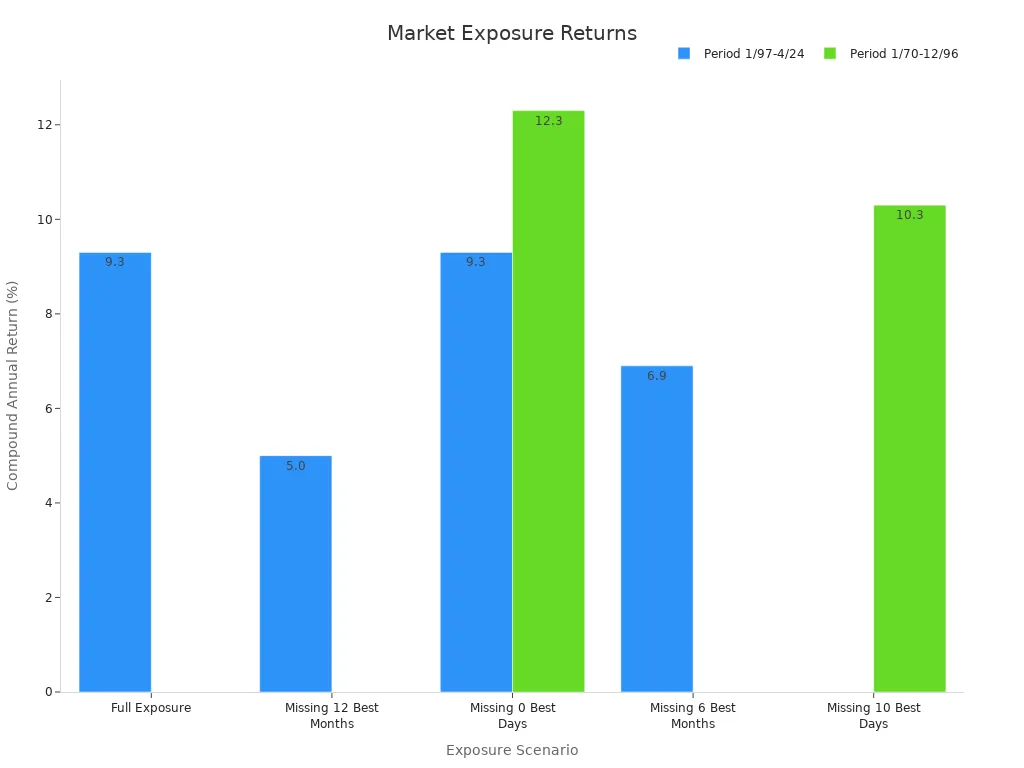
Long-term data supports this approach. Missing the best days or months in the market can lower returns. Staying invested in total market index funds helps investors capture the full growth of the market.
Total stock market funds provide a straightforward path for investors who want to match the performance of the entire U.S. equity market. By using index funds that track a total stock market index, investors can build a strong foundation for long-term investment success.
Diversification and Risk
Portfolio Diversification Benefits
Diversification stands as a core principle in investment strategy. By spreading funds across different asset classes, sectors, and company sizes, investors can reduce risk and improve the stability of their portfolio. When funds are allocated to a mix of stocks, bonds, and real estate, the overall risk decreases because not all investments react the same way to market events. For example, during the 2008 financial crisis, portfolios that included bonds and real estate experienced smaller losses than those focused only on stocks. The COVID-19 pandemic also highlighted this benefit, as diversified portfolios with exposure to technology and healthcare saw less severe declines.
- Diversification lowers the variance and volatility of returns, making performance more predictable.
- Portfolios with low correlations among assets achieve better risk-adjusted returns.
- Diversification eliminates nonsystematic risk, leaving only the market-wide risk.
- International diversification can further reduce portfolio variability, though global market integration may limit this effect.
- Risk-based models, such as minimum variance and risk parity, help optimize diversification by focusing on risk allocation.
Portfolio variance measures how much returns fluctuate. By diversifying, investors increase the certainty of their returns and protect their long-term investment goals. Many funds use advanced models to capture these benefits, but investors often do not fully exploit diversification opportunities.
Risk Profiles Compared
Risk profiles play a major role in shaping portfolio construction and performance. Robo-advisors and professional managers adjust asset allocations based on an investor’s risk tolerance. Conservative profiles receive more bonds and less equity, while aggressive profiles hold more stocks. This approach affects both the concentration and diversification of funds.
A comparison of diversified and concentrated portfolios shows clear differences in risk and returns:
| Portfolio Type | Max Assets | Sharpe Ratio | Beta Coefficient | Alpha Return | Market Exposure vs Benchmark | Key Findings |
|---|---|---|---|---|---|---|
| Maximum Loss Portfolio | 20 | 1.098 | N/A | 25% annual | Lower | Higher Sharpe ratio than benchmark, superior risk-adjusted returns |
| Expected Loss Deviation | 20 | N/A | N/A | N/A | Lower | Superior diversification and risk performance |
| Expected Shortfall Portfolio | 20 | N/A | 0.616 | N/A | Lower | Lowest Beta coefficient among portfolios |
| All Risk-Based Portfolios | 20 | N/A | < Benchmark Beta | 25% annual | Lower | Significant alpha after risk factor adjustment, lower market exposure than benchmark |
Diversified funds consistently deliver higher Sharpe ratios and lower tracking errors compared to concentrated portfolios. Long-only diversified portfolios, especially those tracking indexes like the S&P 500 and completion index, show better information ratios and more stable performance. These results confirm that diversification not only reduces risk but also enhances long-term investment returns. Historical performance data supports the use of diversified funds for achieving consistent results over time.
Practical Tips for Investors
Choosing Index Funds
Investors who want to build a strong portfolio often start with index fund selection. Choosing the right index fund can make a big difference in long-term investment results. Investors should focus on several key criteria when comparing total market index funds, total market funds, and other options:
- Expense ratio: Select funds with low fees. Lower costs help improve long-term investment returns.
- Tracking error: Check how closely the fund follows its target index. A lower tracking error means the fund better matches the index’s performance.
- Assets covered: Make sure the fund provides exposure to the desired market segments, such as large-cap, mid-cap, or small-cap stocks.
- Trading volume: Prefer funds with higher trading volume. This leads to better liquidity and lower trading costs.
- Assets under management (AUM): Consider the size of the fund. Very small funds may have higher risks or costs.
Investors can choose from mutual funds or exchange-traded funds. Many prefer etfs for their flexibility and lower expense ratios. Total market index funds and total market funds offer broad exposure and can serve as the foundation of a diversified investment strategy.
Building a Broad Market Portfolio
A broad market portfolio helps investors manage risk and capture growth from different sectors. Experts recommend several strategies to strengthen a portfolio:
- Add a 5% allocation to gold. Gold has a low correlation with stocks and can reduce volatility during market downturns.
- Allocate about 10% to diversified macro hedge funds. These funds often perform well during crises by taking advantage of global trends.
- Use structured products for up to 15% of the portfolio. These products can provide downside protection while still allowing for growth.
- Rebalance equity holdings. Reduce concentration in growth stocks and increase exposure to value stocks and international regions. This approach can make the portfolio more resilient during periods of market volatility.
Experts also suggest following the Global Market Portfolio concept. This approach uses a market-cap weighted mix of all investable assets worldwide. Investors can access this strategy through total market index funds, total market funds, and etfs. This method helps minimize unsystematic risk and supports long-term investment success.
Tip: Investors should review their portfolio regularly and adjust allocations as market conditions change. Using a mix of index fund types and etfs can help achieve broad diversification.
Investors seeking broad U.S. market coverage should combine the S&P 500 with the Dow Jones Completion Index. This approach captures over 5,000 stocks, reflecting the true performance of the entire market.
- The Dow Jones Total Market Index uses a market-cap-weighted method, ensuring accurate performance tracking.
- Experts agree that this combination improves performance by including mid-cap, small-cap, and micro-cap stocks.
- Studies show that greater diversity, like in crop rotations, leads to stronger performance and more stable returns over time.
Understanding index composition helps investors make smarter choices and achieve better performance.
FAQ
What is the main difference between the S&P 500 Index and the Dow Jones Completion Index?
The S&P 500 Index tracks the largest 500 U.S. companies. The Dow Jones Completion Index includes all other U.S. stocks not in the S&P 500, such as mid-cap, small-cap, and micro-cap companies.
Can investors buy funds that track both indexes?
Yes. Many mutual funds and ETFs track the S&P 500 or the Dow Jones Completion Index. Investors can combine these funds to achieve broader market coverage.
Why do investors combine the S&P 500 and the Completion Index?
Combining both indexes helps investors capture nearly the entire U.S. stock market. This approach reduces concentration risk and increases diversification across company sizes and sectors.
How do total stock market funds relate to these indexes?
Total stock market funds usually track indexes that include both the S&P 500 and the Completion Index. These funds offer exposure to almost all publicly traded U.S. companies in one investment.
Achieving broad market coverage with the S&P 500 and Dow Jones Completion Index requires a cost-effective and flexible platform to manage diverse investments. BiyaPay simplifies this with its multi-asset wallet, offering free conversions between USDT and over 200 cryptocurrencies into fiat currencies like USD or HKD. This eliminates expensive exchange fees, allowing you to allocate funds efficiently across large-cap, mid-cap, and small-cap assets. With remittance fees as low as 0.5%, BiyaPay supports seamless portfolio rebalancing at minimal cost. Its secure platform and one-minute registration ensure you can act quickly and confidently. Ready to diversify your portfolio with ease? Join BiyaPay today and build a resilient investment strategy!
*This article is provided for general information purposes and does not constitute legal, tax or other professional advice from BiyaPay or its subsidiaries and its affiliates, and it is not intended as a substitute for obtaining advice from a financial advisor or any other professional.
We make no representations, warranties or warranties, express or implied, as to the accuracy, completeness or timeliness of the contents of this publication.


Contact Us
Company and Team
BiyaPay Products
Customer Services


is a broker-dealer registered with the U.S. Securities and Exchange Commission (SEC) (No.: 802-127417), member of the Financial Industry Regulatory Authority (FINRA) (CRD: 325027), member of the Securities Investor Protection Corporation (SIPC), and regulated by FINRA and SEC.
registered with the US Financial Crimes Enforcement Network (FinCEN), as a Money Services Business (MSB), registration number: 31000218637349, and regulated by FinCEN.
registered as Financial Service Provider (FSP number: FSP1007221) in New Zealand, and is a member of the Financial Dispute Resolution Scheme, a New Zealand independent dispute resolution service provider.