- EasyCard
- Trade
- Help
- Announcement
- Academy
- SWIFT Code
- Iban Number
- Referral
- Customer Service
- Blog
- Creator
DJIA crash worries rise as recession looms


Image Source: unsplash
Investors now express heightened anxiety as the risk of a djia crash intensifies. Recent data shows the dow jones industrial average dropped over 500 points in a single session last week. Many fear that a djia crash could result from persistent inflation and rising interest rates. One analyst stated, “Market volatility signals deep uncertainty.” Investors watch every move, seeking signs of stability but preparing for turbulence.
Key Takeaways
- The Dow Jones Industrial Average faces risks from inflation, rising interest rates, and global conflicts that could trigger a market crash.
- Investors watch economic indicators and market trends closely to spot early warning signs and adjust their strategies.
- Defensive moves like shifting to bonds, cash, or stable sectors help protect portfolios during market downturns.
- Some investors see falling prices as buying opportunities, focusing on long-term goals and avoiding emotional decisions.
- Learning from past crashes and using both data and expert insights can improve investment decisions and reduce losses.
DJIA Crash Risks
Image Source: pexels
Economic Indicators
Investors closely monitor economic indicators for early warning signs of a DJIA crash. Recent market data shows the Dow Jones Industrial Average fell by 800 points, triggered by rising bond yields and political developments. These sharp declines highlight the immediate risks facing the stock market.
Key technical indicators, such as moving averages and the Relative Strength Index (RSI), help traders spot trends and potential reversals. Analysts also use the Rate of Change (RoC) and volatility measures to track the scattering of returns.
Recent advances in forecasting now combine traditional indicators with macroeconomic variables and investor sentiment. Models like MIDAS-LASSO and HAR-type improve the accuracy of volatility predictions, which is critical for managing risk in the Dow Jones Industrial Average.
High-yield credit spreads have also widened, signaling weaker momentum returns and raising the risk of momentum crashes. When spreads rise above 700 basis points, the chance of a sharp reversal increases.
- Dow Jones futures fell by about 1.2%, or 500 points.
- S&P 500 futures dropped by 1.4%.
- Nasdaq 100 futures tumbled by 1.8%.
These declines connect to renewed trade concerns and tariff threats, reinforcing the risk factors for a DJIA crash.
Note: Momentum strategies often crash within one to three months after significant market losses. Switching to contrarian trading after a plunge can help avoid further losses.
Stagflation Fears
Stagflation, a mix of slow growth and high inflation, now worries many investors. Inflation rates have climbed again, with core inflation reaching 3.3% in January 2025. Hiring has slowed, even though unemployment remains low. Commercial real estate income growth barely outpaces inflation, showing stagnation in that sector.
Tariffs and trade policies act as negative supply shocks, slowing economic growth and weighing on profits. Experts warn that stagflation risks are no longer negligible. Persistent inflation, combined with slowing growth, could destabilize the stock market and increase economic uncertainty.
- Inflation erodes the purchasing power of money, reducing real returns on investments.
- Companies face higher costs and slower growth, squeezing profit margins.
- Stock market volatility rises as investors react to stagflation fears.
- Sectors respond differently: consumer goods may suffer, energy may benefit, and technology faces delayed purchases but possible gains in cost-saving services.
JPMorgan Chase and Bank of America strategists point out that growth below 2% with inflation between 3% and 4% fits a stagflationary profile. Moody’s chief economist highlights that tariffs and deportations act as inflationary supply shocks, increasing stagflation risk.
Investors now see stagflation as a real threat, complicating policy responses and raising the risk of a DJIA crash.
Global Events
Geopolitical risks add another layer of economic uncertainty for the stock market. Ongoing conflicts, such as the Russia-Ukraine war, have forced multinational corporations to withdraw from affected regions. For example, Adidas expects a 1% revenue cut, IKEA estimates a 4% retail sales loss, and McDonald’s faces a $1.4 billion write-off.
| Geopolitical Event | Impact on Corporations | Supporting Data / Assessment |
|---|---|---|
| Russia-Ukraine War | Multinational corporations withdrawing from Russia | Adidas expects 1% revenue cut; IKEA 4% retail sales loss; McDonald’s $1.4 billion write-off |
| Myanmar 2021 Coup | Political instability, corporate withdrawals | Freedom House downgraded Myanmar; major companies exited post-coup |
| Governance & Conflict | Democratic governance lowers conflict involvement | ISS ESG Country Rating, Freedom House classifications |
| Country-Risk Analysis | Tool to assess geopolitical risks | Incorporates governance, democracy, rule of law, conflict involvement |
| State-based armed conflict ranks as the top global risk for 2025, with 23% of survey respondents naming it the most material crisis risk. Ongoing conflicts in the Middle East and Sudan, along with geoeconomic confrontations like sanctions and tariffs, add to the pressure. | ||
| Societal risks, such as polarization, misinformation, and inequality, further weaken social stability. Cyber espionage and warfare also rank high among investor concerns. |
Many experts now warn that war fears and geopolitical instability could trigger a 20% correction in the Dow Jones Industrial Average, especially if conflicts escalate or new crises emerge.
Investor Sentiment
Surveys and Indexes
Recent surveys and indexes provide a clear snapshot of how investors feel about the current environment. The American Association of Individual Investors (AAII) Sentiment Survey, a widely followed measure, shows that optimism has improved but remains cautious. The latest data from the week of June 12, 2025, highlights this trend:
| Metric | Value (Week of June 12, 2025) | Comparison to Previous Week | Long-Term Average |
|---|---|---|---|
| US Investor Sentiment % Bull-Bear Spread | 3.10% | Improved from -8.80% | 6.46% |
| % Bullish Sentiment | 36.67% | Increased from 32.66% | 37.62% |
The Bull-Bear Spread has moved into positive territory, showing more optimism than last week, but it still sits below the long-term average. The percentage of bullish investors has also risen, yet it remains just under the historical norm. This data suggests that while some investors see reasons for hope, many remain cautious about the future of the stock market.
Other indexes add depth to this picture. The CBOE Volatility Index (VIX) continues to serve as a key gauge of market fear. The Credit Suisse Fear Barometer (CSFB) and the Acertus Market Sentiment Indicator (AMSI) also track investor anxiety and confidence using different methods. High trading volumes and extreme one-day returns often signal increased attention and emotional reactions from investors. These measures help analysts understand how sentiment shifts during periods of uncertainty.
Investor Statements
Investor statements and professional surveys reveal a wide range of opinions about the market. Some investors express deep concern about a possible DJIA crash, pointing to persistent inflation and global tensions. Others believe that strong company earnings and resilient consumer spending will support the stock market through current challenges.
A recent study using a latent-variable model found that both price-based and survey-based investor expectations can predict future returns. Surveys tend to offer slightly better predictive power. This finding shows that investor beliefs, whether drawn from market prices or direct surveys, often reflect different views about what lies ahead.
Financial professionals also show mixed attitudes. In a controlled experiment, many saw momentum stocks as less risky and expected higher returns from them, while value stocks did not inspire the same confidence. These differences highlight how investors interpret risk and opportunity in the markets, especially during volatile times.
Note: Some investors see the current dip as a buying opportunity, while others prefer to wait for clearer signs of stability.
Market Behavior
Market behavior during periods of high DJIA volatility often reflects the mood of investors. Several key statistics help explain these reactions:
| Market Behavior Statistic | Description |
|---|---|
| Return Volatility | Increases as the market approaches circuit breaker thresholds. |
| Return Skewness | Becomes more negative, indicating a higher likelihood of negative price movements. |
| Abnormal Trading Volume | Rises, reflecting increased trading activity during volatile periods. |
| Volatility Acceleration | Intensifies as the distance to the circuit breaker approaches zero. |
When volatility spikes, trading volume often surges as investors rush to adjust their positions. This behavior can lead to wider bid-ask spreads, which increases trading costs. Behavioral studies show that many investors react to sharp moves by panic selling or trying to time the market. Over time, these reactionary trades often result in lower returns compared to simply holding a broad market index.
Sentiment indexes such as the AAII weekly survey and the VIX provide valuable insights into how investors respond to market swings. High readings on these indexes usually signal fear and uncertainty, while lower readings suggest more confidence. The Aggregate Sentiment Index (ASI), used in some markets, combines factors like trading volume and the number of IPOs to capture shifts in investor mood.
Overall, investor sentiment remains mixed. Some see warning signs and prepare for more declines, while others believe the worst may soon pass. This split outlook shapes trading patterns and keeps the stock market on edge.
How Investors Respond
Defensive Moves
Investors often take defensive steps when they see signs of trouble in the market. They may shift money into safer assets like bonds, cash, or sectors that tend to hold up during downturns. For example, during the 2008 financial crisis, those who moved funds into bonds and cash saw smaller losses than those who stayed in risky stocks. Diversification across different asset classes and sectors helps reduce risk. Many investors also rebalance their portfolios to keep their risk levels steady.
Here is a table showing how defensive strategies performed during past crises:
| Case Study | Quantitative Findings | Notes |
|---|---|---|
| 2008 Global Financial Crisis | Trend-following strategies reduced losses compared to buy-and-hold | Gold, cash, and bonds helped limit drawdowns |
| 2020 COVID-19 Crash | Defensive moves had mixed results due to fast recovery | Staying invested helped some investors |
Tip: Patience and discipline help investors ride out market swings and avoid panic selling.
Hedging Strategies
Hedging helps protect portfolios from big losses. Investors use tools like options, or focus on sectors that usually do well in tough times. Data shows that consumer staples, healthcare, and low-volatility stocks often perform better during downturns.
Here is a chart showing how different investment categories did during bear markets:
Consumer staples gained 36.4% during the 2000-2002 tech bust, while technology stocks lost 16.2%. This shows that picking the right sectors can make a big difference.
Buying Opportunities
Some investors see falling prices as a chance to buy quality stocks at lower prices. During the COVID-19 crash, many retail investors used momentum and contrarian strategies to respond quickly to changes. Institutional investors often buy undervalued stocks and sell overvalued ones, helping prices move back toward fair value.
Key lessons from past crises include:
- Diversify investments to lower risk.
- Stay calm and avoid emotional decisions.
- Focus on long-term goals, not short-term swings.
These strategies help investors manage risk and find opportunities even when the market feels uncertain.
Expert Views
Bearish Outlooks
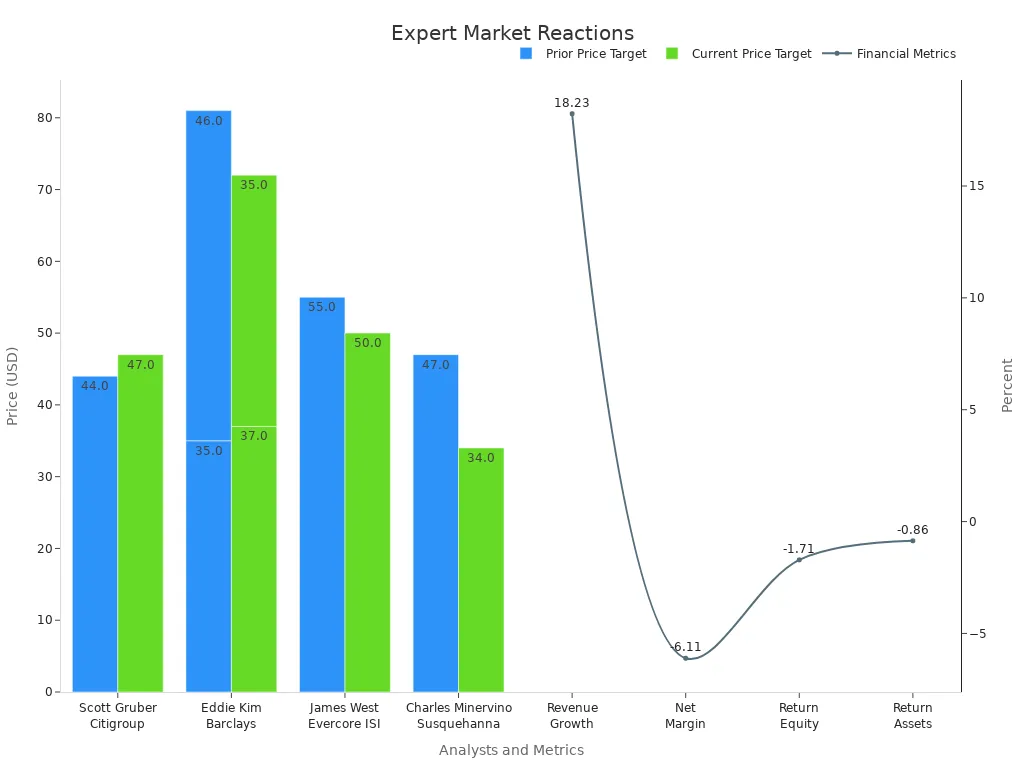
Some experts warn that the Dow Jones faces significant risks. They point to rising interest rates, persistent inflation, and global conflicts as major threats. Analysts from FXEmpire and other financial platforms have lowered their ratings and price targets for several companies, reflecting caution in their outlook. For example, Citigroup raised its price target for Valaris to $47.00, while Barclays lowered its target to $35.00. These changes show how quickly expert sentiment can shift as new data emerges.
| Analyst | Firm | Action Taken | Rating | Current Price Target | Prior Price Target |
|---|---|---|---|---|---|
| Scott Gruber | Citigroup | Raises | Neutral | $47.00 | $44.00 |
| Eddie Kim | Barclays | Raises | Equal-Weight | $37.00 | $35.00 |
| James West | Evercore ISI | Lowers | In-Line | $50.00 | $55.00 |
| Charles Minervino | Susquehanna | Lowers | Neutral | $34.00 | $47.00 |
| Eddie Kim | Barclays | Lowers | Equal-Weight | $35.00 | $46.00 |
Analysts also review financial health metrics like revenue growth, net margin, and return on equity. When these numbers fall below industry averages, experts often become more cautious.
Bullish Perspectives
Other experts see reasons for optimism. They highlight strong corporate profits, steady job growth, and resilient consumer spending. Recent data shows before-tax corporate profits reached 13.5% of GDP, the highest since the 1950s. The ISM Services PMI expanded for eight straight months, and durable goods orders rose by 0.9% in February. Industrial production grew by 1.4% year-over-year, and private sector jobs increased by 151,000 in February. The unemployment rate stayed at 4.1%, with jobless claims near 224,000.
- Corporate America maintains strong earnings and margins.
- Balance sheets remain durable, and cost management is effective.
- Hard data like employment and retail sales support a positive outlook.
S&P 500 companies now trade at about 22.43 times forward earnings, well above the historical average. This shows that many investors expect continued growth.
Wall Street Forecasts
Wall Street uses advanced tools to predict market trends. Analysts rely on mathematical models, trend analysis, and momentum indicators like RSI and MACD. Algorithms scan historical data to spot patterns and forecast future moves. Risk assessments help traders measure possible losses and plan strategies such as hedging or diversification.
Modern risk management combines quantitative analysis with expert judgment. Firms use big data and machine learning to improve their stock market forecast accuracy. However, experts note that no model can predict every market move, so they update their strategies as conditions change.
Lessons from History

Image Source: unsplash
Past Crashes
History shows that major market crashes often follow periods of overvaluation, speculation, or external shocks. Investors can learn from these events by studying the numbers and patterns. The table below highlights some of the most significant market crashes and their impact on the Dow Jones Industrial Average and related indices:
| Market Crash/Event | Key Numerical Data & Context |
|---|---|
| 1929 Stock Market Crash | Stock market lost 89% of its value over several years, leading to a decade-long downturn. |
| Black Monday (1987) | DJIA dropped 22.6% in a single day; DJIA had risen over 40% in months prior, showing overvaluation risks. |
| Dot-com Bubble (1999-2000) | NASDAQ peaked at 5,132.52 before crashing, illustrating the impact of speculative bubbles on market indices. |
These events reveal that sharp declines can erase years of gains quickly. Market crashes often result from a mix of economic, financial, and psychological factors. For example, the 1987 crash followed a period of rapid gains, while the dot-com bubble burst after years of speculation in technology stocks.
Investor Takeaways
Investors have developed strategies and learned important lessons from past crashes. Quantitative analysis helps explain why some strategies work better than others. Key takeaways include:
- Defensive equity strategies, such as focusing on low-volatility or profitable companies, often perform better during downturns.
- Profitability stands out as a dominant factor in explaining returns and pricing market anomalies.
- Quantitative metrics like alpha, beta, and the Sharpe ratio help investors measure risk and reward.
- Studies show that average equity mutual fund investors underperformed the S&P 500 by about 8.19% per year.
- Behavioral biases, such as regret aversion and overconfidence, lead to poor timing and excess trading costs.
- Investors who focus on strong profitability metrics and avoid emotional decisions tend to achieve better long-term results.
Investors who study history and use both quantitative and qualitative insights can improve their decision-making and reduce the risk of large losses.
Investors remain divided on the outlook for the DJIA crash, with many citing persistent inflation, global tensions, and complex financial disclosures as key risks. Most investors shift to defensive assets or use hedging strategies, while some see opportunities in market volatility. Experts note that advanced forecasting models and strong internal controls can help reduce crash risk. Machine learning and dynamic models now improve predictions and support better risk management. Investors should ask, “How will my strategy hold up if another downturn hits?”
FAQ
What causes the DJIA to crash?
Many factors can trigger a DJIA crash. Economic downturns, high inflation, rising interest rates, and geopolitical conflicts often play a role. Investor panic and rapid selling can make losses worse. Analysts watch these risks closely.
How do investors protect their portfolios during market crashes?
Investors often move funds into safer assets like bonds or cash. Some use hedging strategies, such as buying options. Diversification across sectors and asset classes helps reduce risk. Many investors rebalance portfolios to maintain stability.
Can a DJIA crash be predicted?
No one can predict a crash with certainty. Analysts use economic indicators, technical analysis, and sentiment surveys to spot warning signs. Models improve forecasts, but unexpected events can still surprise the market.
What should investors do if the DJIA drops sharply?
Investors should stay calm and avoid panic selling. Reviewing long-term goals and maintaining a diversified portfolio helps manage risk. Many experts suggest consulting a financial advisor before making big changes.
How does a DJIA crash affect the global economy?
A DJIA crash can lower investor confidence worldwide. Global markets may fall as well. Companies may cut spending or hiring. International trade and investment can slow, especially if the crash signals a recession.
Navigating the rising risks of a DJIA crash demands a platform that offers flexibility and cost efficiency to protect and grow your investments. BiyaPay provides a multi-asset wallet, enabling free conversions between USDT and over 200 cryptocurrencies into fiat currencies like USD or HKD, eliminating costly exchange fees during volatile markets. With remittance fees as low as 0.5%, you can swiftly rebalance your portfolio to safer assets like bonds or cash without high costs. Its secure platform and one-minute registration empower you to act decisively amid market uncertainty. Ready to safeguard your investments? Join BiyaPay today and stay resilient in turbulent times!
*This article is provided for general information purposes and does not constitute legal, tax or other professional advice from BiyaPay or its subsidiaries and its affiliates, and it is not intended as a substitute for obtaining advice from a financial advisor or any other professional.
We make no representations, warranties or warranties, express or implied, as to the accuracy, completeness or timeliness of the contents of this publication.


Contact Us
Company and Team
BiyaPay Products
Customer Services


is a broker-dealer registered with the U.S. Securities and Exchange Commission (SEC) (No.: 802-127417), member of the Financial Industry Regulatory Authority (FINRA) (CRD: 325027), member of the Securities Investor Protection Corporation (SIPC), and regulated by FINRA and SEC.
registered with the US Financial Crimes Enforcement Network (FinCEN), as a Money Services Business (MSB), registration number: 31000218637349, and regulated by FinCEN.
registered as Financial Service Provider (FSP number: FSP1007221) in New Zealand, and is a member of the Financial Dispute Resolution Scheme, a New Zealand independent dispute resolution service provider.