- EasyCard
- Trade
- Help
- Announcement
- Academy
- SWIFT Code
- Iban Number
- Referral
- Customer Service
- Blog
- Creator
Why Experts Are Worried About a Stock Market Crash in 2025


Image Source: pexels
Experts express concern about a possible stock market crash in 2025 due to several major risks. These include inflation, excessive leverage, speculation, asset bubbles, sudden policy changes, and global tensions. History shows how market crashes can cause sharp declines, as seen below:
| Event / Metric | Numerical Evidence / Statistic | Significance / Interpretation |
|---|---|---|
| 1987 Stock Market Crash | S&P 500 trading at 23 times earnings | Well above postwar average of 14.5 times earnings, indicating overvaluation concerns |
| 2008 Financial Crisis (BSE Sensex) | Decline from over 21,000 points to below 8,000 points | Illustrates the sharp magnitude of market crashes |
Understanding these risks matters because inflation and uncertainty can quickly change investor behavior. When will the stock market crash remains unknown, but past data shows how quickly a crash can unfold. Investors must prepare to manage risk and protect their portfolios.
Key Takeaways
- High inflation, excessive borrowing, and speculation increase the risk of a stock market crash.
- Investors should watch for warning signs like falling stock breadth, yield curve inversion, and rising credit spreads.
- Panic selling and negative media coverage can worsen market drops and increase volatility.
- Diversifying investments and keeping some cash or bonds can help protect portfolios during a crash.
- Staying informed, avoiding panic, and planning ahead give investors more control in uncertain times.
Risk Factors for a Stock Market Crash
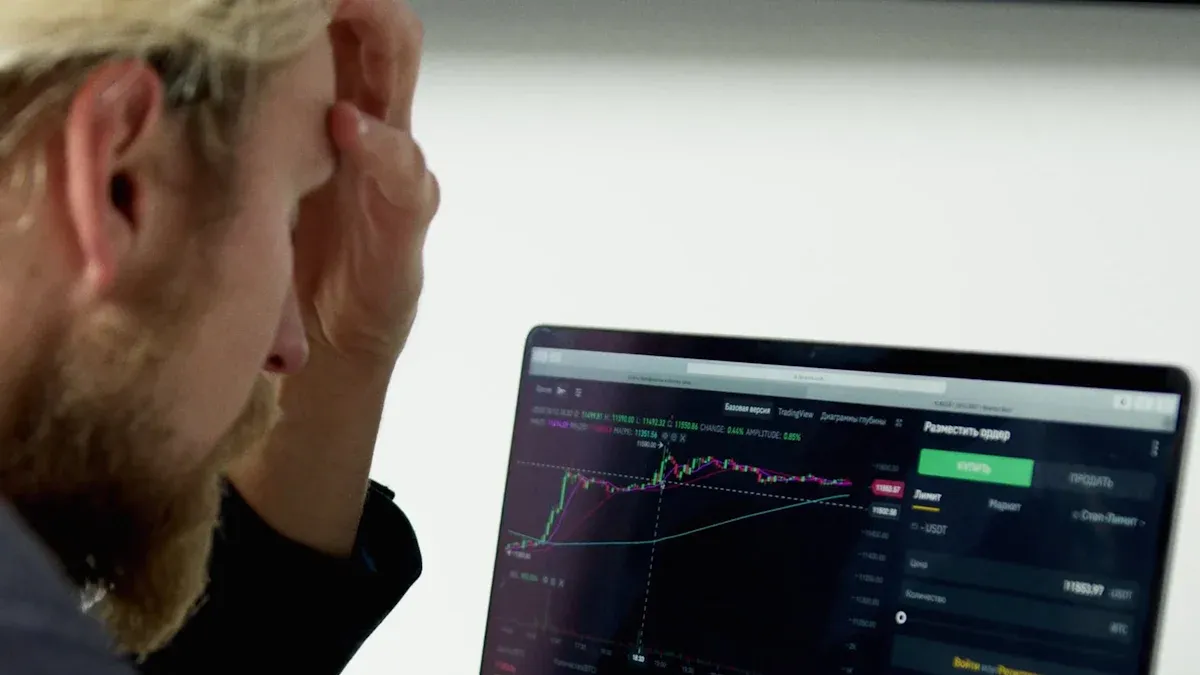
Image Source: pexels
Inflation and Interest Rates
Inflation stands as one of the most important risk factors for a stock market crash. When inflation rises, the cost of goods and services increases. This change can hurt both consumers and companies. High inflation often leads central banks to raise interest rates. Higher interest rates make borrowing more expensive for businesses and families. As a result, companies may cut back on investments, and consumers may spend less. These actions can slow down the economy and reduce company profits.
Historical data since the 1930s shows that almost every country experienced its worst real stock returns during periods of high inflation. Real returns on the S&P 500 are highest when inflation stays between 2% and 3%. When inflation moves outside this range, it signals macroeconomic problems that can lower stock returns. Higher inflation usually leads to lower equity valuations and more stock market volatility. Growth stocks often suffer more when interest rates rise, while value stocks sometimes perform better during high inflation periods. Inflation increases market uncertainty, reduces consumer spending, and squeezes corporate profits. These effects can lead to greater volatility and lower returns, increasing the chance of a crash.
Note: Inflation not only affects the stock market but can also trigger a recession. When inflation remains high, the risk of a market downturn grows.
Excessive Leverage and Margin Trading
Excessive leverage means investors borrow money to buy more stocks than they can afford with their own funds. Margin trading allows this borrowing. When too many investors use leverage, the market becomes fragile. If stock prices fall, investors must sell quickly to pay back loans. This selling can cause prices to drop even more, leading to a crash.
Recent studies from China’s stock market show that margin-buying activity and margin debt alone do not predict a future stock market crash. However, margin-trading volatility, measured by the monthly standard deviation of daily margin-buying relative to trading volume, strongly predicts higher crash risk. This volatility increases arbitrage risk and discourages investors from correcting overpriced stocks. As a result, mispricing can persist, making a crash more likely. Historical market crashes, such as the 1987 U.S. crash and the 2015 Chinese market meltdown, show how excessive leverage and margin trading can destabilize the market.
- Margin-trading volatility leads to greater stock overpricing.
- Information content of stock prices decreases with higher margin-trading volatility.
- Robust statistical methods confirm these findings, even after controlling for other factors.
Speculation and Asset Bubbles
Speculation happens when investors buy stocks hoping to sell them at higher prices, rather than because the companies have strong business prospects. When speculation grows, it can create asset bubbles. A stock market bubble forms when prices rise far above the real value of companies. These bubbles can burst suddenly, causing a crash.
Researchers use models inspired by physics to measure asset bubbles and speculative behavior. For example, the Japanese stock market bubble from 1987 to 1992 showed how strong bandwagon effects and a favorable investment environment led to a bubble. When the environment changed, the bubble burst, and the market crashed. These models help explain how speculation and bubbles can cause sudden shifts from bull markets to bear markets.
Tip: Investors should watch for signs of speculation, such as rapid price increases without strong company earnings. Bubbles often end with sharp declines and can trigger economic crises.
Geopolitical and Economic Uncertainty
Geopolitical events and economic uncertainty can also lead to a stock market crash. Wars, political conflicts, and sudden changes in government policy can shake investor confidence. For example, the Iranian Revolution in 1979 and Iraq’s invasion of Kuwait in 1990 caused oil prices to spike and increased market volatility. While these events may not always cause a recession, they can make the market more unstable.
Empirical studies show that geopolitical risks and economic uncertainties have measurable effects on markets. For instance, research on Vietnam’s stock market found that economic policy uncertainty had a stronger effect on market volatility than geopolitical risk. During the COVID-19 pandemic, foreign economic policy uncertainty had a bigger impact, while during the Russo-Ukrainian conflict, foreign geopolitical risk dominated. These findings highlight how different types of uncertainty can affect markets during downturns.
Block Quote: “Economic policy uncertainty negatively impacts investment, growth, and stock prices, and contributes to volatility in natural resource rents, demonstrating statistically measurable effects of geopolitical and economic uncertainties on markets during downturns.”
Table: Historical Crashes and Risk Factors
| Aspect | Evidence | Explanation |
|---|---|---|
| Dow Jones Peak | 381 points in September 1929, 10x value at start of 1920s | Extreme market overvaluation and speculative bubble |
| Speculation Practices | Buying on margin with small down payments and borrowed money | Easy credit and risky behavior increased market vulnerability |
| Warning Signs Ignored | Market downturn on Sept 18, 1929; London Stock Exchange collapse Sept 20 | Early indicators of instability were ignored |
| Black Thursday | NYSE lost 11% of value on Oct 24, 1929 | Start of panic selling and market collapse |
| Bank Intervention | Major banks bought blue chip stocks to stabilize prices | Efforts to prevent crash showed severity of panic |
| Public Optimism | Hoover’s assurances and NYSE party on last trading day of 1929 | Psychological factors and misplaced confidence contributed to risk |
| Real Estate Speculation | Land booms in California and Florida fueled by easy credit | Parallel speculative bubbles increased overall economic risk |
| Stock Market Value Drop | Lost over half its value between Sept-Nov 1929 ($64B to $30B USD) | Rapid and massive loss in market capitalization signaled crash severity |
| Unemployment Increase | Tripled from 1.5M to 4.5M by end of 1930 | Economic fallout and job losses triggered by crash |
| Banking Failures | Over 90% of banks invested in market; thousands closed | Systemic banking risk and contagion effects worsened crash impact |
| Income Distribution | 80% of families had no savings; 0.5-1% controlled over a third of wealth | Poor income distribution limited new market buyers, worsening crash dynamics |
| International Debt Issues | Post-WWI debts and reparations strained US banks | External economic pressures contributed to domestic market vulnerability |
| Panic Contagion | Rapid spread of selling due to fear | Psychological risk factors amplified the crash |
| Industry Collapse | Automotive and construction industries hit, production plummeted | Real economy consequences and feedback loops worsened crash aftermath |
These examples from historical crashes show how inflation, leverage, speculation, bubbles, and uncertainty can combine to create a perfect storm. When these market risks build up, the chance of a stock market crash increases. Investors should learn from the past and stay alert to these warning signs to protect their investments and avoid the worst effects of economic crises.
When Will the Stock Market Crash?
Warning Signs to Watch
Many investors ask, “when will the stock market crash?” Experts agree that predicting the exact timing of a crash is very difficult. Crashes are rare events. In almost 60,000 days of market data, only 76 crashes have been recorded. This makes it hard for even advanced computer models to spot early signals. These models often give false alarms or miss real crashes. No single pattern or signal can predict every crash.
Still, some warning signs have appeared before past downturns:
- Declining stock market breadth, where fewer stocks rise while the market climbs, often peaks before prices fall.
- Yield curve inversion, when short-term interest rates rise above long-term rates, has signaled every recession since the 1960s.
- Widening credit spreads, which show lenders demand more reward for risk, often come before a crash.
- Labor market signals, like a sudden rise in unemployment, can warn of trouble.
- Persistent drops in leading economic indicators, such as The Conference Board’s LEI, often come before a downturn.
- High leverage, sky-high valuations, and overconfident stories that “this time is different” have all appeared before major crashes.
Note: These signs often act as a slow warning, not an immediate alarm. Investors should watch for several signals at once.
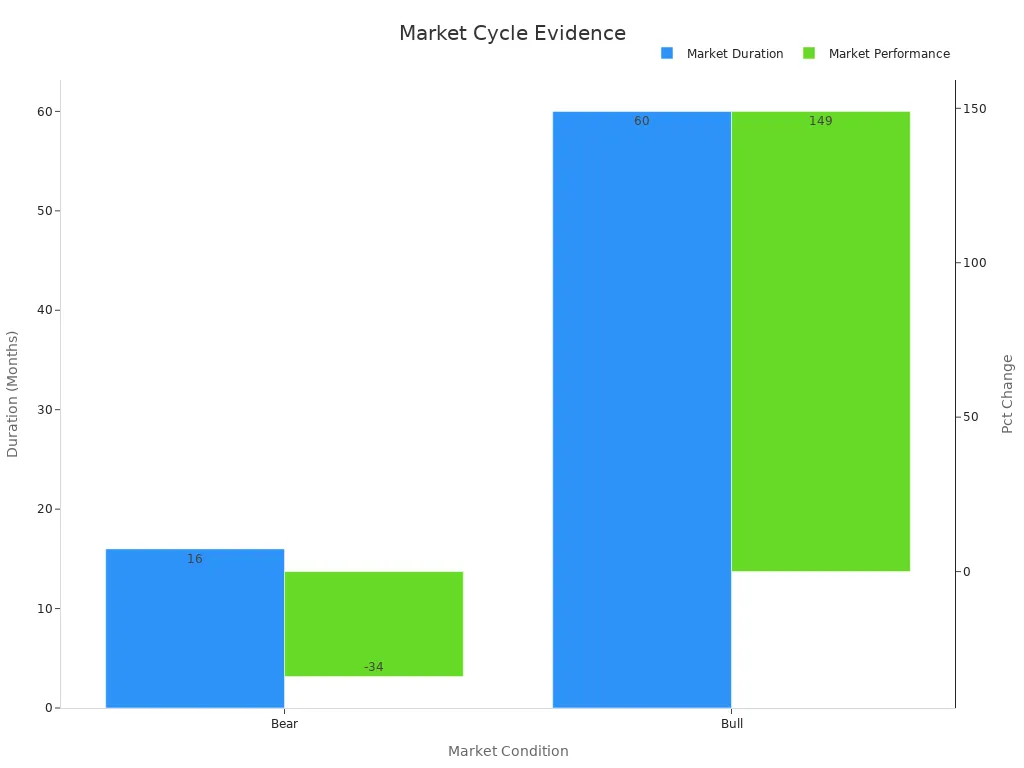
Market Cycles and Timing
The question “when will the stock market crash” comes up most often after long bull markets. History shows that risk builds up during these periods. Bull markets, on average, last about five years and bring gains of 149%. Bear markets, which follow, last about 16 months and see prices drop by 34%. The market moves through four main phases: accumulation, mark-up, distribution, and decline.
Periods with high valuations and overconfidence have led to average losses of 40-50% per year. Even the best models cannot say exactly when the next stock market crash will happen. Each crash is unique, and warning signs do not always appear in the same way. Investors should focus on managing risk and understanding market cycles, rather than trying to predict the exact moment of a crash.
Uncertainty and Investor Behavior
Panic Selling and Volatility
Panic selling often happens when investors react quickly to bad news or sudden drops in the market. This behavior can lead to a crash, as many people rush to sell their stocks at the same time. During the 2008 financial crisis, the S&P 500 fell by about 57% from its highest point. In March 2020, the COVID-19 pandemic caused the S&P 500 to drop over 30% in just a few weeks. These events show how panic selling can create sharp, short-term volatility and make a crash worse.
Researchers have found that overconfident investors are more likely to panic sell, which increases market volatility. A study from Japan during the COVID-19 pandemic used survey data and probit regression models to show that panic selling leads to bigger swings in the market. Investors with higher financial knowledge tend to avoid panic selling, which helps reduce volatility. Behavioral finance theories, such as Prospect Theory, explain why people sometimes overreact to losses and make quick decisions during uncertainty.
Note: Panic selling can turn a small drop into a much bigger crash, especially when many investors act on fear instead of facts.
The Role of Media and Sentiment
Media coverage plays a big role in shaping investor behavior during times of uncertainty. When news reports focus on negative events, investor sentiment can turn pessimistic. During the COVID-19 crisis, studies found that financial journalism became more negative and emotional. This shift in media tone led to more panic selling and risk-averse actions by investors.
Sentiment analysis shows that when media reports become more negative, investors often expect the market to fall. This can create a feedback loop, where negative consumer sentiment and media coverage lead to more selling and higher volatility. The Media Coverage Index (MCI) tracks how much news affects stock returns. During a crash, sectors like healthcare and energy often feel the most impact.
- Key patterns in investor behavior during uncertainty include:
- Disposition effect: Holding losing stocks too long.
- Flight to safety: Moving money to safer assets.
- Herding: Copying what most investors do.
- Overreaction: Making big moves after bad news.
These patterns show how uncertainty, panic selling, and negative sentiment can combine to trigger or worsen a crash.
Financial Crisis: Impact on Investors
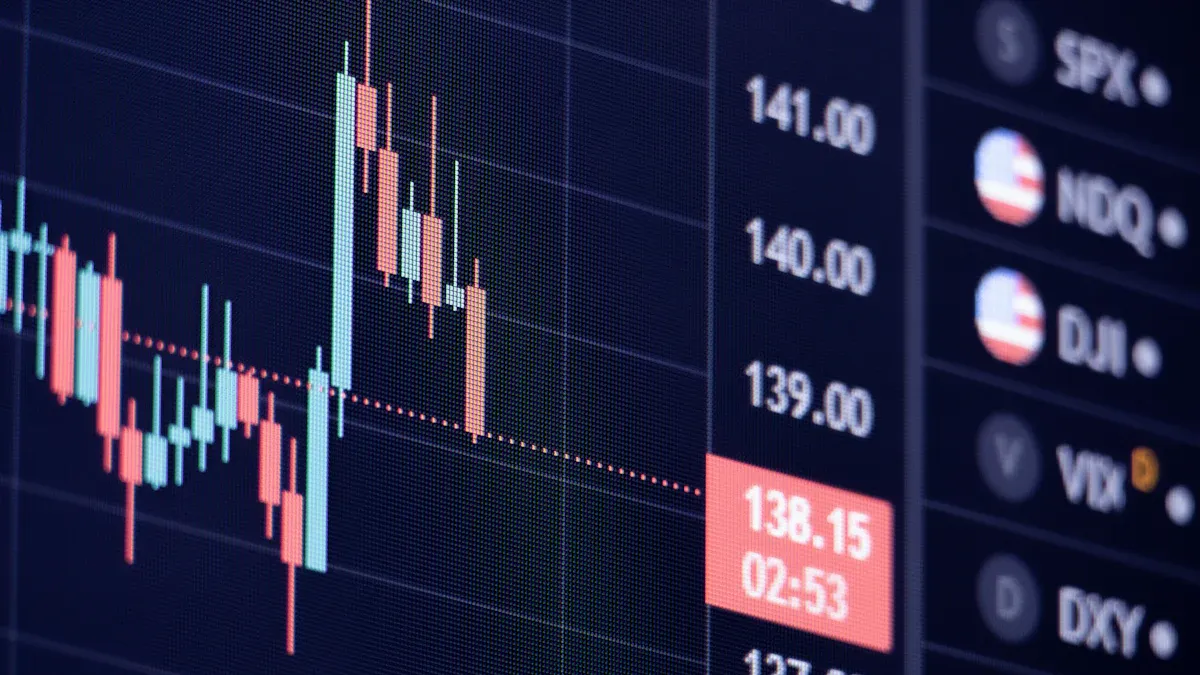
Image Source: unsplash
Portfolio Losses and Economic Effects
A stock market crash can cause large losses for investor portfolios and retirement accounts. During a crash, stock prices often fall quickly. Investors may see the value of their holdings drop by 10% or more in a short time. For example, the 2008 global financial crisis led to a sharp collapse in capital flows across 75 countries. Investors moved money out of risky assets and into safer ones, which changed the size and type of investments worldwide. This shift made the economy more unstable and slowed down growth.
Institutional investors, such as insurance companies, also changed their strategies during a crisis. When they faced losses, they sold risky bonds and bought safer securities. This behavior helped them avoid more losses but also made the effects of a crash spread faster through the economy. The 2007-2008 crisis showed how stock prices dropped in many countries at the same time. Investors moved their money to government bonds, which caused more problems for the stock market and the global economy.
| Catalyst Type | Description | Representative Historical Events and Data Points |
|---|---|---|
| Macroeconomic | Economic downturns including recessions, credit cycle phases, tight monetary policy, etc. | 1973 oil crisis causing stagflation and recession; 2008 global financial crisis. Largest and longest sell-offs with prolonged recovery periods. |
| Fundamental | Earnings revisions and valuation changes due to shifts in investor sentiment or earnings surprises. | 2000 dot-com bubble burst. Moderate drawdowns with intermediate recovery times. |
| Leverage/Liquidity | Price-driven dislocations from leverage, liquidity cascades, momentum shifts. | 1998 Long-Term Capital Management collapse; 2018 volatility spike. Smaller but faster market impacts. |
| Noneconomic | Exogenous, unpredictable events such as geopolitical shocks or disasters. | 2001 9/11 attacks; 2020 COVID-19 pandemic. Rapid losses with swift recoveries. |
These examples show that the effects of a crash can last for years. Some investors waited more than a decade to recover their losses after major downturns. The economy can also suffer from lower growth and higher unemployment after a financial crisis.
Steps to Protect Your Investments
Investors can take steps to reduce the risk of losses during a stock market crash. First, they can focus on income-generating assets, such as stocks that pay dividends. These companies often have strong business models and can handle tough times better. Second, diversifying across different asset classes, like bonds and alternative investments, can help protect a portfolio. Investors should also look for strategies that do not move in the same direction as the stock market, such as market-neutral or absolute return funds.
Tip: Keeping some cash or short-term bonds in a portfolio can provide flexibility during a crisis.
Investors can use real-time data and analytics to track their investments and spot early warning signs. Developing a plan for different scenarios helps them act quickly if a crash happens. Staying informed and reviewing investment goals regularly can also reduce the effects of a crash. By following these steps, investors can better manage risk and protect their savings during periods of economic uncertainty.
Experts see several reasons for concern about a stock market crash in 2025. High inflation, too much leverage, and speculation all increase the risk of a crash. Geopolitical events and sudden changes in policy can also trigger a stock market crash. Investors should stay alert and review their plans often. Seeking advice from professionals can help reduce the impact of a crash. Preparation gives investors more control during times of risk.
FAQ
What causes a stock market crash?
Many factors can cause a crash. High inflation, too much borrowing, and speculation often play a role. Geopolitical events and sudden policy changes can also trigger sharp drops in stock prices.
How can investors spot early warning signs?
Investors can watch for signals like falling stock market breadth, yield curve inversion, and rising credit spreads. These signs often appear before a downturn. Staying informed helps investors react quickly.
What should investors do during a crash?
Investors should avoid panic selling. They can review their portfolios and focus on long-term goals. Diversifying assets and keeping some cash or short-term bonds can help reduce risk.
How long does it take to recover from a crash?
Recovery times vary. Some markets bounce back in months. Others take years. For example, after the 2008 crisis, some investors waited over five years to recover losses.
Does a crash affect only stocks?
No. A crash can impact bonds, real estate, and other assets. The effects can spread to the whole economy, causing job losses and lower growth.
Tip: Staying calm and informed helps investors make better decisions during uncertain times.
With experts warning of a 2025 stock market crash driven by inflation, leverage, and speculation, preparing for volatility is crucial.BiyaPay’s multi-asset wallet offers free conversions between USDT and over 200 cryptocurrencies into fiat currencies like USD or HKD, helping you sidestep high fees during market turmoil. With remittance fees as low as 0.5%, you can shift to safer assets like bonds or gold to shield your portfolio. Its secure platform and one-minute registration enable quick, rational moves to avoid panic selling. Stay ahead of market risks—Join BiyaPay today to protect and diversify your investments!
*This article is provided for general information purposes and does not constitute legal, tax or other professional advice from BiyaPay or its subsidiaries and its affiliates, and it is not intended as a substitute for obtaining advice from a financial advisor or any other professional.
We make no representations, warranties or warranties, express or implied, as to the accuracy, completeness or timeliness of the contents of this publication.


Contact Us
Company and Team
BiyaPay Products
Customer Services


is a broker-dealer registered with the U.S. Securities and Exchange Commission (SEC) (No.: 802-127417), member of the Financial Industry Regulatory Authority (FINRA) (CRD: 325027), member of the Securities Investor Protection Corporation (SIPC), and regulated by FINRA and SEC.
registered with the US Financial Crimes Enforcement Network (FinCEN), as a Money Services Business (MSB), registration number: 31000218637349, and regulated by FinCEN.
registered as Financial Service Provider (FSP number: FSP1007221) in New Zealand, and is a member of the Financial Dispute Resolution Scheme, a New Zealand independent dispute resolution service provider.