- EasyCard
- Trade
- Help
- Announcement
- Academy
- SWIFT Code
- Iban Number
- Referral
- Customer Service
- Blog
- Creator
Essential Insights for Investors on Today’s Dow Jones Downturn


Image Source: pexels
You may feel worried about the drop in the stock market today, especially if you follow the dow closely. Many investors see large swings and wonder why dow jones down today. Market volatility happens often and has clear patterns.
- Historical data shows that future declines in the S&P 500 can range from 5% to 55%.
- Big stocks that lead the market often fall by 50% about 80% of the time during a drop, and by 80% from their peak about half the time.
The table below shows that different events, like changes in the economy or sudden world news, have caused similar downturns before:
| Catalyst Type | Description | Historical Examples and Figures |
|---|---|---|
| Macroeconomic | Economic downturns, recessions, tight monetary policy, rising interest rates | 1946 Postwar transition, 1973 Oil Crisis, 2008 Global Financial Crisis |
| Fundamental | Earnings changes, shifts in investor sentiment | 1961 Kennedy Slide, 2000 Dot-com bubble burst |
| Leverage/Liquidity | Price-based dislocations, liquidity events | 1980 silver sell-off, 2018 volatility spike |
| Noneconomic | Unpredictable events, fast losses, quick recoveries | 2001 9/11 attacks, 2020 COVID-19 pandemic |
You are not alone in your concerns. Staying informed and calm helps investors make better decisions during uncertain times.
Key Takeaways
- The Dow Jones dropped today due to a mix of Federal Reserve policies, inflation concerns, rising oil prices, and global tensions.
- Market drops happen often but usually recover over time, so staying calm and avoiding emotional decisions helps protect your investments.
- Long-term investing with regular portfolio reviews and steady assets can reduce risk and improve returns during market ups and downs.
- Economic data shows some recession risks, but the market often bounces back from volatility without turning into a crisis.
- Understanding market patterns and focusing on your goals helps you make smarter choices and benefit from the market’s long-term growth.
Why Dow Jones Down Today?

Image Source: unsplash
You may wonder why dow jones down today. Several important factors have come together to cause the recent drop. Understanding these reasons can help you make sense of the stock market today and avoid reacting out of fear.
Fed Policy and Inflation
The Federal Reserve plays a big role in shaping how the market moves. When the Fed changes its policies, you often see quick reactions in the dow and other indexes. Right now, the Fed has kept its main interest rate steady at 4.25% to 4.50% as of May 2025. This follows a series of rate cuts in late 2024, but the Fed still keeps its policy tight to fight inflation.
The Fed’s latest forecast shows inflation staying above its 2% target, with core inflation expected to reach 2.8% in 2025. This makes investors nervous because high inflation can hurt company profits and slow down the economy.
You also see the Fed taking a “wait and see” approach. Chair Jerome Powell says the Fed needs more data before making new moves, especially with tariffs and trade issues adding uncertainty. When the Fed signals caution, the market often reacts with more volatility.
- A one-percentage point increase in recession odds links to a 70-basis-point drop in stock prices. This relationship is not always even, so sharp jumps in recession risk can cause bigger market swings.
- Since early 2023, most recession signals have faded, but the yield curve still shows some risk. The overall chance of a recession in the next year sits around 20-30%.
- Corporate profits have stayed strong, which helps limit job losses and keeps consumer spending steady.
Geopolitical Tensions
Geopolitical events can shake the market quickly. You saw this recently when tensions between Israel and Iran rose. After Israel’s surprise attacks on Iran, the Dow dropped about 1,000 points in one day. This wiped out the week’s gains and ended a four-day winning streak. Even though consumer sentiment improved, the market focused on the risk from the conflict.
When global conflicts heat up, investors often pull back from stocks and look for safer places to put their money. This “risk-off” behavior can lead to sharp drops in the dow and other indexes.
The situation became even more tense when the U.S. announced military involvement. The Dow then fell below 42,500 points. At the same time, U.S. retail sales dropped by nearly 1% in May, adding more pressure. These events show how quickly outside risks can affect the market and why dow jones down today.
- Trade tensions between the U.S. and China also add to the uncertainty. Weak manufacturing and construction data, along with tariff news, have caused big swings in certain stocks.
- Companies like Target reported lower sales and warned about more trouble ahead due to tariffs. This has made investors worry about shrinking profits and slower job growth.
Oil Prices and Technical Signals
Oil prices have a big impact on the market. When oil gets more expensive, it can raise costs for many companies and slow down economic growth. Right now, oil prices are near record highs. Most moving average signals for oil are bullish, showing strong demand and rising prices.
- WTI Crude Oil shows a bullish trend, with 85.71% of moving average signals pointing up.
- The 100-day moving average shows a bullish reversal, and oil prices have opened higher, signaling strong buying.
Technical analysis also helps explain why dow jones down today. The Dow’s 200-day moving average remains positive, but recent price changes show some weakness. Here is a table showing recent trends:
| Period | Moving Average | Price Change | Percent Change |
|---|---|---|---|
| 5-Day | 42,413.59 | -694.11 | -1.62% |
| 20-Day | 42,357.43 | -505.58 | -1.18% |
| 50-Day | 41,368.16 | +4,206.06 | +11.08% |
| 100-Day | 42,170.66 | -2,252.59 | -5.07% |
| 200-Day | 42,518.51 | +836.61 | +2.02% |
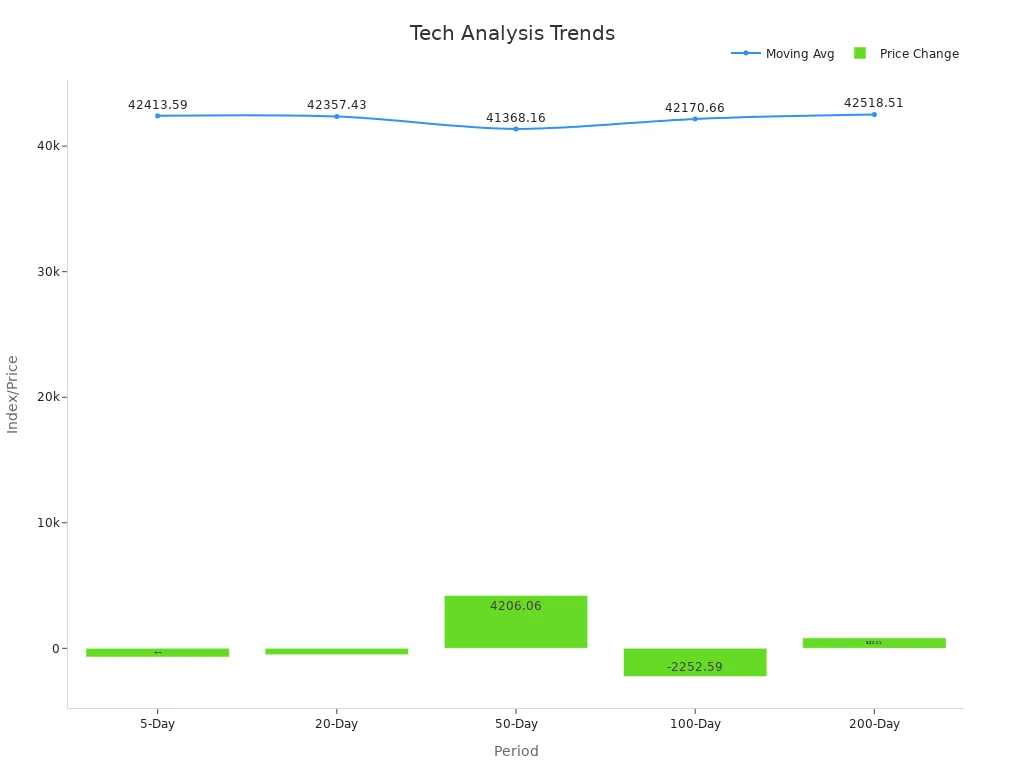
Some technical indicators, like RSI and CCI, show the market may be overbought. This means you could see more short-term drops as investors take profits or react to new risks.
In summary, why dow jones down today? The answer includes the Fed’s cautious stance on inflation, rising geopolitical tensions, and high oil prices. Technical signals also show the market is at a turning point. By understanding these factors, you can make better decisions and avoid panic during market swings.
Market Context
Dow’s Role and Significance
You often hear about the dow jones industrial average when people talk about the stock market. This index tracks 30 large companies in the United States. It acts as a key signal for the market. When the Dow moves up or down, you see headlines and news stories everywhere. Many investors watch the Dow because it shows how the market feels about the economy. Recent studies show that the Dow does more than just track numbers. It shapes how you and other investors act. When the Dow hits a new high, you might feel excited or worried. This can lead to more people selling stocks, which sometimes causes the market to drop the next day. The Dow stands out because it gets more attention than other indexes. This makes it a strong force in the market and helps set the mood for trading.
Historical Recovery Patterns
Market drops can feel scary, but they happen often. You should know that the market has a long history of bouncing back. The table below shows how long it took for the market to recover after different drops:
| Event / Crash Year | Recovery Time to Pre-Crash Level | Notes |
|---|---|---|
| 1929 Crash | 16 years | Longest recovery period in modern history |
| 1987 Crash | 23 months | Relatively quick recovery |
| 1990 Decline | 8 months | Short recovery period |
| 2000 Decline | ~5 years | Moderate recovery time |
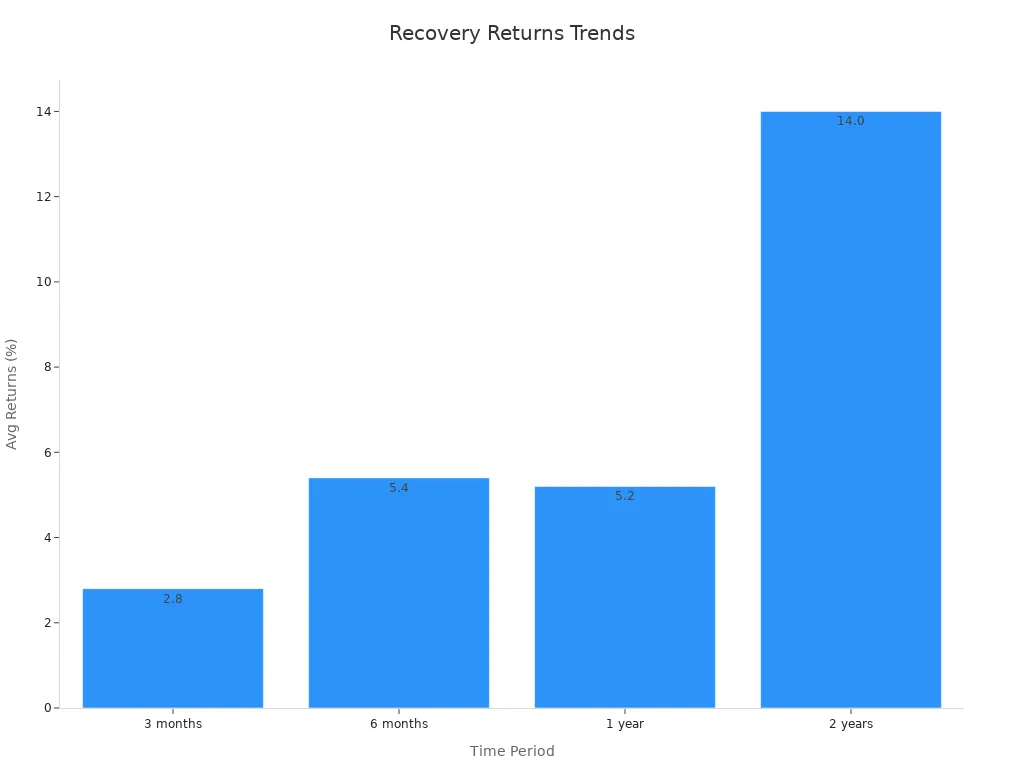
Most market corrections, which are drops of 5% to 10%, last about three months. Bigger drops of 10% to 20% usually take around eight months to recover. If the market falls by about 20% during a recession, it can take one to two years to bounce back. Extreme cases, like the 1929 crash, are rare. You can see that the market often recovers faster than you might expect. This pattern shows why you should stay calm and focus on the long term.
What Investors Should Know Now
Avoiding Emotional Reactions
You may feel the urge to react quickly when you see the market drop. Many investors make decisions based on fear or excitement. This often leads to buying high and selling low, which can hurt your returns. Studies show that investors who let emotions guide their choices underperform the market by more than 3.5% each year. Over time, this gap can mean losing out on nearly $1.3 million on a $100,000 investment.
| Measurable Outcome | Description | Impact on Investor Returns |
|---|---|---|
| Behavior Gap Over 30 Years | Investors who react emotionally underperform the market by over 3.5% annually (1992-2021). | On a $100,000 investment, this gap results in nearly $1.3 million less in returns compared to market performance. |
| 2024 Performance Gap | Average investor return was 16.54% vs. S&P 500’s 25.02%, a difference of nearly 8.5%. | This gap is mainly due to emotional behaviors like buying high and selling low during downturns. |
| Behavioral Biases Impact | Loss aversion causes panic selling during downturns, locking in losses and missing recoveries. Recency bias leads to abandoning strategies at worst times due to pessimism. | These biases contribute to suboptimal decisions and lower long-term returns. |
Tip: Take a step back before making any moves. Review your goals and remember that short-term swings are normal in the market.
Long-Term Strategies
You can use a long-term approach to help you reach your financial goals, even when the market feels uncertain. Reliable financial data, such as SEC filings and company reports, lets you check company health and trends. This helps you make informed choices and stay confident during market volatility.
- Review your portfolio regularly to make sure it matches your goals.
- Rebalance your investments when needed to manage risk.
- Add assets that provide steady cash flow, so you do not have to sell during downturns.
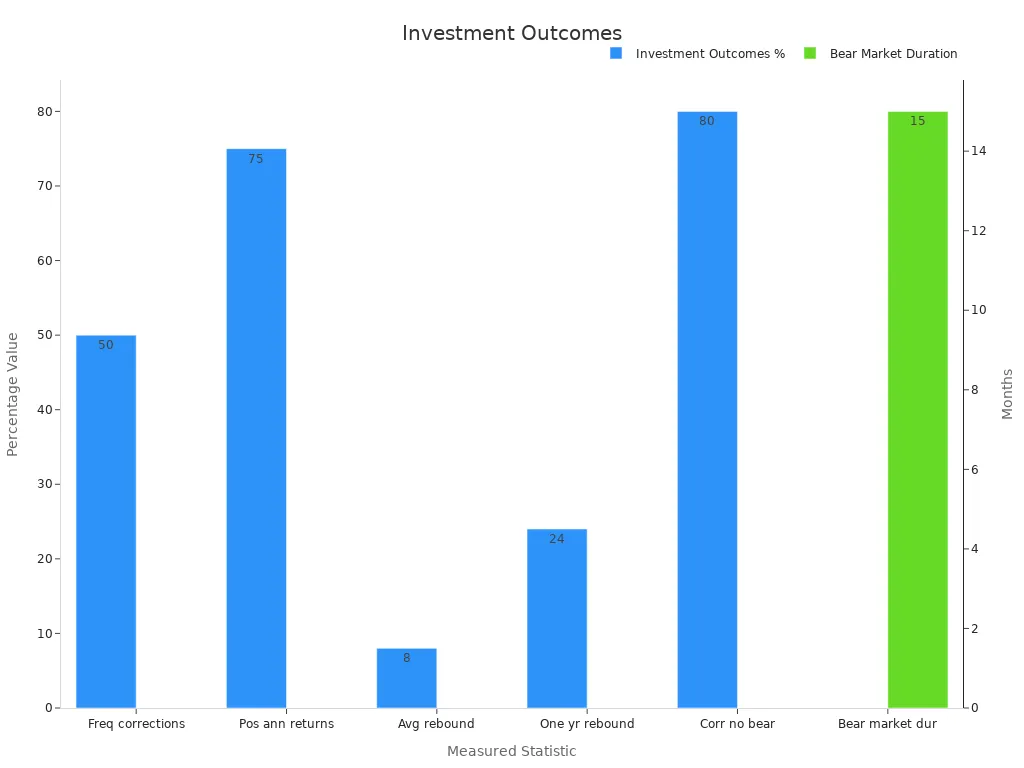
The market often recovers after corrections. In fact, the S&P 500 drops about 14% midyear on average but still posts positive returns nearly 75% of the time. Most corrections do not lead to bear markets. Staying invested through ups and downs has rewarded investors over time.
Remember, what investors should know is that patience and discipline often lead to better results. Use data, keep your plan in mind, and avoid chasing the latest trend. The market will always have ups and downs, but a steady approach helps you reach your goals.
Economic Outlook
Image Source: unsplash
Recession Risks
You may wonder how likely a recession is in the near future. Many experts use a wide range of data to measure this risk. The RSM US Recession Monitor looks at 21 different variables across five areas: financial, labor, housing, industry, and sentiment. Here are some of the key points:
- Financial indicators show tighter lending standards and more equity market swings.
- Housing data reveals fewer permits and starts, with consumer confidence falling.
- The labor market remains steady, with an unemployment rate of 4.2%, but fewer people are quitting their jobs.
- Industrial activity stays strong for now, but lower inventory-to-sales ratios hint at a slowdown.
- Business and consumer confidence are dropping, and more bankruptcies are happening.
Right now, the RSM Monitor puts the chance of a recession in the next year at 55%. J.P. Morgan Research offers a slightly better outlook, lowering the risk to 40% because of easing trade tensions. Still, both sources expect slow growth and caution from the Federal Reserve. You should keep an eye on these trends, as they shape the market and your investment decisions.
Volatility vs. Crisis
You might see big swings in the market and wonder if this means a crisis is coming. It helps to know the difference between normal market volatility and a true economic crisis.
- Studies show that when economic policy uncertainty rises, market volatility goes up and liquidity drops.
- During normal times, policy changes can cause some ups and downs, but the market usually adjusts.
- In a real crisis, like the 2008 global financial crisis, liquidity dries up much more, making it hard to buy or sell assets. This leads to even bigger swings and more risk for everyone.
Market volatility often reflects how investors react to new information or uncertainty. A crisis, however, affects the whole system and can change how the market works for a long time.
You should remember that not every period of market volatility signals a crisis. Most of the time, the market bounces back as uncertainty fades. Staying informed and understanding these patterns can help you make better choices and avoid panic.
You have seen that today’s Dow Jones drop comes from a mix of Fed policy, inflation, and global tensions. Studies show that short-term price swings are less predictable now, so quick reactions rarely help. History proves that markets recover. Bear markets last about 12 months, but bull markets run much longer. The Dow Jones has grown from 679 points in 1959 to over 38,000 points in 2024. Staying calm and focused helps investors benefit from this long-term growth.
Remember, market declines often lead to strong rebounds. Keep your goals in mind and trust in the market’s resilience.
FAQ
Why did the Dow Jones drop today?
You saw the Dow Jones drop because of concerns about inflation, Federal Reserve policy, and rising oil prices. Geopolitical tensions also played a role. These factors made investors nervous and led to more selling in the market.
Should you sell your stocks during a downturn?
You should avoid selling stocks out of fear. History shows that markets often recover. Selling during a drop can lock in losses. Staying invested usually leads to better long-term results.
How long do market corrections usually last?
Most market corrections last about three to eight months. Bigger drops may take longer to recover. You can expect the market to bounce back over time if you stay patient.
What steps can you take to protect your investments?
Review your investment goals. Rebalance your portfolio if needed. Add assets that provide steady cash flow. Avoid making decisions based on emotions. Staying informed helps you make better choices.
Today’s Dow Jones drop, driven by Fed policy, inflation fears, rising oil prices, and global tensions, underscores the need for a steady approach. BiyaPay’s multi-asset wallet supports over 200 cryptocurrencies with free USDT-to-fiat conversions, letting you avoid high fees during market swings. With remittance fees as low as 0.5%, you can quickly shift to stable assets like bonds or gold to safeguard your portfolio. Its secure platform and one-minute registration empower you to act calmly and decisively. Don’t let volatility derail your goals—Join BiyaPay now to manage risks and stay diversified!
*This article is provided for general information purposes and does not constitute legal, tax or other professional advice from BiyaPay or its subsidiaries and its affiliates, and it is not intended as a substitute for obtaining advice from a financial advisor or any other professional.
We make no representations, warranties or warranties, express or implied, as to the accuracy, completeness or timeliness of the contents of this publication.


Contact Us
Company and Team
BiyaPay Products
Customer Services


is a broker-dealer registered with the U.S. Securities and Exchange Commission (SEC) (No.: 802-127417), member of the Financial Industry Regulatory Authority (FINRA) (CRD: 325027), member of the Securities Investor Protection Corporation (SIPC), and regulated by FINRA and SEC.
registered with the US Financial Crimes Enforcement Network (FinCEN), as a Money Services Business (MSB), registration number: 31000218637349, and regulated by FinCEN.
registered as Financial Service Provider (FSP number: FSP1007221) in New Zealand, and is a member of the Financial Dispute Resolution Scheme, a New Zealand independent dispute resolution service provider.