- EasyCard
- Trade
- Help
- Announcement
- Academy
- SWIFT Code
- Iban Number
- Referral
- Customer Service
- Blog
- Creator
How Real Is the Risk of a Market Crash in 2025


Image Source: unsplash
Investors often ask, “will the market crash in 2025?” Many experts see risks, but they also highlight important facts from a market perspective.
- The S&P 500 posted two years of returns above 25%, which is rare and brings some caution.
- Mega-cap technology stocks now trade at a 50% discount to their highest price-to-earnings ratios from the dotcom era.
- Net fund inflows in late 2024 totaled less than $100 billion, far below the $1.2 trillion seen in 2021, showing little sign of euphoria.
These numbers show both uncertainty and opportunities. By staying informed and disciplined, investors can find opportunities even in a changing 2025 market.
Key Takeaways
- Experts disagree on whether the market will crash in 2025, with some warning of high risk and others expecting recovery or normal volatility.
- Economic growth is modest, inflation remains a concern, and trade tensions add uncertainty, but productivity gains and strong corporate profits offer support.
- Watch for warning signs like rising market volatility, falling investor optimism, and weak sector performance to prepare for possible downturns.
- Diversify your investments across different assets and use risk management tools to protect your portfolio during uncertain market conditions.
- Stay disciplined by following a clear investment plan and avoid panic selling to capture long-term market gains despite short-term swings.
Will the Market Crash in 2025?
Expert Views
Many investors want to know: will the market crash in 2025? Experts do not agree on a single answer. Some analysts warn that the risk of a crash remains high. They point to signs like a sharp drop in the S&P 500 during the first quarter of 2025 and a 2.2% annualized GDP contraction, which the Federal Reserve Bank of Atlanta’s GDPNow model reported. Historically, when GDP contracts more than 2%, the S&P 500 has dropped by an average of 45% during those periods. This pattern raises concerns about crashing the market again.
Others take a more cautious market perspective. They see the recent correction—where the S&P 500 fell 14% below its high—as a sign of normal market volatility, not a full-blown crash. These experts note that after similar declines in 2018, the market rebounded with strong gains in 2019. They believe that while volatility is high, the market could recover if economic conditions stabilize.
A third group remains optimistic. They highlight that net fund inflows remain modest, and investor optimism is low, which often means the market is not overheated. They also point out that mega-cap technology stocks trade at lower price-to-earnings ratios than during the dotcom bubble, suggesting less risk of a dramatic market crash.
Note: The S&P 500 experienced its worst quarterly performance since Q3 2022 in early 2025, with a decline of about 4.3%. Major equity indices saw monthly declines in three of the four months starting December 2024. Policy uncertainty reached levels last seen during the early COVID-19 outbreak, according to the St. Louis Federal Reserve.
The table below shows how past GDP contractions have lined up with major market crashes:
| Period | Annualized GDP Contraction | S&P 500 Decline (%) |
|---|---|---|
| Q3 2008 | 2.1% | 57% |
| Q4 2008 | 8.5% | (Included in above) |
| Q1 2009 | 4.5% | (Included in above) |
| Q1 2020 | 5.5% | 34% |
| Q2 2020 | 28.5% | (Included in above) |
The Federal Reserve’s cautious stance and ongoing trade tensions, especially with China, add to the uncertainty. Investors have shifted from favoring growth and momentum stocks to focusing on value, cash flow, and quality. This change signals increased caution and reflects the current market perspective.
Key Disagreements
Experts disagree on several key points when they discuss will the market crash in 2025. Some focus on warning signs like the Buffett Indicator, which reached 191% in March 2025. Warren Buffett has said that a reading near 200% signals high risk. The yield curve spread between 10-year and 3-month U.S. Treasury bonds sits at 0.07%, close to inversion. An inverted yield curve often signals a recession, which can lead to a market crash.
| Indicator / Source | Percentage / Figure | Date | Interpretation / Expert Guidance |
|---|---|---|---|
| Buffett Indicator | 191% | March 2025 | Market is overvalued; near 200% signals high risk (Warren Buffett) |
| Buffett Indicator (favorable) | 70%-80% | Historical | Buying stocks likely to work well (Warren Buffett) |
| Yield Curve Spread (10yr - 3mo) | 0.07% | March 2025 | Close to inversion; historically signals recession risk |
| Investor Optimism (AAII Survey) | 22% | March 2025 | Low optimism among U.S. investors |
| Investor Optimism (AAII Survey) | 53% | July 2024 | Higher optimism compared to March 2025 |
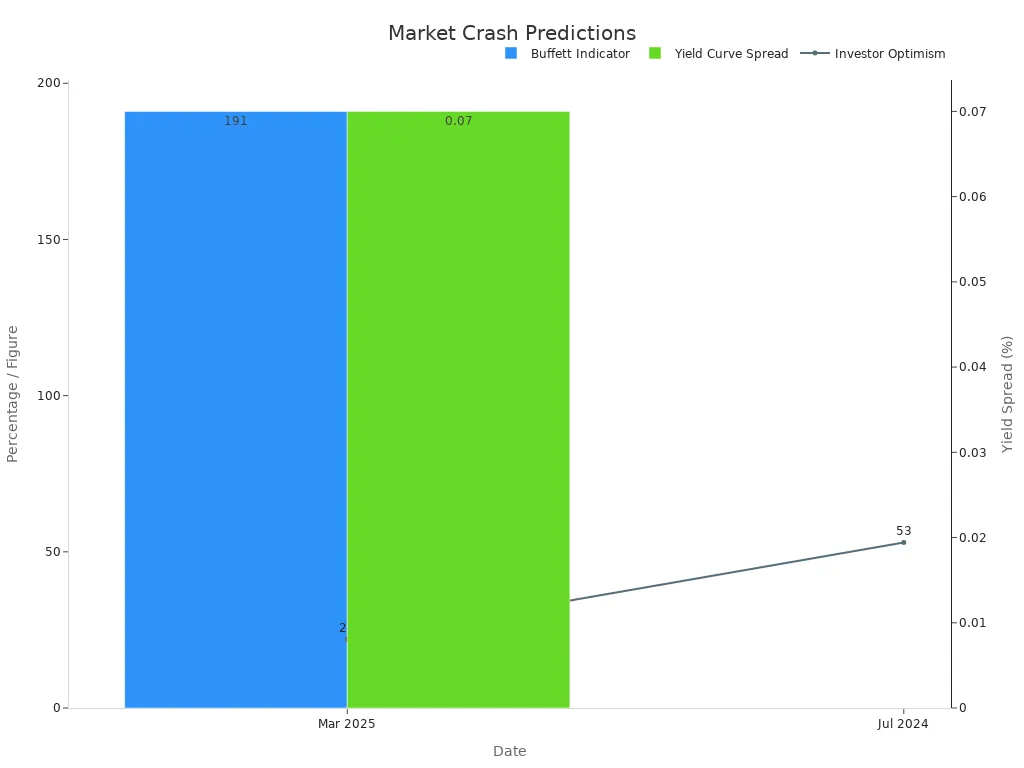
Other experts argue that low investor optimism, as shown by the AAII survey dropping to 22% in March 2025, means the market is less likely to crash. They believe that when most investors feel cautious, the risk of a sudden crash drops. They also point to the lack of euphoria in net fund inflows, which remain far below the levels seen before previous crashes.
Recent market volatility in early 2025 has sparked debate. Some analysts see the shift in investor preferences and the increased correlation of market fluctuations as warning signs. Others view these changes as normal adjustments to new economic and policy realities.
- In 2018, tariff-induced trade tensions caused the S&P 500 to decline by 4.4%. The market rebounded with a 31.5% gain in 2019.
- Early 2025 shows a shift from growth and momentum to value and quality, reflecting investor caution.
- Policy uncertainty in April 2025 spiked to levels seen during the early COVID-19 outbreak.
- The S&P 500 corrected more than 10% from recent highs in Q1 2025, with a quarterly decline of 4.3%.
The question “will the market crash in 2025” does not have a simple answer. Some experts see high risk, while others expect muted market gains or even a rebound. The debate continues as new data emerges and market volatility remains elevated.
2025 Stock Market Outlook
Economic Trends
The 2025 stock market outlook depends on several economic trends. The u.s. economy shows modest growth, with a GDP forecast of 2.0%. The Eurozone expects 0.9% growth, while China projects 4.2%, which is below its historical average. Inflation remains a concern. Persistent inflation comes from fiscal spending and tariff risks, which limit central banks’ ability to cut rates. Productivity gains, especially from artificial intelligence and technology, support long-term economic growth. Rising corporate profits in the u.s. economy come from deregulation and tax relief. U.S. equities remain favored, and stable corporate bond yields attract investors. The strong U.S. dollar, supported by interest rate differences and growth, puts pressure on the euro and yuan. Fiscal policy shifts from monetary to fiscal focus, with both China and the U.S. planning large investments. Market risks include geopolitical tensions, persistent inflation, and expected but manageable volatility.
| Indicator/Theme | Details/Forecasts |
|---|---|
| GDP Growth Forecasts | U.S.: 2.0% (modest growth), Eurozone: 0.9%, China: 4.2% (below historical averages) |
| Inflation Expectations | Persistent inflation due to fiscal spending and tariff risks, limiting central bank rate cuts |
| Interest Rate Outlook | Central banks have less room to cut rates, contributing to market volatility |
| Productivity Trends | Productivity gains driven by AI and technology as a key long-term growth driver |
| Corporate Profit Growth | Rising profits in the U.S. supported by deregulation and tax relief |
| Asset Class Performance | U.S. equities favored; stable corporate bond yields; commodity prices influenced by supply/demand |
| Currency Forecasts | Strong U.S. dollar supported by interest rate differentials and growth; euro and yuan under pressure |
| Fiscal Policy Shift | Movement from monetary to fiscal policy focus, with China and U.S. planning substantial investment |
| Market Risks | Geopolitical risks, inflation persistence, and market volatility expected but manageable |
Policy and Fed Actions
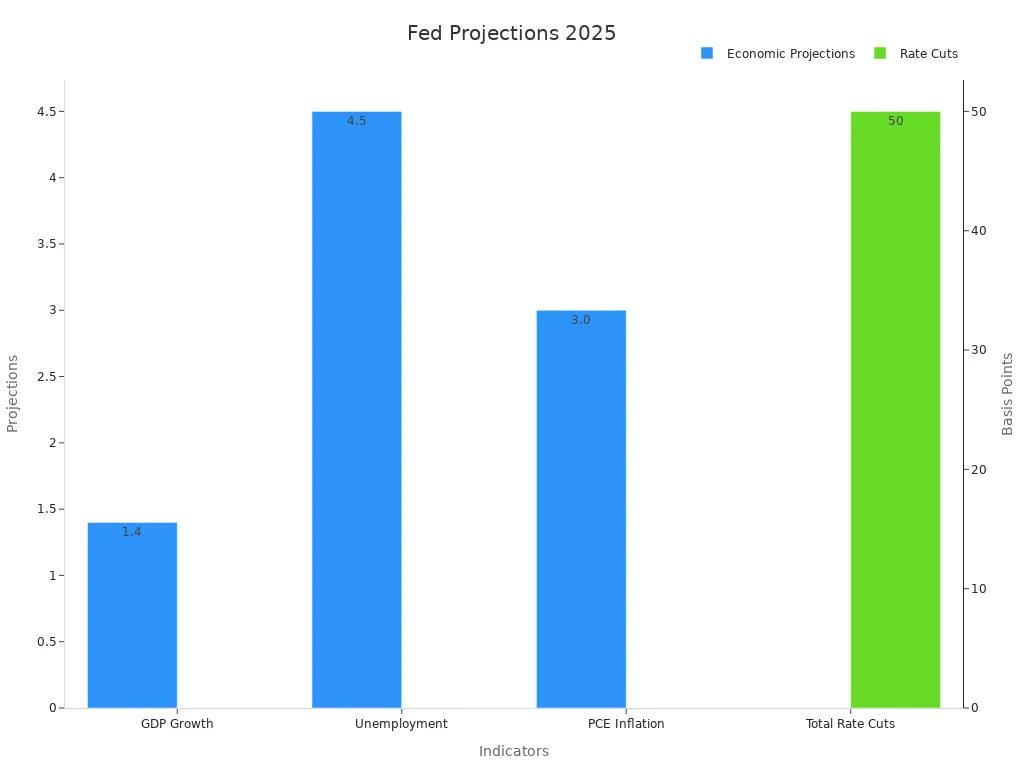
Federal Reserve policy shapes the market in 2025. The Fed kept interest rates steady at 4.25%-4.5% in June. Policymakers expect slower economic growth, with a GDP projection of 1.4%. The unemployment rate may rise to 4.5%, and inflation could reach 3.0%. Some policymakers see no rate cuts, while others expect up to three. Chairman Powell stressed patience, noting that inflation and tariffs create uncertainty. The market expects the first rate cut in September 2025. The U.S. dollar weakened slightly after the Fed’s announcement, showing how sensitive the market is to policy changes.
| Fed Policy and Economic Projections for 2025 | Details |
|---|---|
| Policy Rate (June 2025) | 4.25%-4.5% (unchanged) |
| Total Rate Cuts Projected in 2025 | 50 basis points (bps) reduction |
| GDP Growth Projection (2025) | 1.4% (down from 1.7% in March) |
| Unemployment Rate Projection (2025) | 4.5% (up from 4.4% in March) |
| PCE Inflation Projection (2025) | 3.0% (up from 2.7% in March) |
| Policymaker Views on Rate Cuts in 2025 | 7 see no cuts, 2 see one cut, 8 see two cuts, 2 see three cuts |
| Market Reaction | US Dollar weakened slightly; rate cuts expected starting September 2025 |
| Fed Chairman Powell’s Comments | Emphasized patience amid uncertainty; inflation and tariffs remain key concerns |
Global Factors
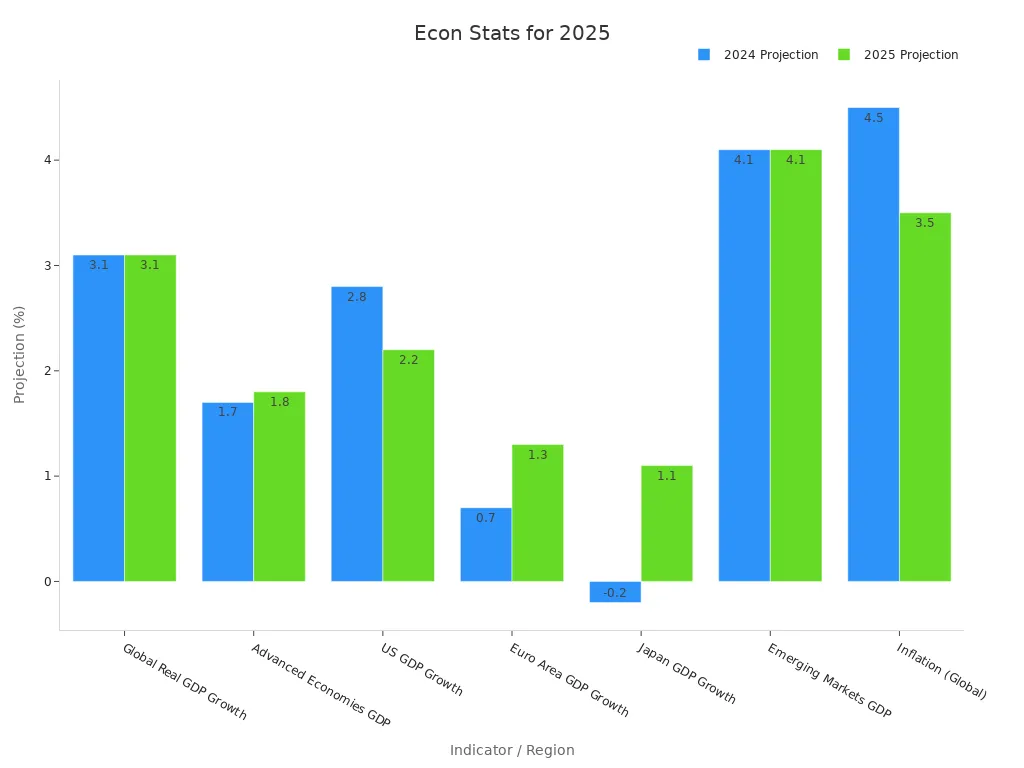
Global economic growth in 2025 remains steady at 3.1%. The u.s. economy leads with 2.2% growth, while the Euro area recovers to 1.3%. Japan rebounds to 1.1% growth, and emerging markets like India show strong domestic demand. Inflation declines globally but stays higher in some regions due to protectionism and geopolitical tensions. Monetary policy varies, with some advanced economies easing and others tightening. Fiscal policy faces challenges from high public debt and social spending. Trade protectionism and geopolitical risks add uncertainty to the market. The performance of stocks depends on these global trends, especially as regions recover at different speeds.
| Indicator / Region | 2024 Projection | 2025 Projection | Notes / Trends |
|---|---|---|---|
| Global Real GDP Growth | 3.1% | 3.1% | Stable global growth with desynchronized regional patterns |
| Advanced Economies GDP | 1.7% | 1.8% | US growth slows slightly; Europe and Japan show modest recovery |
| US GDP Growth | 2.8% | 2.2% | Driven by income, productivity, fiscal and easing monetary policy |
| Euro Area GDP Growth | 0.7% | 1.3% | Recovery supported by income growth, lower interest rates, and trade |
| Japan GDP Growth | -0.2% | 1.1% | Rebound due to wage growth and consumer spending |
| Emerging Markets GDP | 4.1% | 4.1% | China slows to 4.5%; India strong at 6.4%; Latin America mild expansion |
| Inflation (Global) | 4.5% | 3.5% | Declining but risks remain due to protectionism and geopolitical tensions |
| Inflation (Advanced Economies) | N/A | Faster decline | Inflation expected to be controlled sooner than in emerging markets |
| Monetary Policy | Mixed | Desynchronized | Easing in some advanced economies; tightening in some emerging markets |
| US Monetary Policy | N/A | Gradual easing | Fed eases more slowly than ECB; BoJ tightens policy |
| Emerging Markets Monetary Policy | N/A | Mixed | Brazil tightening; China easing; others watch Fed closely |
| Fiscal Policy Challenges | N/A | Elevated debt | Managing debt, social spending demands, energy transition, and geopolitical risks |
| Regional Highlights | N/A | Various | US leads growth; China faces structural challenges; India strong domestic demand; Europe modest recovery |
Risk Factors
Stagflation Threat
Stagflation remains a rare but serious risk for the market in 2025. Since 1947, the United States economy has experienced true stagflation only about 5% of the time, with most cases between 1966 and 1982. During that era, the market faced high inflation and unemployment. The Misery Index, which adds inflation and unemployment rates, stayed high. Unemployment averaged 6%, and inflation reached 6.5%. The Federal Reserve raised interest rates many times, which led to high borrowing costs and market downturns. Today, inflation stands at 3.3% and unemployment at 4%. Experts assign a 20% chance of a stagflation scare in 2025. The current economy benefits from energy independence and better productivity, which lowers the risk of a long stagflation period. Still, if inflation rises while growth slows, the market could see more volatility and even a crash.
Tariffs and Trade
Trade tensions and tariffs continue to affect the market outlook. In 2025, the United States imposed a 25% tariff on Canada and Mexico, with some exemptions under USMCA. Tariffs on Chinese imports increased by 10-20%, and steel and aluminum saw a 25% hike. The table below summarizes key trade and tariff data:
| Aspect | Details |
|---|---|
| 2018-19 Trade War Tariffs | 25% on Canada/Mexico, 10-20% on China, 25% on steel/aluminum |
| 2025 Tariff Escalations | 25% on Canada/Mexico (USMCA exemptions), 10-20% on China, 25% on steel/aluminum |
| Import-weighted Average Tariff Increase | +41 percentage points (varies by country) |
| Retaliatory Measures | EU, China, India imposed tariffs on U.S. goods |
| Economic Impact | Higher consumer prices, more uncertainty, and market instability |
Tariffs raise costs for consumers and companies. Retaliatory tariffs from China and others add to the risk. These actions can slow the economy, increase inflation, and make a market crash or recession more likely.
High Valuations
Many experts worry about high valuations for stocks in 2025. Several metrics show that the market trades at premium levels:
- The Warren Buffett Indicator, which compares the total value of U.S. stocks to the economy, now stands at 200. This is the highest level ever recorded.
- The Shiller PE Ratio is near its peak, only surpassed during the dot-com bubble and before the Great Depression.
These high valuations mean stocks could fall sharply if the economy slows or if inflation rises. High prices make the market more sensitive to shocks, raising the risk of a crash or recession.
Market Crash Warning Signs

Image Source: unsplash
Volatility Patterns
Volatility often acts as an early signal before a downturn. The VIX, also called the “fear gauge,” measures expected volatility in the market over the next 30 days. When the VIX rises above 20, it shows that investors feel anxious and expect more price swings. During major events like the 2008 financial crisis and the 2020 COVID-19 crash, the VIX spiked above 80, reflecting panic. Other measures, such as implied volatility and historical volatility, also help track these patterns. High volatility can signal that stocks face increased risk. The Average True Range (ATR) shows how much stocks move in a day. When ATR rises, it means uncertainty is growing. Volatility often follows cycles—periods of calm can lead to complacency, which sometimes ends with a sharp increase in risk. These patterns help answer the question: will the market crash soon?
Investor Sentiment
Investor sentiment shifts quickly and can warn of trouble. Advanced tools analyze social media, news, and financial reports to classify sentiment as positive, negative, or neutral. These tools, using models like BERT, reach over 97% accuracy. Real-time sentiment analysis allows investors to spot changes in mood across sectors and regions. For example, a sudden drop in positive sentiment about technology stocks may signal rising risk. When sentiment turns negative, stocks often fall as investors sell. Monitoring sentiment helps investors see early signs of market euphoria or fear. If most investors feel cautious, the risk of a crash may drop, but sudden changes can still trigger sharp moves.
Sector Performance
Sector trends often reveal hidden risks before they appear in prices. The Advance-Decline (A/D) Line tracks how many stocks rise versus fall. If the A/D Line weakens while the market climbs, it signals fewer stocks support the rally. This divergence can warn of a coming downturn. Sector rotation, where money moves from one group of stocks to another, also shows changing confidence. High trading volume in defensive sectors, like utilities, may signal investors expect trouble. In past crises, sectors such as wood products and basic metals showed early signs of weakness. High correlation among stocks and narrowing participation in rallies often appear before a crash. These technical signs, along with volatility and sentiment, help investors spot warning signs before the market reacts to inflation or other shocks.
Tip: Watch for rising volatility, sudden sentiment shifts, and weak sector performance. These signs often appear before major downturns and can help answer, “will the market crash in 2025?”
Lessons from Past Crashes

Image Source: pexels
Historical Patterns
Market crashes often follow recognizable patterns. These events usually start with a sharp rally, followed by a warning dip, and then a steep plunge. Volatility spikes during these periods, and technical indicators like RSI divergence and MACD crossovers often appear before the downturn. The VIX, which measures market fear, can rise by 300% to 600% during a crash.
- The 1987 Black Monday crash set a pattern for later events. It showed a rapid rise, a warning drop, and then a sudden fall with high volatility.
- Crash cycles have become shorter, and the swings in prices have grown larger over time.
- Volume trends show quiet selling at first, which then turns into heavy trading as panic spreads.
- Major crashes, such as the 1929 Great Crash, 1987 Black Monday, 2000 dot-com bust, 2008 financial crisis, and 2020 COVID-19 crash, all share these features.
Note: Panic selling, feedback loops from automated trading, and contagion across markets are common in these events. These patterns have shaped how investors and regulators respond to risk.
What’s Different in 2025
The 2025 market downturn stands out for its speed and global reach. Unlike some past crashes, the declines happened quickly across many regions. For example, the TSX in Canada dropped 3.8% in one day and then 4.6% the next, reaching a seven-month low within a week. The Nikkei 225 in Japan lost 7% in a single session, marking its largest drop since March 2020. The S&P/ASX 200 in Australia fell 6% in just 30 minutes. The STOXX Europe 600 lost 8.4% in a week, the worst performance in five years.
| Region/Index | 2025 Crash Decline Details | Comparison to Past Crashes |
|---|---|---|
| TSX (Canada) | 3.8% drop in 24 hours, then 4.6% next day; 7-month low in a week | Largest since 2020 crash |
| KOSPI (Korea) | Fell over 5% | Severe, no direct past % comparison |
| Nikkei 225 (Japan) | 7% loss in one day, lowest since Oct 2023 | Comparable to 2020 crash |
| S&P/ASX 200 (Australia) | 6% drop in 30 minutes on April 7 | Sudden volatility |
| KSE 100 (Pakistan) | 5.29% drop, then 7.31% after trading resumed | Significant volatility |
| STOXX Europe 600 | 8.4% loss in a week, 6% drop next week | Worst week in 5 years |
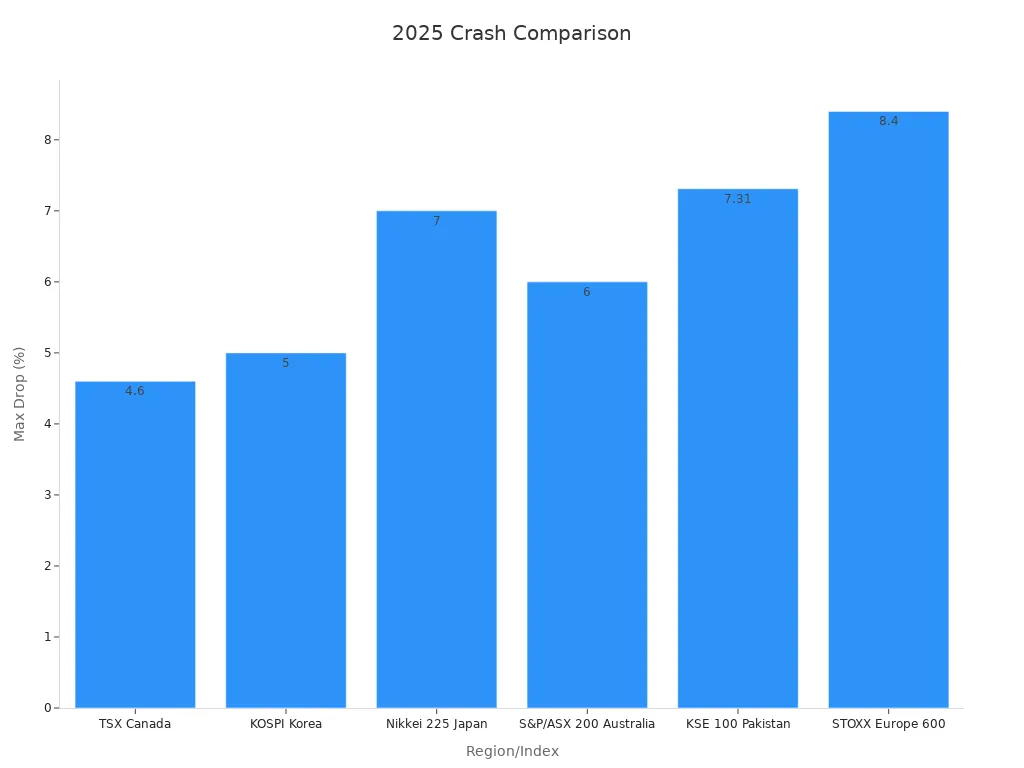
Analysts note that the 2025 crash involved rapid, large drops across many markets. Some declines matched or exceeded those seen in 2020. The scale and speed of these moves highlight new risks in today’s global financial system.
Protecting Your Portfolio
Risk Management
Investors can protect their portfolios by using proven risk management strategies. They often spread investments across different asset classes to reduce unsystematic risk. Modern Portfolio Theory and decades of historical data show that diversified portfolios outperform those focused on a single group of stocks. Investors also use tools like put options and stop-loss orders to limit losses during market downturns. Dividends help preserve capital and add to overall returns. Some choose principal-protected notes for fixed-income protection. Research from Wellington highlights that certain bond sectors, such as high-yield and emerging market debt, can offset the negative impact of rising interest rates. These strategies help investors manage risk when the market becomes volatile.
Tip: Review your risk tolerance regularly and adjust your portfolio as your goals or the market environment changes.
Diversification
Diversification remains a key defense against sharp losses in stocks. During events like the 2008 financial crisis and the COVID-19 pandemic, portfolios that included stocks, bonds, gold, and other assets experienced less volatility and better risk-adjusted returns. The table below shows how different portfolio types performed during major market shocks:
| Portfolio Type | Assets Included | Key Finding | Crisis Periods Examined |
|---|---|---|---|
| Stock-Bond Portfolio | 60% Stocks, 40% Bonds | Moderate diversification benefits | Dot-com bubble, Great Recession, COVID-19 |
| International Stock Portfolio | MSCI EAFE, MSCI EM, S&P 500 | Effective before 2009; less so after | Pre- and post-2009 |
| Cross-Asset Diversified Portfolio | S&P 500, Gold, Oil, U.S. Treasuries | Outperformed others; higher returns and Sharpe ratios | Multiple crises |
Gold and oil often act as hedges during market downturns. Investors should adjust their diversification strategy based on their investment horizon and the type of crisis.
Staying Disciplined
Disciplined investing helps investors avoid emotional decisions during market swings. Studies show that portfolios using tactical asset allocation adapt better to changing conditions and recover faster from downturns. For example, portfolios with tactical strategies recovered from the March 2020 market drop in 72 days, while static portfolios took 157 days. Structured liquidity management reduces performance drag during unexpected withdrawals. Professional management and systematic rebalancing also improve alignment with long-term goals and reduce behavioral mistakes. Investors who stick to a clear process, monitor progress, and avoid panic selling capture more market returns over time.
Note: Experts recommend staying invested, reviewing your plan regularly, and not letting short-term market moves drive your decisions.
Recent expert analysis shows that no single factor can predict a market crash. Machine learning models, which use many variables, help investors spot risks and adjust their strategies. The market in 2025 brings both risks and opportunities. Investors who stay informed and disciplined can find new opportunities even during uncertain times. Reviewing strategies and watching for changes in the market helps protect investments. Proactive planning gives investors confidence to face future challenges.
FAQ
What are the main warning signs of a market crash in 2025?
Investors watch for rising volatility, sharp drops in investor sentiment, and weak sector performance. These signals often appear before major downturns. Monitoring these trends helps investors prepare for sudden changes in the market.
How can investors protect their portfolios during high volatility?
Investors use diversification, risk management tools, and regular portfolio reviews. They may include assets like bonds, gold, and international stocks. These steps help reduce losses when markets become unstable.
Should investors sell all stocks if a crash seems likely?
Experts do not recommend panic selling. Investors who stay invested and follow a disciplined plan often recover faster. Selling during downturns can lock in losses and miss future gains.
How do tariffs and trade tensions affect the stock market?
Tariffs raise costs for companies and consumers. Trade tensions create uncertainty and can slow economic growth. These factors increase market volatility and may lead to lower stock prices.
With experts warning of a 2025 market crash risk, driven by high valuations (Buffett Indicator at 200%), rising volatility, and trade tensions like 25% tariffs on Canada and Mexico, investors face uncertainty. The S&P 500’s 14% correction in Q1 2025 and geopolitical risks, such as Iran-Israel tensions, highlight the need for quick, cost-effective strategies. BiyaPay’s multi-asset wallet offers free conversions between USDT and over 200 cryptocurrencies into fiat currencies like USD or HKD, helping you avoid high fees during volatile swings. With remittance fees as low as 0.5%, you can shift to stable assets like bonds or gold to protect your portfolio from sudden drops. Its secure platform and one-minute registration empower you to act rationally, avoiding panic selling. Stay resilient in uncertain markets—Join BiyaPay today to diversify and manage risks effectively!
*This article is provided for general information purposes and does not constitute legal, tax or other professional advice from BiyaPay or its subsidiaries and its affiliates, and it is not intended as a substitute for obtaining advice from a financial advisor or any other professional.
We make no representations, warranties or warranties, express or implied, as to the accuracy, completeness or timeliness of the contents of this publication.


Contact Us
Company and Team
BiyaPay Products
Customer Services


is a broker-dealer registered with the U.S. Securities and Exchange Commission (SEC) (No.: 802-127417), member of the Financial Industry Regulatory Authority (FINRA) (CRD: 325027), member of the Securities Investor Protection Corporation (SIPC), and regulated by FINRA and SEC.
registered with the US Financial Crimes Enforcement Network (FinCEN), as a Money Services Business (MSB), registration number: 31000218637349, and regulated by FinCEN.
registered as Financial Service Provider (FSP number: FSP1007221) in New Zealand, and is a member of the Financial Dispute Resolution Scheme, a New Zealand independent dispute resolution service provider.