- EasyCard
- Trade
- Help
- Announcement
- Academy
- SWIFT Code
- Iban Number
- Referral
- Customer Service
- Blog
- Creator
Is the Market Going to Crash in 2025 or Will It Recover?


Image Source: unsplash
Many investors now wonder, is the market going to crash again after the sharp losses in April 2025. Recent weeks showed extreme volatility across global markets:
| Region/Market | Statistic/Change |
|---|---|
| US S&P 500 | Lost 10% in two days |
| US Nasdaq Composite | Entered bear market with 11% drop |
| Japan Nikkei 225 | Largest loss since 2020, down 7% |
| Europe STOXX 600 | Worst week in 5 years, 8.4% loss |
Investor concerns have grown due to ongoing uncertainty:
- Sentiment surveys show caution and lower confidence.
- Moody’s downgraded U.S. credit, causing a selloff.
- The Federal Reserve kept rates steady, reflecting economic risk.
Key Takeaways
- The 2025 market crash was triggered by new tariffs, high valuations, and geopolitical conflicts, causing sharp losses and increased volatility.
- Economic signals like low consumer confidence, rising credit risks, and an inverted yield curve warn of possible recession and market challenges.
- Historical patterns show that market recoveries vary; some take months while deep declines may need years, so patience is essential.
- Diversifying investments and using risk management tools like stop-loss orders help protect portfolios during uncertain times.
- Long-term investing and staying calm through market ups and downs often lead to stronger returns and better outcomes.
2025 Market Crash
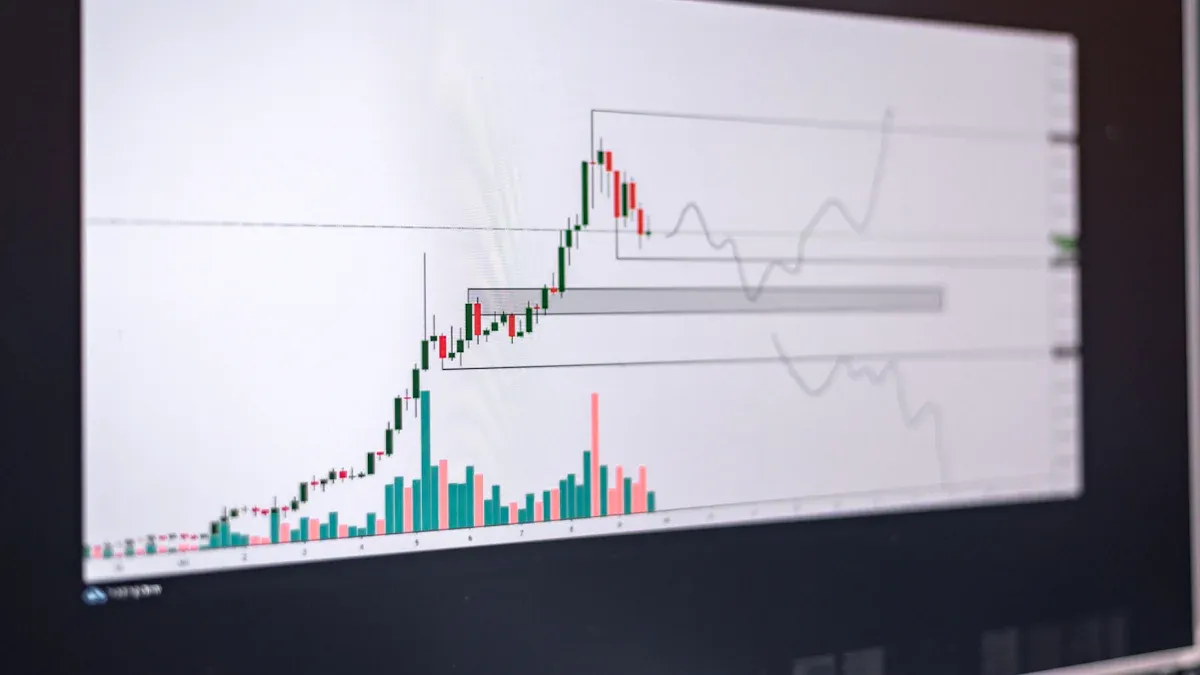
Image Source: pexels
Is the Market Going to Crash?
Many investors ask, is the market going to crash in 2025? The sharp drop in April 2025 raised fears about the future of the stock market. Experts point to several warning signs that suggest the risk of another downturn remains high.
- The Forward Price-to-Earnings (FPE) ratio stands at 21.5, a level seen before past crashes like the dot-com bubble and the Global Financial Crisis. High valuations often mean lower future returns if earnings fall.
- The Shiller price-to-earnings (CAPE) ratio for the S&P 500 has climbed above 34. This level has always come before a major stock market crash, with negative average returns in the years that follow.
- Warren Buffett’s Berkshire Hathaway now holds a record $348 billion in cash. This signals that even top investors struggle to find fairly priced stocks and expect possible losses ahead.
- Moody’s reports that U.S. firms face a 9.2% default risk, the highest since the last financial crisis. This adds to concerns about the health of the market.
Note: The M2 money supply, which measures the amount of money in the economy, has dropped by more than 2% year-over-year. This has only happened five times since 1870, each time before a depression or high unemployment.
Recent expert analysis highlights the role of political uncertainty, trade tensions, and deregulation in driving market swings. AI-driven models now help investors track risks in real time, but even these tools show that volatility remains high. LSEG’s 2025 analytics point to the need for constant monitoring as markets react quickly to global events.
Despite these risks, some analysts see reasons for hope. Edward Jones forecasts moderate U.S. GDP growth in 2025, with strong consumer spending and a resilient labor market. They expect S&P 500 earnings to grow by 10% to 15%. However, they warn that policy changes, tariffs, and fiscal deficits could still spark more volatility.
What Triggered the Crash?
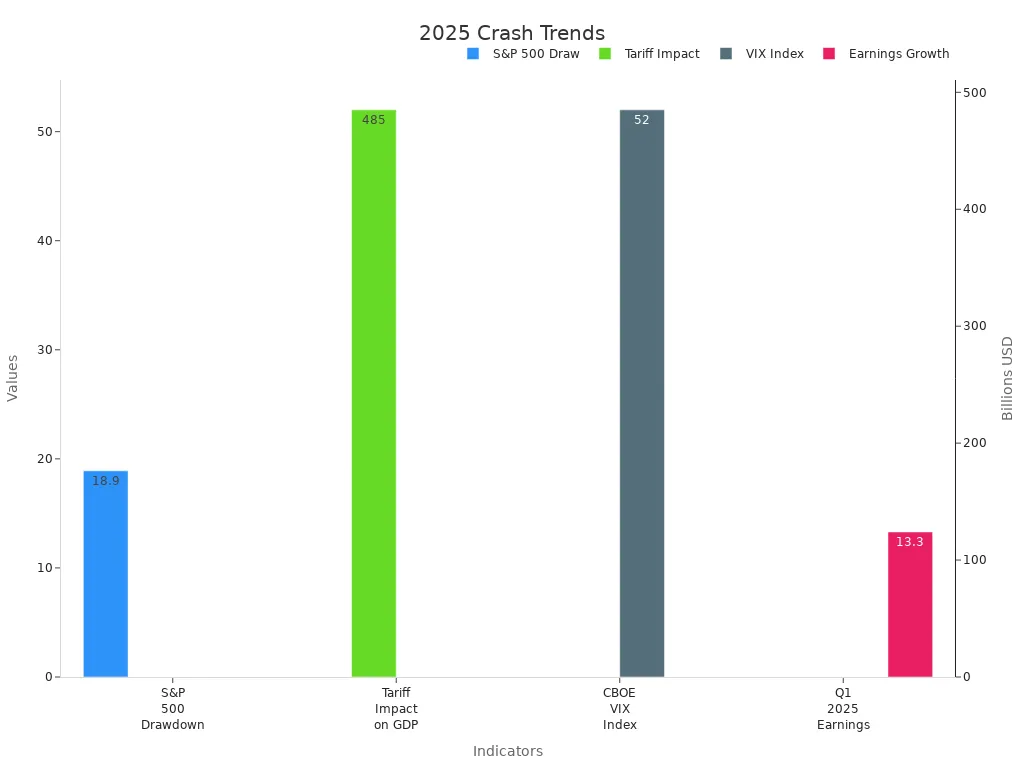
The 2025 market crash began on April 2, when new tariffs and global uncertainty shook investor confidence. The S&P 500 fell by 18.9% from February 19 to April 8, marking one of the largest corrections in recent years without clear signs of a recession.
| Indicator | Numerical Trend / Value | Explanation / Relevance to 2025 Crash |
|---|---|---|
| S&P 500 Drawdown | 18.9% decline (Feb 19 - Apr 8, 2025) | Unusually large correction without typical recession indicators |
| Tariff Impact on GDP | $485 billion (~1.63% of U.S. GDP) | Significant economic drag from tariffs |
| CBOE VIX Index | Spike to 52 on April 8, 2025 | Highest volatility since March 2020 COVID crisis, coinciding with tariffs announcement |
| High Yield Credit Spreads | Widened to levels not seen since 2023 | Reflects increased risk perception in credit markets |
| Sector Dispersion in Equities | Material increase in April 2025 | Indicates uneven impact across sectors due to tariff-related uncertainty |
| Q1 2025 Earnings Growth | 13.3% growth vs Q1 2024, but downward revisions expected | Shows initial resilience but expected negative impact from tariffs |
Several factors combined to trigger the crash:
- New tariffs on imports increased costs for businesses and consumers. The total impact reached $485 billion, or about 1.63% of U.S. GDP.
- The CBOE VIX Index, which measures market volatility, spiked to 52 on April 8. This was the highest level since the COVID-19 crisis in 2020.
- High yield credit spreads widened, showing that investors saw more risk in lending to companies.
- Sector dispersion grew, meaning some industries suffered bigger losses than others due to tariff uncertainty.
- Q1 2025 earnings grew by 13.3% compared to the previous year, but many companies warned of lower profits ahead because of tariffs.
Other warning signs included labor market shocks from stricter immigration enforcement and political uncertainty. Construction and agriculture, which rely on immigrant labor, faced job losses that spread to other parts of the economy. Private credit markets also grew more fragile, with underappreciated risks building up.
Tip: Investors should watch for signs like high valuations, rising volatility, and policy changes. These often come before a stock market crash.
Stock Market Risks
Stagflation and Recession
Stagflation and recession remain major risk factors for the stock market in 2025. The u.s. economy faces several warning signs. Consumer confidence has dropped for four straight months, with an 8% decline in April and a 32% fall in future expectations since January. Household debt reached $18.2 trillion in the first quarter, putting more pressure on families as interest rates stay high. Core inflation stands at 2.8%, the lowest in four years, but concerns about stagflation persist. The S&P 500 has seen increased volatility and is down 5.10% year-to-date. The yield curve, which often predicts a potential recession, was inverted for over a year until late 2024. The Federal Reserve continues to keep interest rates at their highest level since 2001.
| Indicator/Factor | Data Point/Description |
|---|---|
| Layoffs | Over 220,000 layoffs in Q1 2025, mainly in tech, retail, and logistics sectors |
| Small Business Confidence | NFIB Small Business Optimism Index dropped to 88.2 in March 2025, lowest since pandemic onset |
| GDP Growth | U.S. GDP contracted by 0.3% in Q1 2025 |
| Inflation | 3.1% year-over-year inflation; core inflation above 3.5% |
| Interest Rates | Fed funds rate at 5.25–5.50%, highest since 2001 |
Economists warn that the risk of recession has grown. JPMorgan now assigns a 60% chance of recession in 2025. Many experts see weaker growth and higher inflation, though not at the severe levels of the 1970s. These trends point to rising economic uncertainty and possible economic distress.
Tariffs and Policy Uncertainty
Tariffs and policy uncertainty have added new market risks. In 2025, the U.S. imposed a broad 10% tariff on imports. This move created confusion as exemptions and reversals followed. The situation reminds many of the 1930s Smoot-Hawley tariffs, which led to economic repercussions and higher volatility. In April, the global volatility index jumped to 52 points, more than triple the average from the previous two years. Gold prices hit record highs near USD 3,200 per troy ounce, showing that investors sought safe assets. Research shows that a 10-percentage-point rise in tariffs can reduce GDP by about 1.1% over five years. These changes have made forecasting harder and increased market risks for stocks.
Geopolitical Conflicts
Geopolitical conflicts have shaken the economy and the stock market. The Israel-Iran conflict in 2025 caused sharp reactions. The Dow Jones fell nearly 2%, and the S&P 500 dropped over 1%. Oil prices surged more than 10% within days. When oil prices stay high, experts expect equity market declines of 3% to 5%. Defensive sectors like energy and defense performed well, while travel and consumer stocks faced losses. Safe-haven assets such as gold and U.S. Treasuries rallied. Past conflicts, like the Yom Kippur War, also caused oil spikes and market downturns, but markets usually recovered after tensions eased. Investors must watch for these risks and adjust their strategies to manage losses during periods of economic uncertainty.
U.S. Stock Market Crash Signals
Economic Indicators
Economic indicators often give early warnings before a u.s. stock market crash. In early 2025, several signals pointed to trouble:
- Consumer sentiment dropped again, showing that people felt less confident about the future.
- The CEO Confidence Index reached its lowest point since October 2011, which showed a loss of confidence among business leaders.
- Retail sales growth slowed in 2024, as shoppers became more careful with spending.
- The housing market cooled because high mortgage rates made homes less affordable, even though housing starts stayed above pre-pandemic levels.
- Industrial production stayed flat or fell in 2023 and 2024, but some recovery appeared in early 2025.
- The market decline hit mega-cap tech stocks the hardest, with the Nasdaq 100 down 8% and the Growth factor returning -10% in the first quarter.
- Technology and Consumer Discretionary sectors suffered the largest losses.
- Credit spreads widened, which signaled more risk in lending.
These trends showed that the economy faced real challenges. When business leaders and consumers lose confidence, stocks often see more losses.
Market Volatility
Market volatility increased sharply during the 2025 trading sessions. The S&P 500 index fell about 10% from its all-time high on February 19, 2025. The CBOE Volatility Index, also called the “fear index,” nearly doubled by March 12, 2025. The yield curve inverted, with the 10-year Treasury yield dropping below the 3-month yield. This pattern has often warned of a coming u.s. stock market crash. The Atlanta Fed’s GDPNow model predicted a 2.8% drop in GDP for the quarter, which pointed to more risk for the economy. High stock market volatility can lead to quick losses and make investors more nervous.
Note: When volatility rises and the yield curve inverts, investors should watch for more losses and possible shocks to the stock market.
Valuation Concerns
Valuation concerns also played a role in the 2025 u.s. stock market crash. Many experts noticed that some stocks and sectors looked overvalued. In 2023, 128 unicorn companies lost value, and 42 lost their unicorn status, with half based in the United States. The rise of “ZIRPicorns” and “papercorns” showed that many companies had high values only on paper, not in real profits. TrueLayer, for example, saw its value fall by 30% in 2024, even though its revenue tripled. Funding for U.S. startups dropped by almost 30% in both 2022 and 2023 after interest rates went up. Projected rate cuts in 2025 raised fears that cheap debt could create new bubbles. The AI sector showed signs of a bubble, with some startups reaching multi-billion dollar values in just months. About 47% of investors in a Yale survey thought the stock market was overvalued at the end of 2023, which was close to the historical average but below past bubble peaks. These signals suggested that the u.s. stock market crash was partly due to overvaluation and speculation.
History and Patterns
Image Source: unsplash
Past Stock Market Crashes
History shows that the stock market has faced many major market downturns. Each event had unique causes, but some patterns repeat. The table below highlights some of the most significant crashes:
| Event Date | Event Name | Market Index | Decline Magnitude | Notes |
|---|---|---|---|---|
| Oct 28-29, 1929 | Black Tuesday | Dow Jones Industrial | ~25% drop over two days | Followed a peak in Sept 1929; market bottomed in 1932, took 25 years to recover |
| Oct 19, 1987 | Black Monday | S&P 500 | 20.5% single-day decline | Dow fell 22.6% same day; rapid, sharp drop attributed to computerized trading |
| Mar 16, 2020 | COVID-19 Crash | Dow Jones Industrial | 2,997 points, 12.9% single-day | Largest single-day point decline; S&P 500 also fell ~12% |
| 2025 (ongoing) | 2025 Downturn | S&P 500, Nasdaq | Significant declines (20%+) | Driven by economic slowdown and tariffs; echoes sharp drops seen in past crashes |
These events often followed periods of high optimism and rising prices. After each crash, investors faced uncertainty and fear. Some crashes, like Black Monday in 1987, happened quickly. Others, such as the 1929 crash, led to long periods of economic struggle and slow recovery.
Note: Major market downturns often share warning signs, such as high valuations, rapid price increases, or economic shocks.
Recovery Timelines
Recovery from a crash depends on what caused the decline. Historical data from 1946 to 2024 shows that the stock market spends much of the time below previous highs. Some recoveries happen fast, while others take years. For example, after the dot-com bubble and the 2008 financial crisis, investors waited almost a decade to see new highs. In contrast, noneconomic shocks, like the 9/11 attacks, led to quicker rebounds.
Empirical analysis shows that a 10% correction usually develops in about 25 days. Half of the time, the market recovers 50% of its losses within 15 days. However, reaching 75% recovery takes about 73.5 days, and full recovery often needs around 95 days. Deep declines, such as 30% or 40%, may require seven to nine years for full recovery. The chart below shows how recovery stages unfold over time:
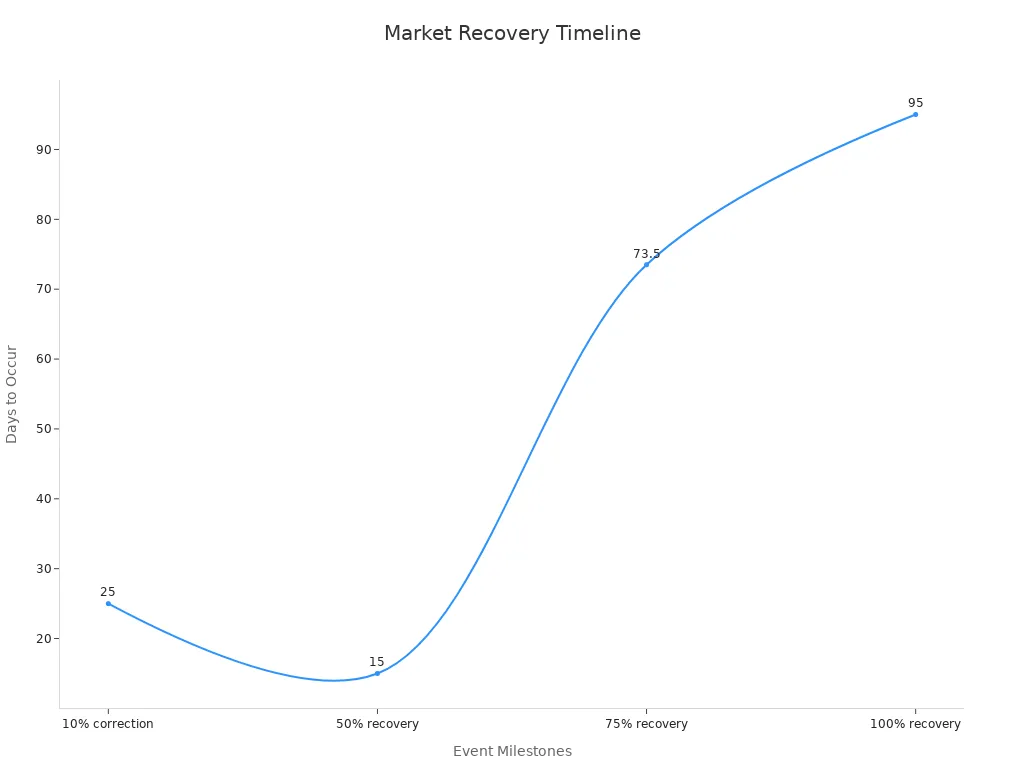
After the worst years since 1975, the S&P 500 often delivered strong returns in the following years. This pattern suggests that patience and discipline help investors weather downturns and benefit from future growth.
2025 Market Outlook
Analyst Predictions
Analysts see a mixed picture for the stock market forecast in 2025. Many experts expect continued volatility during the first half of 2025 as investors react to new tariffs and shifting policies. Some Wall Street firms predict modest gains, with returns between 5% and 10%. They believe that after two years of strong growth, a third year of double-digit returns is unlikely. Several analysts point to the Federal Reserve’s gradual approach to interest rate cuts. This policy supports stability but does not encourage rapid rallies.
A large amount of cash remains on the sidelines. US money market funds hold about USD 7 trillion, while international funds add another USD 3 trillion. This shows that many investors prefer to wait for clearer signals before buying more stocks. Consumer net worth in the US has reached an all-time high, which helps support demand and reduces the risk of a severe downturn. However, analyst targets for the S&P 500 vary widely, showing uncertainty about the direction of the market.
Sideways Trading and Recovery Hopes
Many market observers expect sideways trading to define the recovery phase. This means stocks may move up and down within a range, without a strong trend in either direction. Several trends support this view:
- Significant volatility is likely in the first half of 2025 as investors adjust to new economic and policy changes.
- Massive liquidity in money market funds suggests cautious investor behavior and potential market stabilization.
- The Federal Reserve’s flexible rate policy provides a cautious backdrop, supporting moderate movements.
- US consumer net worth at record highs offers a buffer against shocks.
- Wall Street analysts’ wide-ranging targets reinforce the idea of a range-bound market.
- The Global Real Estate Outlook highlights ongoing uncertainty, which aligns with a sideways trading environment.
The last half of 2025 may bring more stability as demand strengthens and liquidity improves. However, risks remain, including economic and regulatory uncertainties. Performance will likely vary by sector and region, so investors should focus on resilience and risk management. Many believe that patience and careful selection will help navigate this period until a clearer recovery trend appears.
Protecting Your Investments
Risk Management
Investors can protect their portfolios by using strong risk management strategies. Diversification stands out as one of the most effective tools. By spreading investments across different asset classes, sectors, and regions, investors reduce the chance that one bad event will hurt the entire portfolio. For example, adding real estate investment trusts (REITs) or hedge funds can lower the connection to traditional stocks and bonds.
Other important risk management steps include:
- Using stop-loss orders to limit losses during sharp market drops.
- Hedging with options or futures to act as financial insurance and cap potential losses.
- Regularly reviewing and adjusting investments to respond to changing market conditions.
- Including defensive stocks and bonds, which often perform better when markets fall.
- Monitoring risk with tools like Value-at-Risk (VaR) and stress testing to prepare for tough scenarios.
Tip: A disciplined approach to risk management helps investors keep their assets safe during market stress.
Case studies from past crises show the value of these strategies. The collapse of Long-Term Capital Management in 1998 highlighted the dangers of putting too much money in one place. The 2008 financial crisis showed that stress testing and scenario analysis can help investors spot risks early and build stronger portfolios.
Long-Term Strategies
Long-term investing has proven to be a powerful way to overcome market downturns. Historical data shows that even after bear markets, broad indices like the S&P 500 often recover and deliver strong returns over time. For example, Warren Buffett’s Berkshire Hathaway achieved high returns by holding investments through tough periods instead of selling during downturns.
Backtesting strategies on past market data helps investors see how their plans would have worked during previous crashes. This process builds confidence that staying invested and avoiding panic selling can lead to positive results.
The table below shows how recovery timelines can vary based on different scenarios:
| Scenario | Recovery Probability within 10 Years | Notes |
|---|---|---|
| No fishing, non-stationary productivity | 57% | Recovery less certain with changing conditions |
| Fishing at 90% of MSY, non-stationary productivity | 18% | Recovery much slower with added pressure |
| No fishing, stationary productivity | 78% | Faster recovery with stable conditions |
| Fishing at 90% of MSY, stationary productivity | 66% | Higher recovery chance with less change |
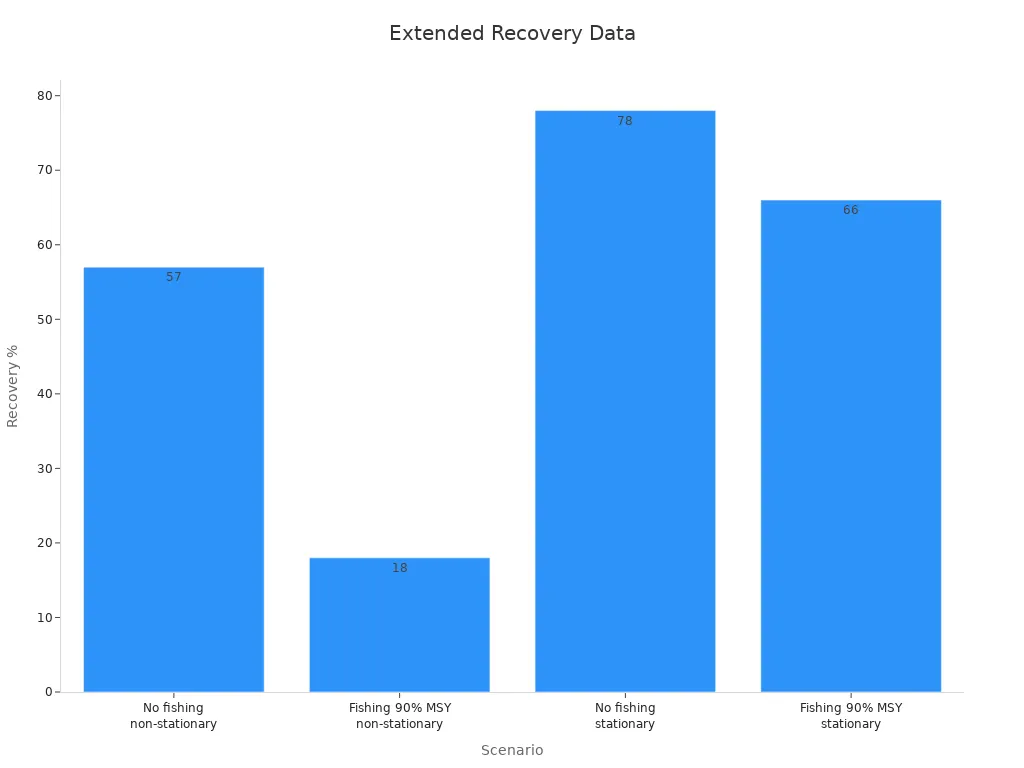
These results show that recovery can take time, especially when conditions change. Investors who use long-term, adaptive strategies and stay patient often see the best results after market downturns.
Investors saw uncertainty rise in 2025, but history shows that markets often recover. The table below highlights key trends supporting a positive outlook:
| Indicator | Value/Projection | Implication |
|---|---|---|
| Uncertainty Index (Mar 2025) | 483 | High index often leads to strong returns |
| Fed GDP Growth Projection (2025) | 1.7% | Supports moderate growth |
| S&P 500 Return (Uncertainty >180) | 21.5% avg. next 12 mo. | Suggests potential for strong performance |
Staying calm and monitoring risks helps investors build confidence. Long-term, flexible strategies often lead to better results, as past recoveries show. Market cycles bring both challenges and opportunities, so preparation remains key.
FAQ
What caused the 2025 stock market crash?
Several factors led to the crash. New tariffs increased costs for businesses. Geopolitical conflicts raised uncertainty. High valuations and policy changes also played a role. Experts believe these combined risks triggered the sharp decline.
How long do stock market recoveries usually take?
Recovery times vary. Some markets bounce back in months. Others need years. Deep declines, like those in 2008, took up to nine years to recover. Patience and long-term strategies help investors during these periods.
Should investors sell their stocks during a crash?
Most experts advise against panic selling. History shows that markets often recover. Investors who hold quality assets and use risk management strategies usually see better long-term results.
How can investors protect their portfolios in uncertain times?
Diversification helps reduce risk. Investors can add assets like real estate investment trusts or Hong Kong bank bonds. Using stop-loss orders and reviewing portfolios regularly also helps manage losses.
What signals should investors watch for future crashes?
Investors should monitor economic indicators, such as consumer confidence and credit spreads. High volatility, inverted yield curves, and overvalued stocks often signal increased risk. Staying informed helps investors make better decisions.
As the 2025 market turbulence underscores the need for robust risk management, investors face challenges like high transaction costs and complex global market access. BiyaPay. offers a streamlined solution to enhance your investment strategy. Its multi-asset wallet allows free USDT conversion to currencies such as USD and HKD, enabling seamless investments in U.S. and Hong Kong markets. With remittance fees as low as 0.5%—significantly below industry standards—and a 1-minute online registration, BiyaPay eliminates the burden of intricate overseas account setups. This reliable, cost-effective platform empowers you to diversify your portfolio efficiently and capitalize on long-term market opportunities.
Take control of your investments now! Join BiyaPay.
*This article is provided for general information purposes and does not constitute legal, tax or other professional advice from BiyaPay or its subsidiaries and its affiliates, and it is not intended as a substitute for obtaining advice from a financial advisor or any other professional.
We make no representations, warranties or warranties, express or implied, as to the accuracy, completeness or timeliness of the contents of this publication.


Contact Us
Company and Team
BiyaPay Products
Customer Services


is a broker-dealer registered with the U.S. Securities and Exchange Commission (SEC) (No.: 802-127417), member of the Financial Industry Regulatory Authority (FINRA) (CRD: 325027), member of the Securities Investor Protection Corporation (SIPC), and regulated by FINRA and SEC.
registered with the US Financial Crimes Enforcement Network (FinCEN), as a Money Services Business (MSB), registration number: 31000218637349, and regulated by FinCEN.
registered as Financial Service Provider (FSP number: FSP1007221) in New Zealand, and is a member of the Financial Dispute Resolution Scheme, a New Zealand independent dispute resolution service provider.