- EasyCard
- Trade
- Help
- Announcement
- Academy
- SWIFT Code
- Iban Number
- Referral
- Customer Service
- Blog
- Creator
The Evolution of Share Market Corrections and Their Causes


Image Source: unsplash
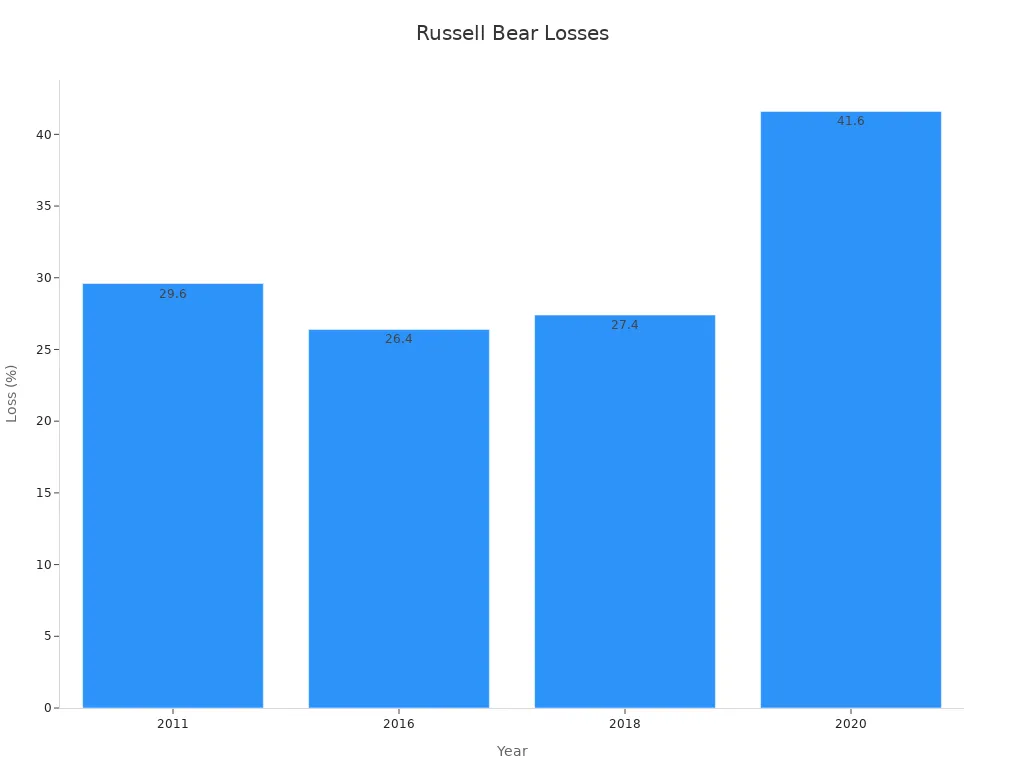
A share market correction occurs when stock prices fall by 10% or more from a recent peak. Investors often see a correction as a signal to review their strategies. Understanding the history and causes of corrections helps people avoid panic and make smart choices. Corrections happen often in the market. For example, the Russell 2000 index experiences a correction about once every two years. The S&P 500 has seen only one bear market since 2009.
| Index | Correction Frequency (10%+) | Bear Market Frequency (20%+) | Crash Frequency (30%+) | Notable Bear Market Losses (%) |
|---|---|---|---|---|
| Russell 2000 | Once every 2 years | Once every 4 years | Once every 6 years | 2011: -29.6%, 2016: -26.4%, 2018: -27.4%, 2020: -41.6% |
| S&P 500 | N/A | One bear market since 2009 | N/A | 2020: >20% loss |
Market corrections are normal and do not always signal a crisis. They help keep the market healthy and balanced.
Key Takeaways
- Share market corrections happen when stock prices drop 10% to 20% and are a normal part of market cycles that help keep prices balanced.
- Corrections occur every two to three years on average and usually recover within a year, unlike deeper bear markets or sudden crashes.
- Economic issues like inflation, interest rates, and geopolitical events often trigger corrections by reducing investor confidence.
- Investors should stay calm during corrections, review their strategies, and avoid panic selling to benefit from market recoveries.
- A long-term view and diversified investments help manage risk and improve chances of success through market ups and downs.
What Is a Share Market Correction?
Definition
A share market correction happens when the value of a stock market index or a group of stocks drops by 10% to 20% from its recent high. This type of market decline signals a pause or adjustment after a period of rising prices. Corrections do not last as long as bear markets, which involve drops of more than 20%. Investors often see corrections as a normal part of the market cycle. They help cool down markets that have grown too quickly.
Stock market corrections occur more often than many people think. In major markets like the S&P 500 and FTSE 100, corrections happen every two to three years. Most corrections recover within a year, and the market often reaches new highs soon after. This pattern shows that corrections are not rare or unusual events.
Corrections vs. Crashes
Not every market decline turns into a crash or a crisis. Corrections, bear markets, and crashes have different meanings and impacts:
| Term | Decline (%) | Frequency | Recovery Time | Example Events |
|---|---|---|---|---|
| Correction | 10-20 | Every 2-3 years | Months to 1 year | 2015 Chinese correction, 2016 S&P 500 |
| Bear Market | 20+ | Less frequent | Years in some cases | Dot-com bust, Great Financial Crisis |
| Crash | 30+ in days | Rare | Years or longer | 1929 Great Depression, Black Monday 1987, 2008 Financial Crisis |
A correction is a moderate drop that usually recovers quickly. A bear market is a deeper and longer decline. A crash is a sudden, sharp drop that can lead to a crisis. For example, the 1929 crash started the Great Depression, which lasted for years and caused major economic problems. The 1987 Black Monday crash saw the Dow Jones fall 22.6% in one day. This event shocked investors and led to new rules, such as circuit breakers, to stop trading during extreme drops.
Some crashes happen because of excessive leverage. In 2015, the Chinese stock market crash showed how high borrowing levels forced investors to sell quickly, making the market decline worse. The 2008 financial crisis also began with too much risk and borrowing. These events show that leverage can turn a normal correction into a severe crash.
Why Corrections Matter
Understanding corrections helps both new and experienced investors make better decisions. Corrections remind investors that the market does not always go up. They offer a chance to review investment strategies and manage risk. When investors know that corrections are common, they feel less panic during a market decline.
Corrections help keep the market healthy by stopping prices from rising too fast. They also give investors a chance to buy stocks at lower prices.
Most corrections do not turn into bear markets or crashes. In the FTSE 100, less than one-third of corrections become bear markets. In the United States, about 43% of corrections lead to bear markets. Even after big crashes like the Great Depression or the 2008 crisis, the stock market has always recovered and reached new highs. This long-term trend shows the strength of the market and rewards patient investors.
Market Corrections: Frequency and History
Image Source: unsplash
How Often They Occur
Market corrections have happened many times in history. Since the 1950s, the S&P 500 has experienced about 38 corrections, which means a correction occurs every 2.2 years on average. These pullbacks are normal and help keep the market healthy.
- 15% declines in the S&P 500 happen about one to two times in most five-year periods.
- 20% declines also occur about one to two times every five years.
- Drops of 25% or more are less common, showing up every 5 to 15 years.
- Large drops of 30% or more are rare, with only six such events since the 1950s.
- Severe declines of 40% have happened only three times since the mid-1940s.
- Declines of 50% or more are extremely rare, with only four such events since 1871.
Market corrections since 1954 show that most corrections do not turn into a crisis. Investors often see these pullbacks as buying opportunities.
Notable Historical Events
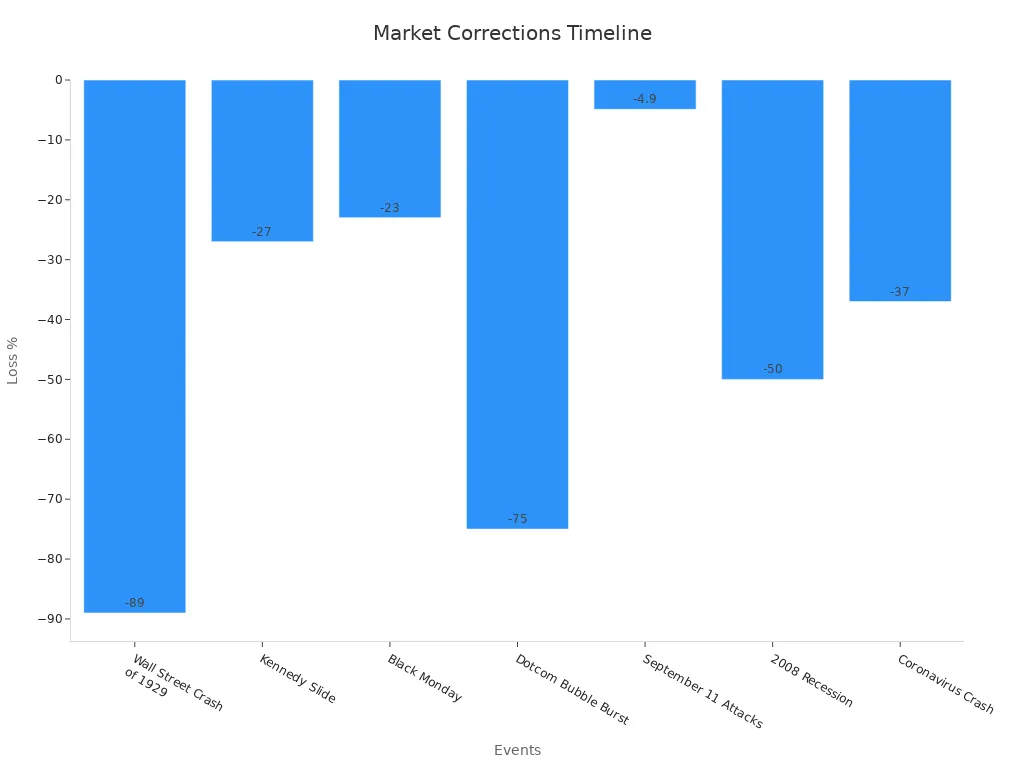
Many famous market corrections have shaped investor behavior. The Wall Street Crash of 1929 led to the Great Depression, with the Dow losing 89%. The 1987 crash, known as Black Monday, saw a 23% drop in one day. The dotcom bubble burst in 2000 caused the NASDAQ to fall by 75%. The 2008 financial crisis led to a 50% drop in the Dow. The COVID-19 crash in 2020 saw a 37% decline, but the market recovered quickly. Other events, like the 1998 Russian default and the 2016 oil price collapse, also caused sharp market downturns.
| Event | Date Range | Market Index | Approximate Loss/Gain | Recovery Period (if available) |
|---|---|---|---|---|
| Wall Street Crash of 1929 | Oct 1929 – Jul 1932 | Dow | -89% | Took ~16 years to recover |
| Kennedy Slide | Dec 1961 – Jun 1962 | Dow | -27% | Recovered ~14 months later |
| Black Monday | Oct 19, 1987 | Dow | -23% | Recovery took about 23 months |
| Dotcom Bubble Burst | Mar 2000 – Oct 2002 | NASDAQ | -75% | Recovery took about 5 years |
| September 11 Attacks | Sep 11, 2001 | S&P 500 | -4.9% | Growth resumed thereafter |
| 2008 Recession | Oct 2007 – Mar 2009 | Dow | -50% | Recovery: Mar 2009 – May 2010 |
| Coronavirus Crash | Mar 2020 | Dow | -37% | Recovery aided by Fed stimulus |
Recovery Patterns
Recovery after a correction depends on the size and cause of the market decline. After the Great Depression, investors waited about 16 years for a full market recovery. The 1987 crash took 23 months to recover. The dotcom bubble burst needed five years for the market to bounce back. The 2008 financial crisis saw recovery in about 14 months. The COVID-19 crash recovered even faster, thanks to strong action from the Federal Reserve.
Market pullbacks and corrections can feel scary, but historical market trends show that markets usually recover and reach new highs. Investors who stay calm during market downturns often benefit from the rebound.
Causes of Stock Market Corrections
Image Source: pexels
Economic Factors
Economic factors often play a major role in triggering stock market corrections. Rising inflation and higher interest rates can reduce company profits. When companies earn less, investors lose confidence and start selling their shares. This selling leads to price drops and market pullbacks. For example, in 2018, the S&P 500 experienced a correction because of concerns about inflation and rising interest rates. In 2022, the market faced another correction as central banks tightened monetary policies and global economic uncertainty increased.
Several economic indicators signal possible market downturns. A yield curve inversion, where short-term interest rates become higher than long-term rates, has predicted every U.S. recession since the 1970s. When unemployment rises quickly, it shows that the job market is weakening. This change leads to less consumer spending and lower company earnings. Consumer confidence indexes also matter. When people feel less confident about the economy, they spend less, which slows growth. During these times, the market often sees more pullbacks and higher volatility. Tight credit conditions, such as banks lending less or charging higher rates, can make these problems worse and lead to more selling.
Market pullbacks caused by economic factors usually happen gradually. They help adjust prices that have become too high and remind investors to watch for signs of trouble.
Geopolitical Events
Geopolitical events can cause sudden changes in the stock market. Wars, conflicts, and political uncertainty often lead to sharp pullbacks. Research on defense companies across many countries shows that geopolitical risk events, like the Russia-Ukraine war, increase volatility and uncertainty in stock prices. These events affect different regions in different ways. For example, defense firms in the UK and Europe often feel the impact more than others.
A study of the Israel-Hamas conflict found that maritime shipping stocks dropped sharply after news of missile attacks on cargo ships. Container and tanker companies saw the biggest losses. Positive news, such as ceasefires, did not help stocks recover as much. This pattern shows that negative geopolitical events can trigger corrections, especially in sectors that are directly affected.
Policy uncertainty also plays a role. When governments change rules or make unexpected decisions, investors may worry about future profits. This worry can lead to market pullbacks as people sell shares to avoid possible losses.
Market Triggers
Market triggers are events or behaviors that set off corrections. Sometimes, corrections follow a period of strong gains and high optimism. When prices rise too quickly, investors may become too confident. This optimism can lead to excessive speculation, where people buy stocks just because they expect prices to keep going up. If something changes—like a disappointing earnings report or a sudden policy shift—investors may rush to sell. This rush can turn a small drop into a larger correction.
Historical events show how different triggers can cause corrections. In 1998, the Russian debt default led to a sharp market downturn. The 2016 oil price collapse caused another round of pullbacks as energy stocks fell. Policy changes, such as new trade tariffs or changes in interest rates, can also act as triggers. Investor sentiment matters, too. When people feel nervous, even small pieces of bad news can lead to bigger sell-offs.
Corrections often happen after the market reaches new highs. When prices get too far ahead of company profits, a correction brings them back in line. These pullbacks serve as a reminder that markets do not move in a straight line. They help prevent bubbles and keep the system healthy.
Investors who understand the causes of corrections can better prepare for market pullbacks and avoid panic during market downturns.
Lessons from Market Corrections
Investor Strategies
Investors often learn that patience pays off after pullbacks. Markets have shown a pattern of rebounding after corrections and bear periods. Many investors use diversification to spread risk. They choose a mix of stocks, bonds, and other assets. This approach helps reduce the impact of losses in any one area. Staying invested during downturns can also lead to better results. Selling in a panic often locks in losses, while holding on gives a chance for recovery.
Backtesting, a method that applies strategies to past data, helps investors see how their plans would have worked before. This process shows the strengths and weaknesses of each strategy. It also reveals how much a portfolio might drop during tough times. Investors gain confidence when they see that their strategies have survived past corrections.
Risk Management
Risk management stands at the center of successful investing. Investors use tools like stop-loss orders and position sizing to limit losses. They also review their portfolios often to make sure their choices match their goals. A recent study looked at daily VIX data from 2016 to 2023. The research found that past volatility shapes how investors judge current risks. By studying past swings, investors can adjust their risk plans and avoid big surprises.
Reviewing past pullbacks helps investors prepare for future drops and avoid repeating mistakes.
Long-Term Perspective
A long-term view helps investors stay calm during short-term drops. History shows that markets recover and reward those who wait. Investors who focus on long-term goals, like retirement or education, often see better results. They avoid making quick decisions based on fear. Learning from past corrections helps investors make smarter choices in the future.
- Review goals often
- Stay invested through ups and downs
- Learn from past mistakes and successes
Investors can benefit from understanding the history and causes of share market corrections.
- About 64% of years see a 10% or greater drop, but most years still end with gains.
- The S&P 500 has averaged a 7.7% annual return, and often rebounds strongly after corrections.
- Staying focused on long-term goals and reviewing strategies helps investors manage risk and stay calm during downturns.
Learning from past corrections supports better decisions and builds confidence for the future.
FAQ
What is the main difference between a correction and a bear market?
A correction means a drop of 10% to 20% from a recent high. A bear market means a drop of more than 20%. Corrections happen more often and usually recover faster than bear markets.
How long do market corrections usually last?
Most corrections last from a few weeks to several months. Data shows that the average correction in the S&P 500 recovers within four months. Some corrections may take longer, depending on the cause.
Can investors predict when a correction will happen?
No one can predict corrections with certainty. Many factors, such as economic data or global events, can trigger them. Investors often watch for warning signs, but corrections can still surprise the market.
What should investors do during a correction?
Investors should stay calm and review their long-term goals. Selling in panic often leads to losses. Many experts suggest holding a diversified portfolio and avoiding quick decisions during market drops.
Market corrections, as seen historically, are opportunities to reassess and strengthen investment strategies, but high transaction costs and complex global market access can hinder effective diversification. BiyaPay simplifies this process with its multi-asset wallet, offering free USDT conversion to currencies like USD and HKD, ideal for investing in U.S. or Hong Kong markets. With remittance fees as low as 0.5%—well below traditional platforms—and a 1-minute online signup, BiyaPay removes the barriers of cumbersome overseas account setups. This reliable, cost-efficient solution empowers investors to navigate market volatility confidently, ensuring flexibility to seize opportunities during recoveries.
Ready to streamline your investment approach? Join BiyaPay today.
*This article is provided for general information purposes and does not constitute legal, tax or other professional advice from BiyaPay or its subsidiaries and its affiliates, and it is not intended as a substitute for obtaining advice from a financial advisor or any other professional.
We make no representations, warranties or warranties, express or implied, as to the accuracy, completeness or timeliness of the contents of this publication.


Contact Us
Company and Team
BiyaPay Products
Customer Services


is a broker-dealer registered with the U.S. Securities and Exchange Commission (SEC) (No.: 802-127417), member of the Financial Industry Regulatory Authority (FINRA) (CRD: 325027), member of the Securities Investor Protection Corporation (SIPC), and regulated by FINRA and SEC.
registered with the US Financial Crimes Enforcement Network (FinCEN), as a Money Services Business (MSB), registration number: 31000218637349, and regulated by FinCEN.
registered as Financial Service Provider (FSP number: FSP1007221) in New Zealand, and is a member of the Financial Dispute Resolution Scheme, a New Zealand independent dispute resolution service provider.