- EasyCard
- Trade
- Help
- Announcement
- Academy
- SWIFT Code
- Iban Number
- Referral
- Customer Service
- Blog
- Creator
What Investors Should Know About the Dow Jones TSM


Image Source: pexels
The Dow Jones TSM is a stock market index that tracks almost all publicly traded U.S. stocks, giving you a broad view of the market. You can use this index to see how the market and the economy change over time. Many investors look at the Dow and DJIA for trends, but research shows the Dow Jones TSM has weak predictive power for future returns.
| Period | Annualized Return | Cumulative Return |
|---|---|---|
| 2011-2023 (Bull) | 9.05% | 225.54% |
The Dow and DJIA often reflect both the ups and downs of the market and the economy, helping you understand risk and growth.
Key Takeaways
- The Dow Jones TSM tracks nearly all U.S. stocks, giving you a broad view of the market and economy.
- It uses market-cap weighting and float adjustment to reflect the true value of companies investors can buy.
- The index includes large, mid, small, and micro-cap stocks, helping you diversify your investments.
- You can use the Dow Jones TSM to compare your portfolio, manage risk, and spot market trends.
- Compared to other indexes, it offers wider market coverage, making it a strong benchmark for funds and investors.
What Is Dow Jones TSM
Image Source: pexels
Index Overview
You can think of the Dow Jones TSM as a snapshot of almost the entire U.S. stock market. This index tracks about 3,741 stocks traded on U.S. exchanges. It covers the top 95% of the market by market capitalization. You get a mix of large, mid, small, and even micro-cap companies. The index does not include foreign securities, exchange-traded products, or other investment companies.
Here is a table that shows the main features of the Dow Jones TSM:
| Attribute | Details |
|---|---|
| Number of Stocks | Approximately 3,741 stocks traded on U.S. exchanges |
| Market Capitalization Coverage | Represents the top 95% of the U.S. stock market by market capitalization |
| Company Sizes Included | Large-cap, mid-cap, small-cap, and micro-cap companies |
| Exclusions | Foreign securities, exchange-traded products, and other investment companies |
| Weighting Method | Market-capitalization weighted and float-adjusted |
| Index Purpose | Broad-based benchmark for U.S. equity performance |
| Subdivisions | Sub-indexes by size and sector to track different market segments |
| Comparison | Compared with Wilshire 5000 and Russell 3000 indexes for market trend analysis |
| Methodology | Objective and transparent, aiming to provide reliable and accurate U.S. equity measures |
The Dow Jones TSM uses a market-cap weighting method. This means bigger companies have a larger impact on the index. You can see how the index changes as the market shifts. The index gives you a clear view of how the stock market and the U.S. economy perform over time.
You can also look at the historical performance of the Dow Jones TSM to see how it has evolved. The table below shows the average stock price, opening, high, low, closing prices, and annual percentage changes for each year:
| Year | Average Stock Price | Year Open | Year High | Year Low | Year Close | Annual % Change |
|---|---|---|---|---|---|---|
| 2025 | ~187 | ~200 | ~223 | ~141 | ~214 | +8.88% |
| 2024 | ~158 | ~99 | ~206 | ~97 | ~196 | +92.58% |
| 2023 | ~90 | ~71 | ~104 | ~71 | ~102 | +42.33% |
| 2022 | ~86 | ~121 | ~132 | ~58 | ~72 | -36.75% |
| 2021 | ~111 | ~103 | ~130 | ~101 | ~113 | +12.08% |
| 2020 | ~64 | ~54 | ~101 | ~40 | ~101 | +92.71% |
| 2019 | ~39 | ~31 | ~53 | ~30 | ~52 | +64.92% |
| 2018 | ~34 | ~34 | ~39 | ~30 | ~32 | -3.59% |
| 2017 | ~29 | ~24 | ~36 | ~24 | ~33 | +41.46% |
| 2016 | ~21 | ~17 | ~26 | ~16 | ~23 | +30.18% |
| 2015 | ~18 | ~17 | ~19 | ~15 | ~18 | +4.20% |
| 2014 | ~15 | ~13 | ~18 | ~12 | ~17 | +30.61% |
| 2013 | ~13 | ~13 | ~15 | ~12 | ~13 | +3.88% |
| 2012 | ~11 | ~10 | ~13 | ~9 | ~13 | +36.72% |
| 2011 | ~9 | ~9 | ~10 | ~8 | ~9 | +6.39% |
| 2010 | ~7 | ~8 | ~9 | ~6 | ~9 | +13.91% |
| 2009 | ~6 | ~5 | ~8 | ~4 | ~8 | +51.16% |
| 2008 | ~6 | ~6 | ~7 | ~4 | ~5 | -17.37% |
| 2007 | ~6 | ~6 | ~7 | ~6 | ~6 | -4.80% |
| 2006 | ~6 | ~6 | ~7 | ~5 | ~6 | +17.68% |
| 2005 | ~5 | ~4 | ~6 | ~4 | ~5 | +25.85% |
| 2004 | ~4 | ~5 | ~5 | ~3 | ~4 | -4.50% |
| 2003 | ~4 | ~3 | ~6 | ~3 | ~5 | +56.87% |
| 2002 | ~5 | ~7 | ~8 | ~2 | ~3 | -54.83% |
| 2001 | ~5 | ~5 | ~7 | ~3 | ~6 | +39.35% |
| 2000 | ~9 | ~10 | ~14 | ~4 | ~5 | -50.93% |
You can also see the changes in the Dow Jones TSM over time in this chart:
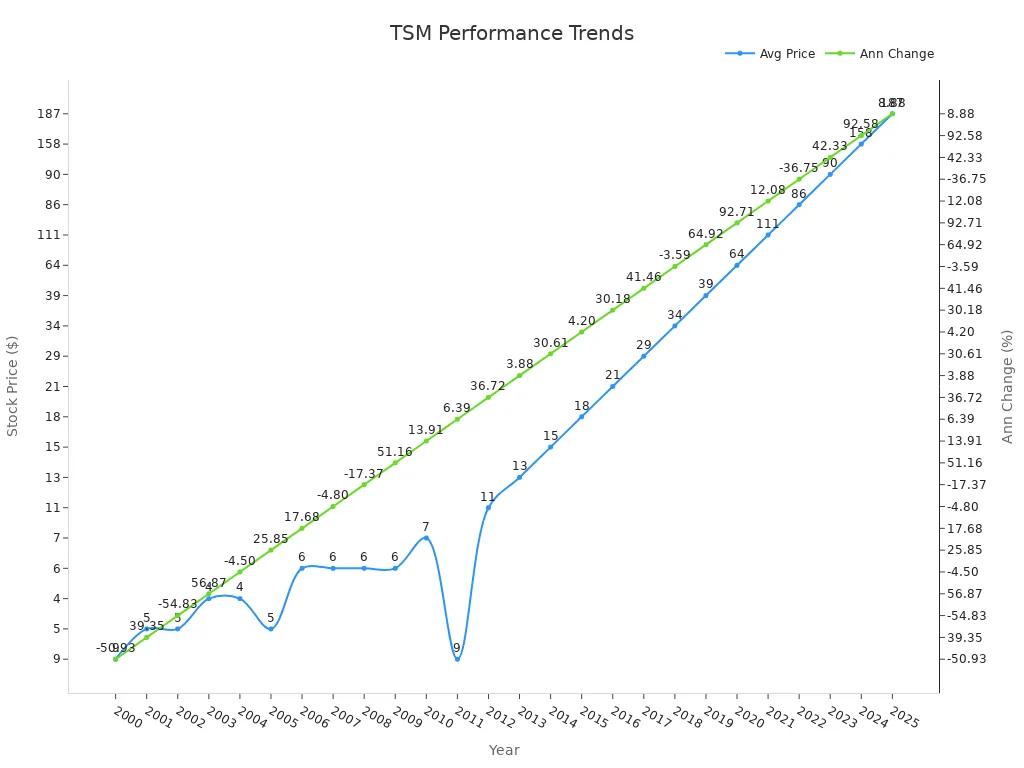
The chart and table show how the index reacts to changes in the market and the economy. You can spot periods of growth and downturns. This helps you understand how the Dow Jones TSM reflects the health of the U.S. economy.
Purpose
The Dow Jones TSM gives you a broad benchmark for the U.S. stock market. You can use this index to measure how your investments perform compared to the overall market. The index includes a wide range of stocks, so you get a full picture of the market, not just a small part.
You benefit from the Dow Jones TSM because it covers all types of companies. This includes large, stable firms and smaller, fast-growing ones. Studies show that small-cap stocks often have higher returns than large-cap stocks. These higher returns come with more risk, but they can boost your portfolio’s performance. For example:
- Small-cap stocks tend to offer higher returns as a reward for greater risk.
- The “January effect” shows that small-cap stocks often rise more in January.
- Mutual funds that focus on small-cap stocks usually have higher risk-adjusted returns.
- Adding small-cap stocks to your portfolio can improve your risk-return balance.
- You should consider your own risk tolerance before focusing on small-cap stocks.
You can use the Dow Jones TSM to track trends in the market and the economy. The index helps you see how different types of stocks perform in various market conditions. You can also use it to compare your investments to the overall market.
Tip: The Dow Jones TSM is not just for tracking performance. You can use it to build a diversified portfolio, manage risk, and spot new opportunities in the U.S. economy.
The Dow Jones TSM also helps you understand time-series momentum strategies. These strategies look at past stock prices to predict future trends. Research shows that these strategies can outperform simple buy-and-hold approaches, but they also come with risks. For example:
- Time-series momentum strategies have shown strong results in many markets, including stocks, futures, and currencies.
- These strategies can help you manage risk during market downturns.
- They offer diversification because their returns do not always move with the market.
- You should know that these strategies can have periods of underperformance and higher risk.
You can see that the Dow Jones TSM is more than just a number. It is a tool that helps you understand the stock market, the economy, and your own investments. By following the index, you can make smarter decisions and stay informed about changes in the U.S. economy.
Index Methodology
Market Cap Weighting
You see the dow jones tsm use a market cap weighting method. This means the index gives more weight to bigger companies. When a company grows in value, it takes up a larger share of the index. If a company shrinks, its share gets smaller. This method helps the index reflect the real structure of the stock market.
For example, the S&P 500 also uses market cap weighting. Companies like Apple and Microsoft have a bigger impact on the index because they are worth more. This approach lets you track the market’s performance in a way that matches what investors actually own. Market cap weighting also keeps the index stable and cost-effective. Equal-weighted indexes, by contrast, spread the weight evenly but can lead to higher trading costs and more ups and downs.
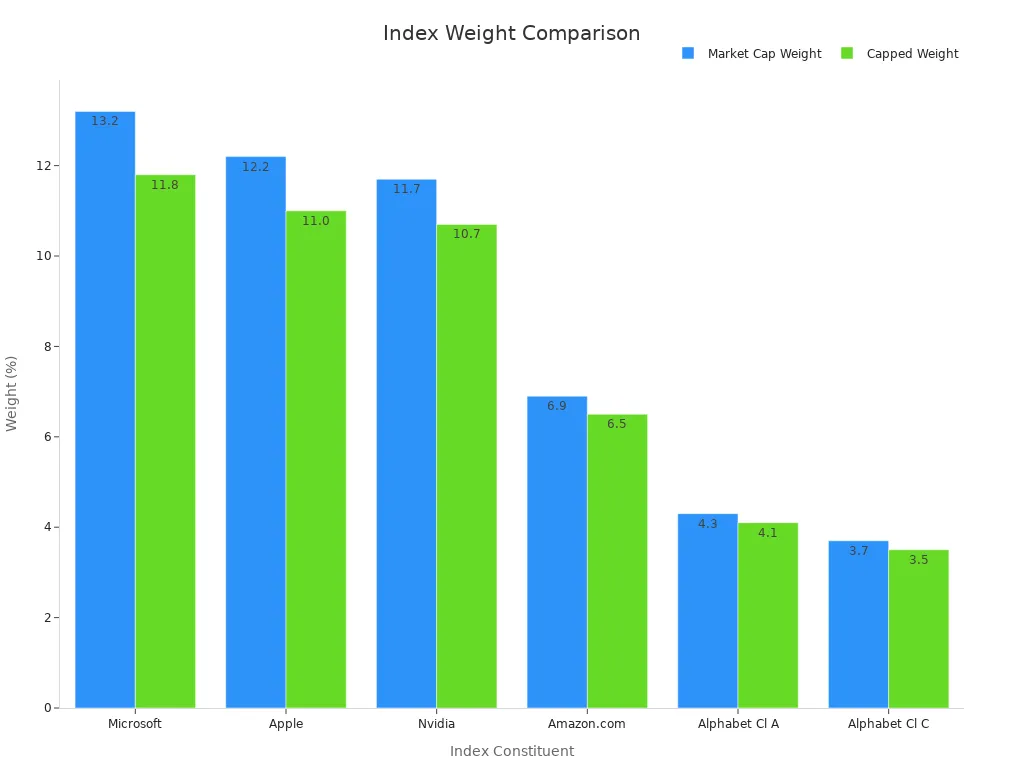
| Index Constituent | Russell Top 200 Growth Weight | Russell Top 200 Growth RIC Capped Weight | Difference |
|---|---|---|---|
| Microsoft | 13.2% | 11.8% | -1.5% |
| Apple | 12.2% | 11.0% | -1.2% |
| Nvidia | 11.7% | 10.7% | -1.0% |
| Amazon.com | 6.9% | 6.5% | -0.4% |
| Alphabet Cl A | 4.3% | 4.1% | -0.2% |
| Alphabet Cl C | 3.7% | 3.5% | -0.2% |
| Weight of companies >5% | 52.0% | 47.6% | -4.4% |
This table shows how market cap weighting works. Big companies make up a large part of the index. Some indexes use caps to limit how much one company can count, but the dow jones tsm aims to match the real market as closely as possible.
Note: Market cap weighting helps you follow the market’s true direction. It also keeps the index easy to manage and less costly for funds that track it.
Float Adjustment
The dow jones tsm uses float adjustment to make the index even more accurate. Float adjustment means the index only counts shares that investors can actually buy and sell. Some shares are locked up by company insiders or governments. These shares do not trade on the open market, so the index leaves them out.
By using float adjustment, the index gives you a better picture of what is really available to investors. This method helps you see the real value of the market. It also makes the index more useful for funds and investors who want to match the market’s performance.
You can trust that float adjustment keeps the index fair. It avoids giving too much weight to companies with lots of locked-up shares. This makes the dow jones tsm a strong tool for tracking the stock market.
Stocks Included
The dow jones tsm includes almost all stocks traded on U.S. exchanges. You get exposure to about 3,741 stocks, which covers the top 95% of the U.S. market by value. The index includes large, mid, small, and micro-cap stocks. It does not include foreign stocks, exchange-traded products, or investment companies.
A recent report shows the index holds around 3,175 stocks. This number can change as companies enter or leave the market. The index’s goal is to give you a complete view of the U.S. stock market.
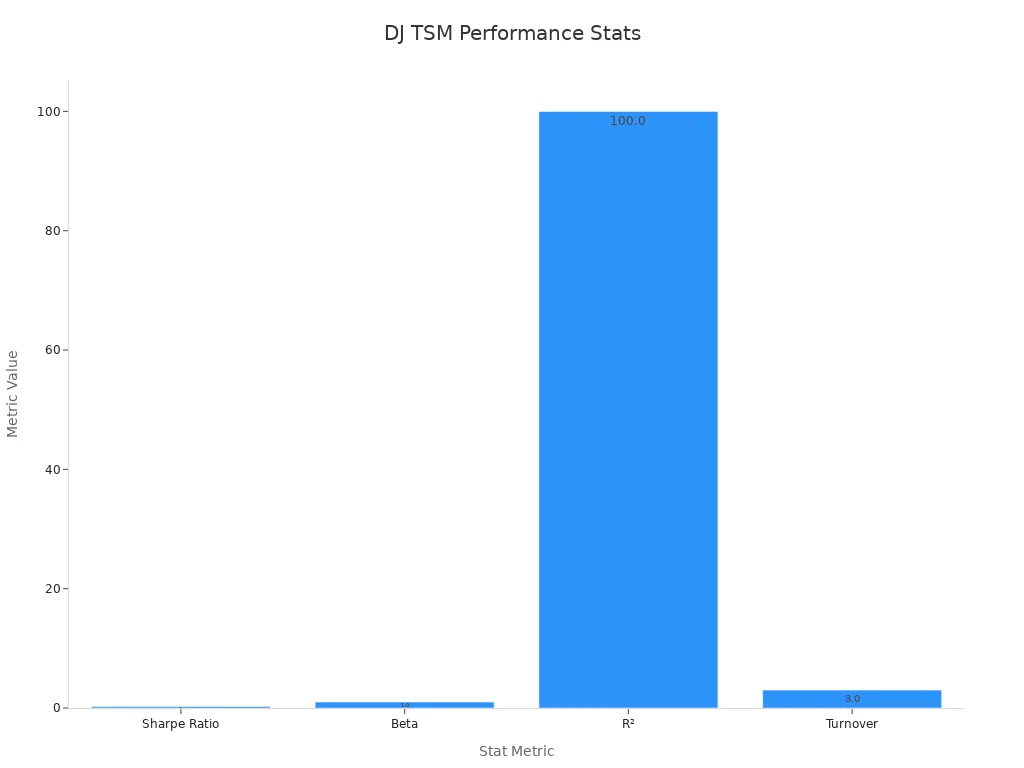
| Statistic | Value |
|---|---|
| Number of Holdings | 3,175 stocks |
| Market Capitalization | $219,287.10 million |
| Sharpe Ratio | 0.24 |
| Beta (vs FT Wilshire 5000) | 1.00 |
| R² (vs FT Wilshire 5000) | 100.00 |
| Turnover (annualized) | 3.00 |
| Net Assets | $947.3 million |
This table shows the size and coverage of the dow jones tsm. The index matches the performance of the total market very closely. The beta and R² values show a perfect match with the FT Wilshire 5000, another broad market index.
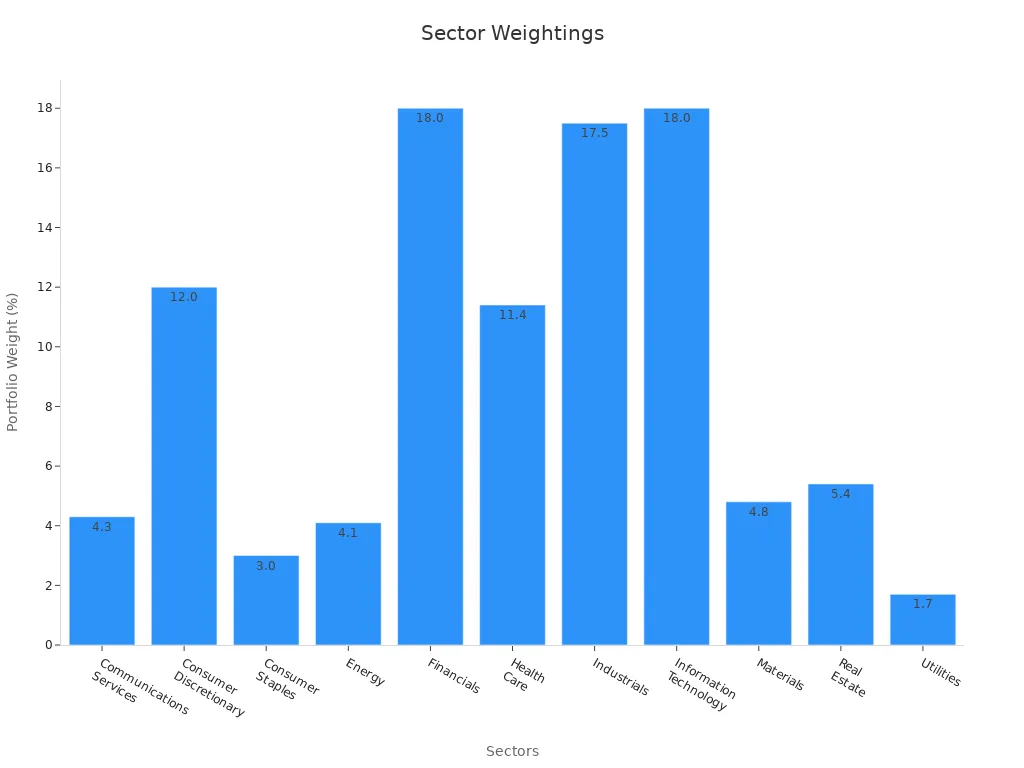
You also get a mix of sectors in the index. Here is a breakdown of the main sectors and their weights:
| Sector | Approximate Portfolio Weight |
|---|---|
| Communications Services | Around 4.3% |
| Consumer Discretionary | About 12.0% |
| Consumer Staples | Approximately 3.0% |
| Energy | Roughly 4.1% |
| Financials | Close to 18.0% |
| Health Care | Near 11.4% |
| Industrials | Approximately 17.5% |
| Information Technology | About 18.0% |
| Materials | Around 4.8% |
| Real Estate | Roughly 5.4% |
| Utilities | About 1.7% |
This sector mix helps you spread your risk across the whole market. You do not depend on just one type of stock. The dow jones tsm gives you a balanced view of the U.S. economy.
Tip: By following the dow jones tsm, you can track thousands of stocks and see how different sectors perform. This helps you make better choices for your investments.
Stock Market Index Comparison

Image Source: pexels
S&P Total Market Index
You may hear about the S&P Total Market Index when you look at broad stock benchmarks. This index tracks most U.S. stocks, including large, mid, small, and micro-cap companies. It covers about 3,700 stocks, giving you a wide view of the market. The S&P Total Market Index uses a market cap weighting method, so bigger companies have more influence on the index. You can use this index to measure stock market performance across all company sizes.
Note: The S&P 500, a related index, focuses only on large-cap stocks. It includes about 500 companies with a minimum market capitalization of $20.5 billion and at least 50% public float. The top 10 holdings make up more than 34% of the index weight, which can increase concentration risk.
Russell 3000
The Russell 3000 Index tracks the largest 3,000 U.S. companies. It updates every year to include new and growing stocks. This annual reconstitution helps the index reflect changes in the market. The Russell 3000 covers large-cap, mid-cap, and small-cap stocks, so you get a broad picture of the U.S. stock market. The index uses market cap weighting, just like the dow jones industrial average and S&P Total Market Index.
The Russell 3000 differs from the dow jones industrial average, which only tracks 30 large companies and leaves out sectors like transportation and utilities. The DJIA changes less often, so its stock selection stays more static. The Russell 3000’s frequent updates help you follow market movements more closely.
Key Differences
You can see important differences when you compare these indices. The dow jones industrial average, S&P Total Market Index, and Russell 3000 each use different methods and cover different stocks. The dow jones industrial average includes only 30 stocks, while the S&P Total Market Index and Russell 3000 include thousands. The DJIA focuses on large, established companies, but the other two give you exposure to a wider range of the market.
| Index Name | Number of Stocks | Market Cap Coverage | Rebalancing Frequency | Focus |
|---|---|---|---|---|
| Dow Jones Industrial Avg. | 30 | Large-cap | As needed | Blue-chip stocks |
| S&P Total Market Index | ~3,700 | Broad (all caps) | Quarterly | All U.S. stocks |
| Russell 3000 | 3,000 | Broad (all caps) | Annually | All U.S. stocks |
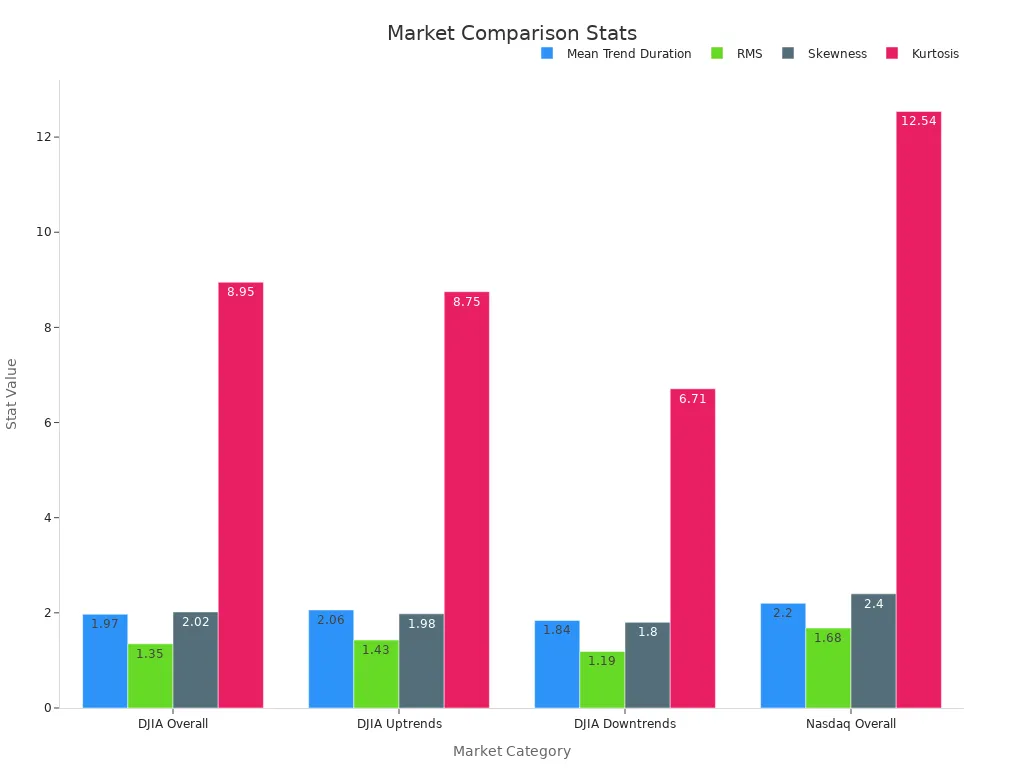
You can also look at how these indices behave. Empirical studies show that the DJIA has a mean trend duration of about 1.97 days, with a skewness of 2.02 and kurtosis of 8.95. The Nasdaq index, by comparison, has a higher mean trend duration and kurtosis, which means it experiences more extreme price swings. These differences affect how you might use each index to track stock market performance and market movements.
When you compare performance, you can use measures like CER (Constant Elasticity of Substitution), Sharpe Ratio, and the Herfindahl-Hirschman Index. CER helps you compare investment strategies and overall index performance. The Sharpe Ratio is a traditional metric, but CER may give you a better sense of risk and reward. The Herfindahl-Hirschman Index shows how diversified an index is, with lower values meaning less risk.
Tip: If you want broad exposure to the U.S. market, consider the S&P Total Market Index or Russell 3000. If you want to track blue-chip stocks, the dow jones industrial average may be a better fit.
Why the Index Matters
Benchmark for Funds
You often see the Dow Jones TSM used as a benchmark by mutual funds and ETFs. Fund managers compare their stock performance to this index to show how well they manage your money. Many funds track the index closely, so you can judge if a fund is doing better or worse than the overall market. For example, the Schwab U.S. Mid-Cap ETF (SCHM) uses a similar index as its benchmark. You can see how the fund’s returns stack up in the table below:
| Metric | Value |
|---|---|
| 1-Year Trailing Total Return | -0.3% |
| 3-Year Trailing Total Return | 38.3% |
| 5-Year Trailing Total Return | 72.7% |
| Expense Ratio | 0.04% |
| Assets Under Management (AUM) | $9.8 billion |
This table shows that funds using the index as a benchmark often have strong long-term performance and low costs. You can use these numbers to compare your own investments to the market.
Market Exposure
The index gives you broad exposure to the stock market. You get a mix of large, mid, small, and micro-cap stocks. This helps you track the overall performance of the market and the economy. You can see how the index reacts to changes in the U.S. economy, both in good times and during downturns. Here are some ways the index shows its market exposure:
- Scatter plots show how the index profits during both market upswings and downturns.
- Cumulative returns and drawdowns highlight the index’s resilience during crises like 2008 and the Covid-19 pandemic.
- Monthly return distributions reveal positive skewness and outliers, showing unique stock return patterns.
- Regression results confirm the index earns positive abnormal returns with limited exposure to traditional risk factors.
You can use these insights to understand how the index fits into your investment strategy.
Investor Use Cases
You can use the index as a research tool to study trends in the stock market and the economy. Many investors rely on the index to spot patterns and test new strategies. Over time, the index has become more popular for research because it captures both cyclical and seasonal price trends. For example:
- The Sharpe ratio of the original index strategy dropped after 2009, but new methods improved it from 0.07 to 0.75 between 2010 and 2018.
- The index effect appears in many international markets and is widely used in the commodity trading advisory industry.
- Enhanced strategies based on the index provide better risk-adjusted returns than simple buy-and-hold approaches.
You can use the index to build a diversified portfolio, manage risk, and make informed decisions about the economy and your investments.
You now understand how the Dow Jones TSM gives you a clear picture of the U.S. stock market. This knowledge helps you compare your investments and spot trends. You can use this index to guide your research or choose index-based funds for your portfolio. Take time to review your goals and see how broad market exposure can support your financial plans.
FAQ
What is the main benefit of investing in a fund that tracks the Dow Jones TSM?
You get exposure to almost the entire U.S. stock market. This helps you spread your risk across many companies and sectors. You can track the market’s performance with one investment.
How often does the Dow Jones TSM update its list of stocks?
The index reviews and updates its stock list regularly. Most changes happen quarterly. This keeps the index current and reflects new companies or market changes.
Can you invest directly in the Dow Jones TSM?
You cannot buy the index itself. You can invest in mutual funds or ETFs that track the Dow Jones TSM. These funds let you follow the index’s performance.
How does the Dow Jones TSM differ from the S&P 500?
The Dow Jones TSM covers thousands of stocks, including small and mid-sized companies. The S&P 500 only tracks about 500 large companies. You get broader market exposure with the Dow Jones TSM.
The Dow Jones TSM provides a broad lens on the U.S. stock market, but high cross-border fees and cumbersome overseas account requirements often deter investors from diversifying globally. BiyaPay eliminates these barriers, enabling you to invest in both U.S. and Hong Kong stock markets directly on its platform without needing an overseas account. It offers cost-free, real-time conversion of over 200 digital currencies, including USDT, into 30+ fiat currencies like USD and HKD, with remittance fees as low as 0.5%—far below traditional platforms. With a 1-minute BiyaPay account signup, you gain reliable, low-cost access to global markets, empowering you to build a diversified portfolio effortlessly.
Unlock global investing today! Join BiyaPay.
*This article is provided for general information purposes and does not constitute legal, tax or other professional advice from BiyaPay or its subsidiaries and its affiliates, and it is not intended as a substitute for obtaining advice from a financial advisor or any other professional.
We make no representations, warranties or warranties, express or implied, as to the accuracy, completeness or timeliness of the contents of this publication.


Contact Us
Company and Team
BiyaPay Products
Customer Services


is a broker-dealer registered with the U.S. Securities and Exchange Commission (SEC) (No.: 802-127417), member of the Financial Industry Regulatory Authority (FINRA) (CRD: 325027), member of the Securities Investor Protection Corporation (SIPC), and regulated by FINRA and SEC.
registered with the US Financial Crimes Enforcement Network (FinCEN), as a Money Services Business (MSB), registration number: 31000218637349, and regulated by FinCEN.
registered as Financial Service Provider (FSP number: FSP1007221) in New Zealand, and is a member of the Financial Dispute Resolution Scheme, a New Zealand independent dispute resolution service provider.