- EasyCard
- Trade
- Help
- Announcement
- Academy
- SWIFT Code
- Iban Number
- Referral
- Customer Service
- Blog
- Creator
Could a Market Crash Be Looming Experts Analyze 2025 Economic Trends


Image Source: unsplash
Some experts suggest a crash is coming in 2025, with J.P. Morgan placing the recession risk at 40%. The most pressing economic indicators include yield curve inversion, high valuations, and policy uncertainty. Recent signals from the u.s. economy also point to possible trouble. Economic indicators like GDP contraction and volatility in the market raise further concerns. Tariffs, shifting Fed policy, and global tensions add to the risk. Investors and the public must understand these signals as the crash is coming becomes a real concern.
Key Takeaways
- Experts warn that the risk of a recession in 2025 is rising, with trade policies and tariffs playing a major role in increasing uncertainty.
- Economic signs like shrinking GDP, falling consumer confidence, and rising unemployment show the U.S. economy is under stress and may face a downturn.
- The yield curve inversion remains a strong early warning of recessions, but investors should also watch other market signals like stock trends and volatility.
- High stock valuations and market overconfidence can increase the chance of a crash, especially if combined with slowing demand and policy uncertainty.
- Investors can protect themselves by diversifying portfolios, focusing on stable sectors, monitoring key warning signs, and seeking professional advice to manage risks.
2025 Recession Risk
Expert Views
Financial institutions and analysts have raised concerns about the 2025 recession risk. Many experts now see a higher chance of a downturn, with estimates reflecting growing uncertainty. The following table summarizes the latest recession probability estimates from leading sources:
| Institution / Source | Recession Probability Estimate for 2025 | Key Notes / Context |
|---|---|---|
| J.P. Morgan (April 2025) | 40% initially, raised to 60% | Cites disruptive U.S. trade policies and tariffs as major risk factors. |
| Apollo Global Management | 90% | Labels the risk as a “Voluntary Trade Reset Recession” driven by trade tariffs. |
| Goldman Sachs | Raised from 20% to 35%, then 45% | Internal models briefly considered 65% before tariff rollbacks; growth forecast cut to 1.3%. |
| S&P Global Ratings | 30-35% | Increased from 25% recently; aligns with other major banks’ cautious outlooks. |
| J.P. Morgan Private Bank Model | ~30% including yield curve; 12% excluding yield curve | Subjective view around 20%, reflecting tariff-related policy risks. |
J.P. Morgan Private Bank’s model, which combines several economic and financial indicators, currently estimates just under a 30% chance of recession in 2025 when including the yield curve signal. Without the yield curve, the probability drops to about 12%. Their subjective assessment stands at around 20%, with trade policy risks playing a major role. Goldman Sachs has also raised its recession probability, cutting its growth forecast to 1.3%. Apollo Global Management sees the highest risk, calling it a “Voluntary Trade Reset Recession” due to tariffs. S&P Global Ratings and other major banks have also increased their estimates, reflecting a cautious outlook.
The St. Louis Fed notes that recession probability models offer useful snapshots but do not provide definitive real-time calls. These models depend on the data and inputs used, and sometimes indicators like the Sahm rule may give false alarms or lag behind actual economic conditions. Investors should treat these probabilities as important signals, but not as absolute predictions.
Historical Patterns
History shows that certain recession signals often appear before a financial crisis or major market downturn. Analysts have identified several statistical patterns that tend to repeat before crashes:
- Increased co-movement among stocks, where a large fraction of stocks move in the same direction, often rises before a crash. This pattern serves as a critical early warning indicator and outperforms traditional measures like volatility and correlations.
- The co-movement measure captures collective panic or nervousness in the market. This systemic risk can make the market vulnerable to self-induced panic.
- The model based on co-movement has shown exceptional predictive power, correctly anticipating the largest one-day crashes over the past 25 years without false positives or negatives.
- High co-movement uniquely identifies major events such as the 2008 financial crisis, even without parameter tuning.
- Financial bubbles across history often follow a similar path: rapid price increases, then an abrupt regime change, such as a crash or correction.
- Statistical methods like CUSUM change-point detection help pinpoint the timing of bubble bursts and phases. These methods improve precision in dating crashes compared to older approaches.
- Despite different causes, bubbles and crashes share common statistical signatures. This suggests that history often repeats itself in market downturns.
- These patterns provide useful early warning signals for both market participants and regulators.
Note: While these signals offer valuable insights, no single indicator can guarantee a recession or crisis. Investors should use a combination of models, historical patterns, and current data to assess risk.
Economy Warning Signs
Image Source: pexels
GDP Trends
Recent economic data shows clear signs of stress in the u.s. economy. In Q1 2025, GDP contracted at an annualized rate of -0.2%. This marks the first quarterly decline in three years. The contraction stands out against the long-term average GDP growth rate of 3.20%. The table below compares recent and historical GDP performance:
| Period/Measure | GDP Growth Rate / Contraction | Notes / Contextual Factors |
|---|---|---|
| Q1 2025 (US) | -0.2% annualized contraction | First quarterly decline in 3 years; weaker consumer spending (1.2%), imports surged 42.6%, government spending dropped 4.6%, fixed investment rose 7.8% |
| Historical Average (1947-2025) | 3.20% average growth | Long-term average growth rate |
| Q3 2020 | +35.2% growth | Record high growth during COVID-19 rebound |
| Q2 2020 | -28.1% contraction | Record low during COVID-19 pandemic lockdowns |
| Full Year 2024 | 2.80% growth | Slightly lower than previous 2.90% |
| Annual Growth Mar 2025 | 2.10% growth | Decline from previous 2.50% |
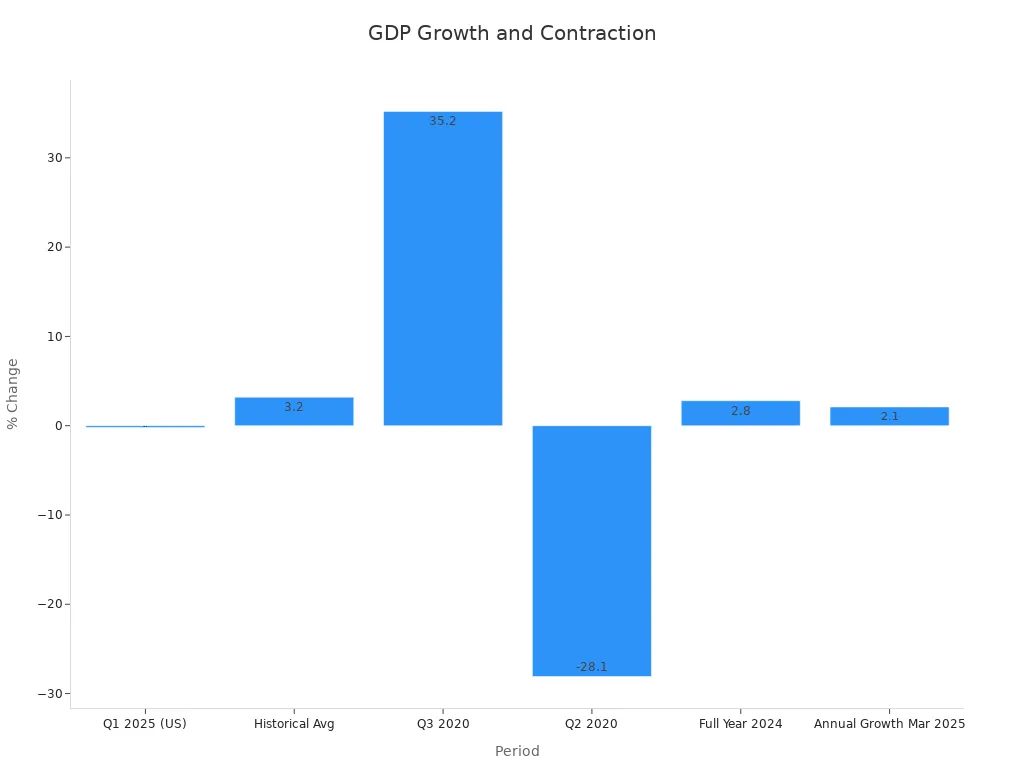
Sharp swings in GDP, such as those seen during the COVID-19 pandemic, highlight the volatility in the economy. The recent declining gdp growth and contraction rates serve as strong economic warnings and recession signals.
Consumer Confidence
Consumer sentiment has weakened, reflecting growing unease about the economy. In March 2025, the University of Michigan Consumer Sentiment Index dropped to 57, the lowest since November 2022. This decline followed new tariffs and trade policy changes that disrupted supply chains. Manufacturing indices also moved into contraction, adding to concerns. The table below shows recent trends in consumer sentiment:
| Consumer Sentiment Index Component | Current Value | Previous Month | Peak Value (Dec 2024) | Monthly Change | Change Since Peak |
|---|---|---|---|---|---|
| Index of Consumer Sentiment | 60.5 | 52.2 | 68.2 | +15.9% | -11.3% |
| Current Economic Conditions | 63.7 | 58.9 | 65.9 | +8.1% | -3.3% |
| Index of Consumer Expectations | 58.4 | 47.9 | 69.6 | +21.9% | -16.1% |
Although sentiment improved to 71.5 in June 2025, it remains below the December 2024 peak. Real disposable income growth slowed, and retail sales showed mixed results. These indicators point to a fragile recovery, with the economy sensitive to further shocks.
Labor Market
The labor market now shows clear signs of stress. Unemployment rates have risen steadily, and continued unemployment insurance claims have increased. The table below tracks these changes:
| Report Date | Continued Unemployment Insurance Claims (%) | Unemployment Rate (%) |
|---|---|---|
| 2025-03-08 | 83.0 | 4.4 |
| 2025-03-15 | 89.9 | 4.3 |
| 2025-03-22 | 91.5 | 4.5 |
| 2025-03-29 | 93.2 | 4.4 |
| 2025-04-05 | 93.1 | 4.3 |
| 2025-04-12 | 95.1 | 4.5 |
| 2025-04-19 | 96.3 | 5.0 |
| 2025-04-26 | 95.7 | 5.6 |
| 2025-05-03 | 92.8 | 5.7 |
| 2025-05-10 | 90.2 | 6.2 |
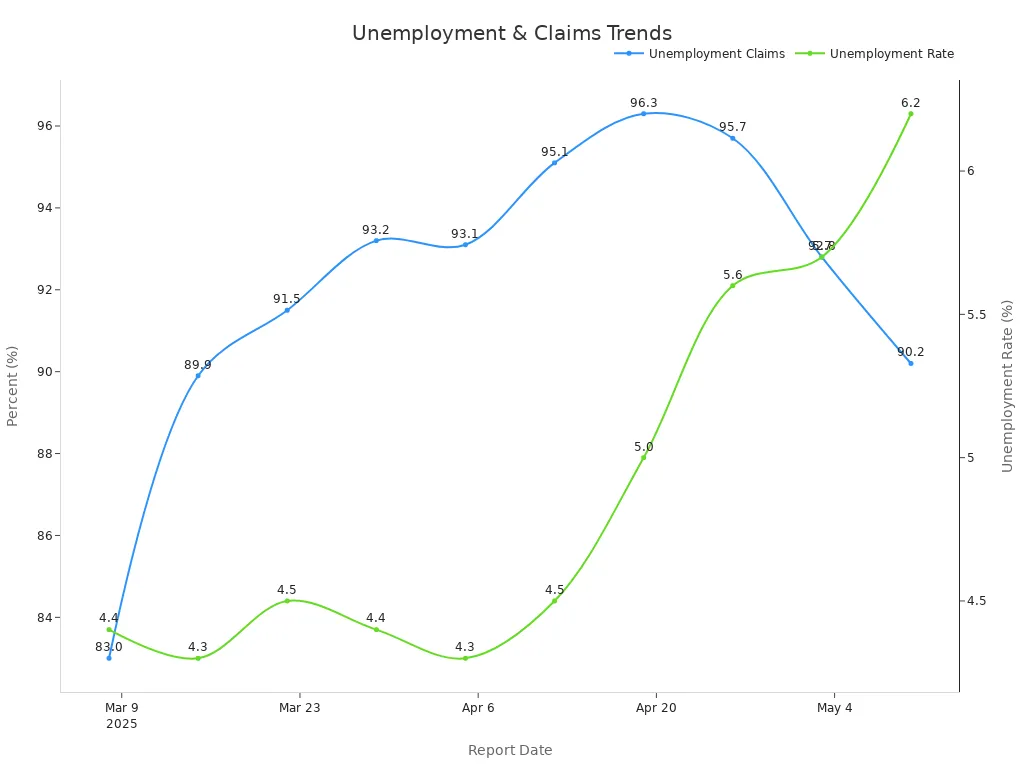
Rising unemployment and slowing payroll growth suggest mounting recession signals. The unemployment rate climbed from 4.4% in early March to 6.2% by mid-May 2025. These indicators confirm that the downturn is spreading across the labor market, adding to the overall economic risk.
Yield Curve and Crash Signals
Yield Curve Inversion
The yield curve inversion stands out as one of the most reliable early warning signals for economic downturns. When short-term interest rates rise above long-term rates, the yield curve inverts. This pattern reflects investor expectations of slower growth ahead. Over the past 50 years, every U.S. recession followed an inverting yield curve. The 10-Year minus 3-Month Treasury yield spread turning negative has consistently preceded market downturns.
The table below highlights historical periods when the yield curve inverted and the resulting market impact:
| Inversion Period | Duration (Months) | Recession Start (Relative to Inversion End) | Market Impact (S&P 500 Return) |
|---|---|---|---|
| Dec 1968 - Feb 1970 | 14 | 1 month before inversion ended | -25% decline |
| Jun 1973 - Nov 1974 | 18 | 11 months before inversion ended | -33% decline |
| Nov 1978 - Apr 1980 | 18 | 3 months before inversion ended | +5% |
| Oct 1980 - Sep 1981 | 11 | 1 month before inversion ended | -6% decline |
| May 1989 - Nov 1989 | 6 | 10 months after inversion ended | +7% |
| Jul 2000 - Jan 2001 | 7 | 3 months after inversion ended | -22% decline |
| Feb 2006 - Aug 2007 | 19 | 6 months after inversion ended | -34% decline |
| May 2019 - Mar 2020 | 11 | 1 month after inversion ended | +6% |
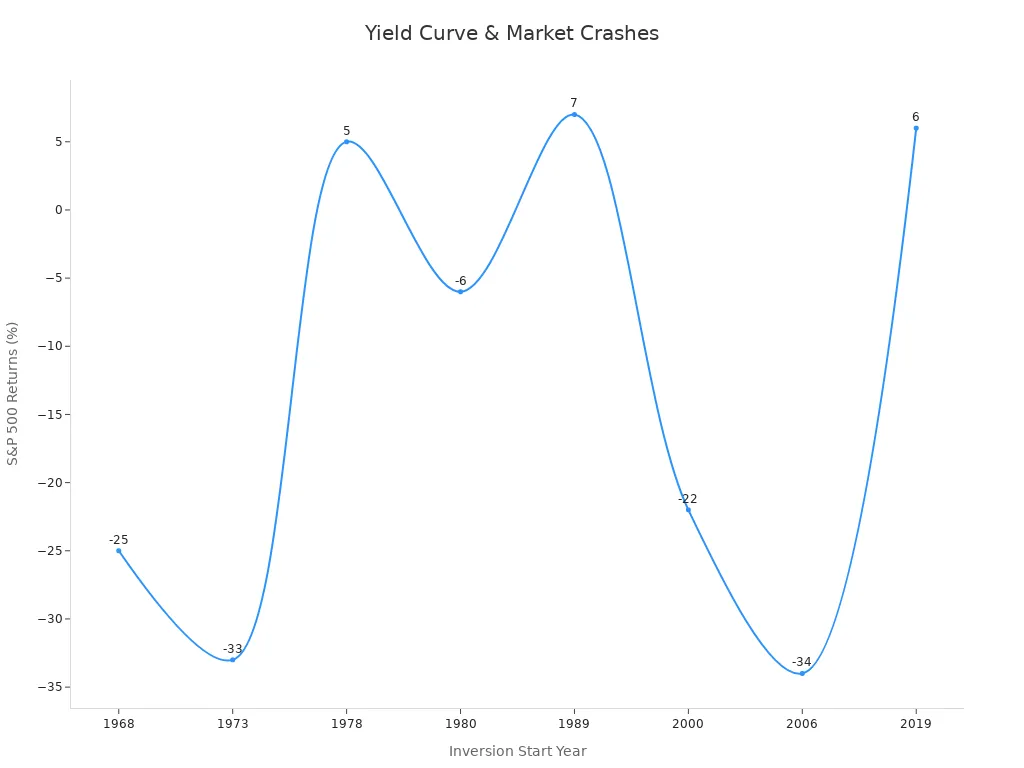
Although the yield curve remains a strong predictor, modern factors like unconventional monetary policy and global influences may affect its reliability. Investors should use the yield curve alongside other indicators for a complete view.
Technical Market Indicators
Technical market indicators provide additional insight into potential downturns. Several key signals have emerged in recent months:
- The S&P 500 index trading below its 200-day moving average often signals market weakness.
- Relative Strength Index (RSI) values near 37% to 42% show the index is not oversold but could face further declines.
- Negative MACD oscillator values reinforce bearish momentum and a downtrend.
- Prolonged trading below the 200-day moving average may increase selling pressure and volatility.
- Sector rotation can occur, with cyclical sectors underperforming and defensive sectors gaining as investors seek safety.
- Rising volatility, measured by the VIX, and widening credit spreads often accompany these technical breaches.
These indicators, when combined with an inverting yield curve, suggest heightened risk for the market. Investors should monitor these signals closely to anticipate possible corrections.
Inflation, Fed Policy, and Recession
Inflation Data
Recent economic data shows that inflation remains a major concern for both consumers and policymakers. Several trends highlight the growing uncertainty:
- Short-term inflation disagreement rose sharply during both the Great Recession and the Covid-19 pandemic, jumping from about 3 percentage points to nearly 7 percentage points. This increase signals that consumers do not agree on where prices are heading.
- During the Covid-19 pandemic, inflation disagreement at the one-year horizon increased by about 1.4 standard deviations, which is a significant jump.
- Median short-term inflation expectations increased less during the pandemic (about 1 percentage point) than during the Great Recession (about 2 percentage points). However, disagreement and uncertainty about inflation remain high.
- Long-term inflation expectations stayed stable, but the rise in disagreement at shorter horizons suggests that inflation expectations could become unanchored.
- Policymakers worry that high inflation disagreement and uncertainty may signal instability in inflation expectations, which can raise the risk of a recession.
- At the peak of inflation in June 2022, low-income households faced inflation rates around 18.6%, just below the middle-income group’s 19%, and above the highest-income group’s 16%.
- Financial stress from rising prices hit low-income households hardest, with 64% reporting being “very stressed,” compared to only 17% of the highest-income group.
- This uneven impact increases recession concerns by making lower-income groups more financially vulnerable.
Federal Reserve Actions
The Federal Reserve has responded to inflation and economic uncertainty with a mix of policy easing and tightening. These actions have had a direct effect on market volatility and stock prices. The Chicago Fed’s model breaks down the impact of policy changes on stock prices:
| Time Period | Total Effect on Stock Prices | Expected Nominal Profits | Risk-Free Discounting | Residual/Risk Premium |
|---|---|---|---|---|
| Dec 2019 – Mar 2020 | +0.22 | +0.09 | +0.06 | +0.08 |
| Mar 2020 – Sep 2020 | +0.24 | +0.09 | +0.07 | +0.08 |
| Sep 2020 – Dec 2021 | –0.29 | –0.08 | –0.08 | –0.11 |
| Dec 2021 – Mar 2022 | –0.32 | –0.11 | –0.09 | –0.11 |
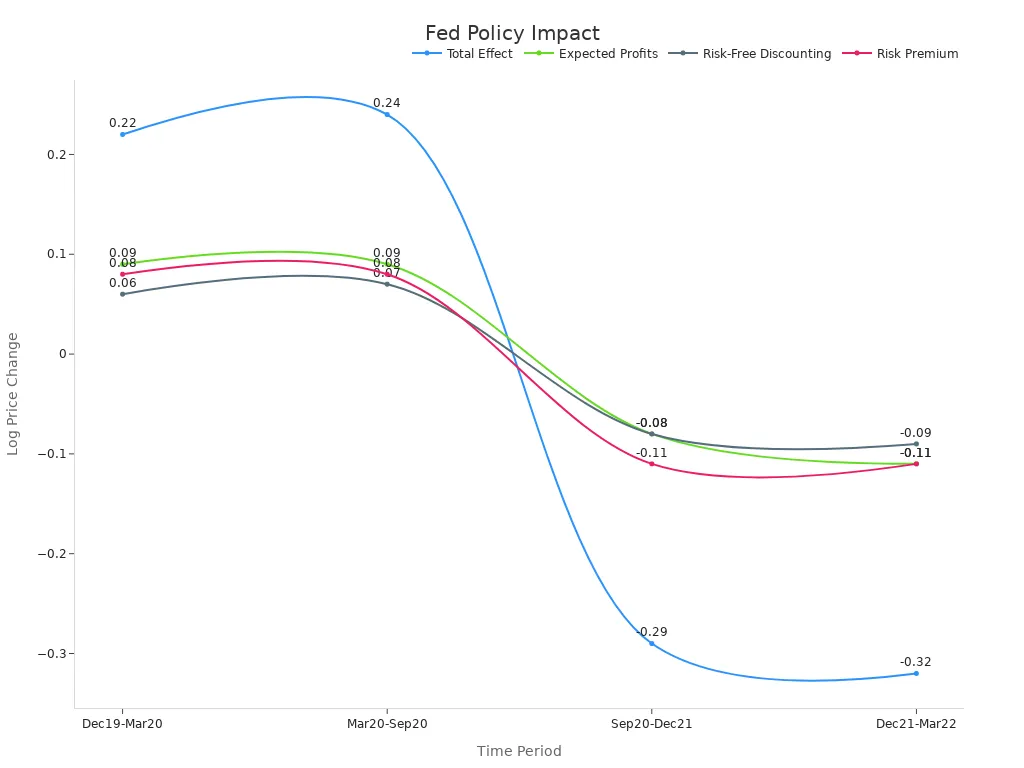
Early in the Covid-19 crisis, the Fed’s policy easing helped boost stock prices and support recovery. Later, as the Fed tightened policy to fight inflation, stock prices fell. Changes in risk premiums played a large role in these moves, showing how policy can drive market swings.
Note: As the Fed continues to reduce its balance sheet and normalize policy, short-term funding markets have seen more volatility. Repo market rates now show more month-end swings, reflecting tighter liquidity conditions. These shifts add to the uncertainty facing investors and increase the risk of recession.
Tariffs, Geopolitics, and Market Volatility

Image Source: pexels
Tariff Impacts
Tariffs introduced in early 2025 changed the economic landscape. The new U.S. tariffs, which set a 10% base duty and higher reciprocal rates, created immediate and significant increases in global market volatility. These tariffs made supply chains less stable and caused raw material costs to swing. As a result, inflation forecasts became less reliable. The VIX index, which tracks market volatility, showed sharp spikes after the tariffs took effect. Investors saw capital move out of emerging markets, and investment flows shifted quickly. Bond yields rose by 25 to 30 basis points across the Treasury curve in May, reflecting higher risk pricing. Even though inflation data stayed flat or below expectations, consumer sentiment dropped. Political debates about trade policy added more uncertainty. The feedback loop of trade restrictions and anticipation of retaliatory measures amplified inflation expectations and pricing uncertainty. These changes made the market more sensitive to news and policy shifts, with effects lasting beyond the initial announcements.
Note: Tariff-driven disruptions often create a cycle of uncertainty, making it harder for businesses and investors to plan for the future.
Geopolitical Tensions
Geopolitical risks have a long history of increasing economic uncertainty. Major events, such as wars or trade frictions, often cause short-term drops in equity returns and higher market uncertainty. The table below highlights the impact of key geopolitical events:
| Geopolitical Event Period | Market Impact (S&P 500 Returns) | Duration of Impact |
|---|---|---|
| 1940 (Germany’s invasion of France) to 2022 (Russia’s invasion of Ukraine) | Average underperformance for 3 months | 3 months (short-term), returns normalize by 6-12 months |
| 1973 Arab Oil Embargo | Significant and prolonged negative returns | Over 12 months (long-term) |
Empirical studies show that geopolitical risks increase oil price swings, which then raise market uncertainty. For example, analysis of 32 major events since 1859 found that oil prices rise with geopolitical risk. Research also shows that in China, geopolitical risk shocks have a stronger effect on the financial cycle than economic policy uncertainty. Trade-related tensions, such as those seen from 2018 to 2022, led to higher economic costs, supply chain disruptions, and increased financial risk for firms. These factors combine to amplify uncertainty and make the market more volatile during economic cycles.
Crash Is Coming? Market Outlook
Overvaluation Risks
Many analysts warn that the crash is coming because stock prices have reached levels that do not match the real value of companies. High valuations often signal trouble ahead for the market. When prices rise much faster than earnings or sales, the risk of a stock market crash increases. The dotcom bubble in 2000 stands as a clear example. During that period, technology stocks traded at nearly 70 times their expected earnings, even though many companies had little or no profit. This disconnect led to a severe crash, with the market losing up to 80% of its value over three years. Investors waited 16 years for a full recovery. Unlike other downturns, such as the 2008 financial crisis or the 2020 pandemic, the dotcom crash was driven by speculation and high valuations, not by outside shocks.
Experts like Barry Ritholtz explain that bubbles form when asset prices move far away from their true worth. This creates a perfect storm where speculation grows, and the risk of significant losses rises. When the crash is coming, investors often ignore warning signs until it is too late.
Today, some sectors show similar signs. Price-to-earnings ratios in technology and growth stocks remain well above historical averages. Demand has started to slow, but prices have not adjusted. This creates a situation where even a small negative event could trigger a sharp market downturn. Investors should remember that high valuations alone can set the stage for a crash, especially when combined with slowing demand and policy uncertainty.
Sector Performance
Not all sectors face the same level of risk when the crash is coming. Some areas of the market have shown resilience during past downturns, while others have suffered the most. Understanding which sectors can weather a downturn helps investors make better decisions.
- Large-cap industrials, consumer staples, healthcare, and technology have often performed better during market downturns. For example, during the 2008 financial crisis, a fund focused on these sectors lost 28%, while the S&P 500 dropped 37%. This smaller loss shows greater stability.
- After the 2008 crisis, the same fund achieved a 10-year annualized return of 1%, compared to the S&P 500’s negative 3%. This difference highlights the ability of certain sectors to recover faster.
- Defensive holdings, such as UnitedHealth Group in healthcare and Apple in technology, helped balance growth and stability. These companies had strong cash flows, manageable debt, and global reach.
- By 2024, the fund’s five-year return reached 15.53%, showing strong recovery even after the 2020 pandemic downturn.
Sectors with stable cash flows, durable business models, and reasonable prices tend to survive a crash better. Materials and consumer staples often see steady demand, even when the economy slows. Healthcare remains essential, so it usually avoids the worst losses. Technology can also show strength if companies have solid profits and low debt.
On the other hand, sectors tied to consumer spending, travel, or luxury goods face higher risk. These areas often see the biggest drops when the crash is coming. Investors in these sectors may experience significant losses if the market turns sharply.
Note: Diversification across resilient sectors can help reduce risk. Investors should focus on companies with strong balance sheets and proven ability to manage through tough times.
Action Steps for Investors
Warning Signs to Watch
Investors can protect their portfolios by monitoring key market indicators. These signals often provide early warnings before a downturn.
- Liquidity Coverage Ratio (LCR) falling below safe levels signals stress in financial institutions.
- Rapid asset growth, especially when funded by unstable sources, can indicate rising risk.
- Widening spreads on debts and credit default swaps show that markets expect higher risk of default.
- Rising funding costs, both wholesale and retail, suggest tightening financial conditions.
- Increasing retail deposit outflows and early redemptions of certificates of deposit (CDs) may point to declining confidence.
- Difficulty accessing short-term or longer-term funding markets can signal deeper problems.
Banks and regulators often use a stoplight system to track these indicators: green means normal, amber signals caution, and red requires immediate action. Investors should look for changes across daily, weekly, and monthly data. Quick responses to these warning signs help reduce losses.
Tip: Monitoring unemployment trends alongside these indicators can provide a fuller picture of economic health.
Defensive Strategies
Defensive strategies help investors manage risk during uncertain times. Diversification remains a proven approach. Portfolios with a mix of conservative U.S. and international stocks, especially those with strong balance sheets and low volatility, have shown resilience in past recessions. High-quality U.S. Treasury bonds and Treasury Inflation-Protected Securities (TIPS) often rise when stocks fall, providing a buffer against losses.
Alternative assets, such as hedge funds and derivatives, offer additional protection because they do not always move with traditional markets. Historical data from the 2000-2002 and 2007-2009 recessions show that U.S. Treasuries, corporate bonds, gold, and real estate often outperformed stocks or cushioned losses. For example, during the 2008 financial crisis, U.S. Treasuries gained 22.5% while the S&P 500 dropped 37%.
Investing in alternative assets like art and collectibles can also help. These assets tend to keep or increase their value during market downturns. Platforms now make it easier for investors to access fine art with lower capital requirements.
Note: Working with financial professionals can help investors build and maintain a defensive portfolio. Regular reviews and rebalancing are key to managing risk as market conditions change.
Market risks in 2025 remain significant, but predictions do not guarantee a crash. Economic research from the Federal Reserve Bank of San Francisco shows that past crises caused lasting losses, with lifetime income dropping by $70,000 per person and employment falling 5.5%. Deloitte’s 2025 outlook projects moderate growth, with some sectors facing challenges while others recover. Investors should track key indicators, review expert analysis, and maintain diversified portfolios. Staying informed and consulting financial professionals helps manage uncertainty and supports long-term financial health.
FAQ
What is a yield curve inversion and why does it matter?
A yield curve inversion happens when short-term interest rates rise above long-term rates. This signal often predicts a recession. Investors watch this indicator closely because it has preceded every U.S. recession in the past 50 years.
How do tariffs impact the stock market?
Tariffs increase costs for businesses and consumers. They can disrupt supply chains and raise uncertainty. Markets often react with higher volatility. For example, new U.S. tariffs in 2025 caused the VIX index to spike and bond yields to rise by 25–30 basis points.
Which sectors usually perform best during a downturn?
Defensive sectors like healthcare, consumer staples, and materials often show resilience.
These sectors provide essential goods and services, so demand remains steady even when the economy slows.
What steps can investors take to reduce risk before a potential crash?
- Diversify across sectors and asset classes.
- Monitor key indicators, such as unemployment and credit spreads.
- Consider U.S. Treasury bonds or Treasury Inflation-Protected Securities (TIPS).
- Consult financial professionals for tailored strategies.
With experts warning of a potential 2025 market crash driven by yield curve inversions, high valuations, and tariff-induced uncertainty, investors face a complex landscape marked by rising recession risks and market volatility. Navigating these challenges requires cost-effective, flexible platforms to diversify globally without the burden of high fees or complex overseas account setups. BiyaPay offers a robust solution, enabling you to invest in both U.S. and Hong Kong stock markets directly on its platform without needing an overseas account. With real-time, fee-free conversion of over 200 digital currencies, including USDT, into 30+ fiat currencies like USD and HKD, and cross-border remittance fees as low as 0.5%, BiyaPay provides unmatched efficiency compared to traditional platforms. A 1-minute BiyaPay account registration grants secure, rapid access to global markets, empowering you to build a resilient, diversified portfolio to weather economic uncertainties.
Protect your investments in uncertain times! Join BiyaPay.
*This article is provided for general information purposes and does not constitute legal, tax or other professional advice from BiyaPay or its subsidiaries and its affiliates, and it is not intended as a substitute for obtaining advice from a financial advisor or any other professional.
We make no representations, warranties or warranties, express or implied, as to the accuracy, completeness or timeliness of the contents of this publication.


Contact Us
Company and Team
BiyaPay Products
Customer Services


is a broker-dealer registered with the U.S. Securities and Exchange Commission (SEC) (No.: 802-127417), member of the Financial Industry Regulatory Authority (FINRA) (CRD: 325027), member of the Securities Investor Protection Corporation (SIPC), and regulated by FINRA and SEC.
registered with the US Financial Crimes Enforcement Network (FinCEN), as a Money Services Business (MSB), registration number: 31000218637349, and regulated by FinCEN.
registered as Financial Service Provider (FSP number: FSP1007221) in New Zealand, and is a member of the Financial Dispute Resolution Scheme, a New Zealand independent dispute resolution service provider.