- EasyCard
- Trade
- Help
- Announcement
- Academy
- SWIFT Code
- Iban Number
- Referral
- Customer Service
- Blog
- Creator
What Are the Main Causes of the Market Crash in 2025


Image Source: pexels
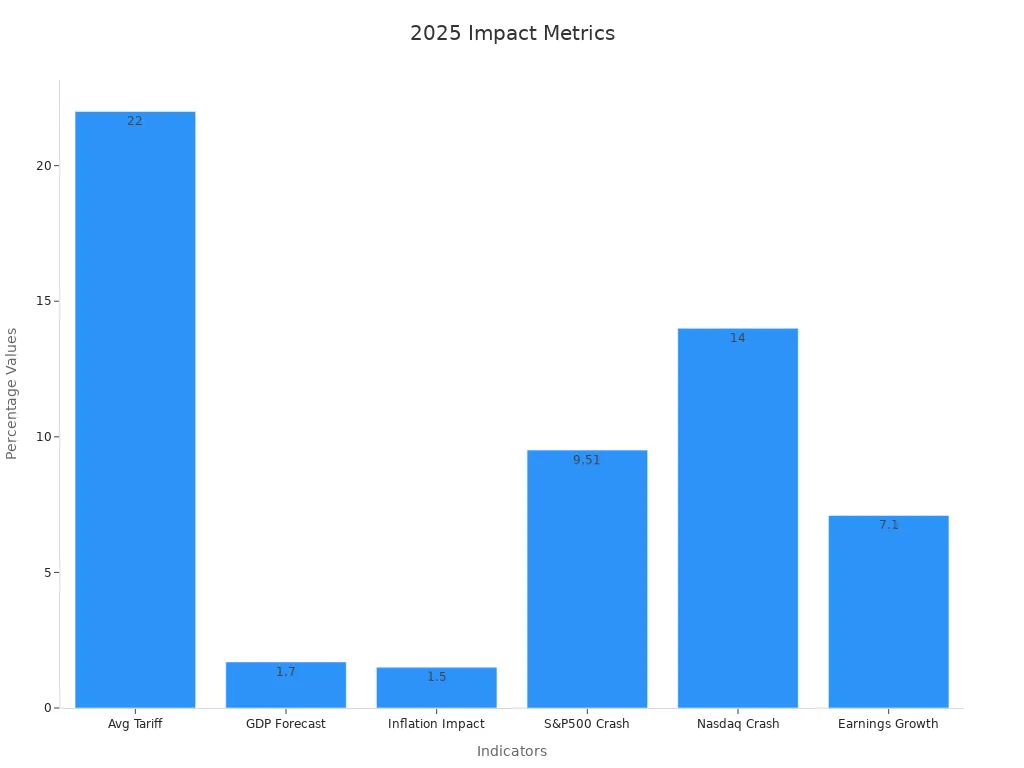
A series of aggressive tariff hikes, persistent inflation, Federal Reserve rate increases, high stock valuations, global geopolitical tensions, and business bankruptcies triggered the market crash 2025. These causes affected both investors and businesses. The average U.S. tariff rate reached about 22%, the highest in a century, while tariffs on China soared above 60%. The market responded with a 9.51% drop in the S&P 500 and a 14% decline in the Nasdaq, signaling sharp economic stress.
| Indicator | Data / Value | Explanation / Impact |
|---|---|---|
| Average U.S. Tariff Rate | ~22% (highest in a century) | Result of April 2nd tariff announcement; aggressive tariff hikes increasing trade costs |
| Tariffs on China | Potentially >60% combined | Severe impact on a major trading partner, amplifying economic pressures |
| GDP Growth Forecast 2025 | Revised down to 1.7% (from 2.1%) | Reflects expected economic slowdown due to tariffs and related uncertainties |
| Inflation Impact from Tariffs | Up to +1.5% consumer inflation increase | Tariffs expected to raise production and consumer prices, contributing to stagflation concerns |
| S&P 500 Decline | ~9.51% drop from Feb 19 peak | Significant equity market correction reflecting investor reaction to economic and tariff risks |
| Nasdaq Decline | ~14% drop from Dec 2024 record | Technology sector hit harder, contributing to overall market downturn |
Key Takeaways
- The 2025 market crash happened because of big tariff increases, ongoing inflation, higher interest rates, very high stock prices, and global political tensions.
- Tariffs raised costs for businesses and consumers, causing economic slowdown and making investors nervous.
- Inflation stayed high, making it harder for families and companies to plan budgets and prices.
- The Federal Reserve used interest rate tools to keep the market stable during uncertain times.
- Investors can protect their money by keeping a long-term view, diversifying their portfolio, holding cash for emergencies, and adjusting investments based on their risk tolerance.
Tariffs and Trade Policy
Image Source: unsplash
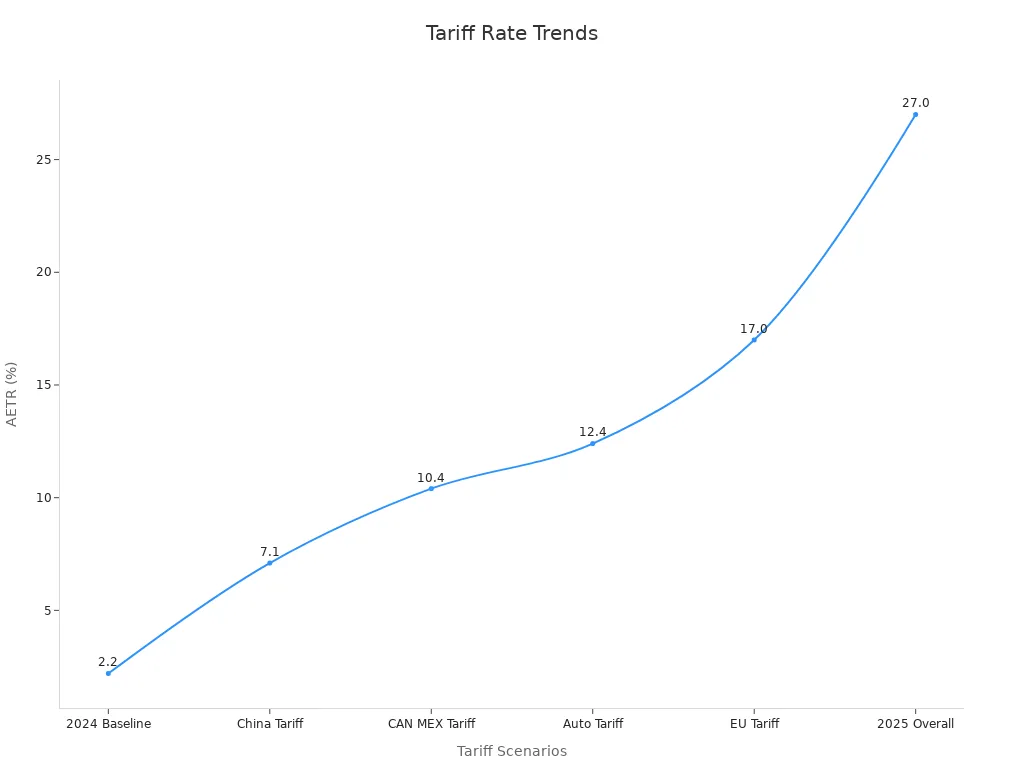
Tariff Hikes in 2025
In 2025, the United States government raised tariffs sharply on many imports. The average effective tariff rate jumped from 2.2% in 2024 to 27% by April 2025. This marked the highest level since 1903. Tariffs on Chinese goods soared, reaching as high as 145%. The government also placed new tariffs on products from Canada, Mexico, and the European Union. These actions increased costs for businesses and consumers. Many companies reported that tariffs became their top business concern in early 2025. Over 30% of firms said tariffs could cause a recession, up from just 8.3% the year before.
The table below shows how past and recent tariff changes affected the economy and markets:
| Period/Date | Tariff Policy | Market/Economic Impact |
|---|---|---|
| 1930 | Smoot-Hawley Tariffs | Worsened the Great Depression but was not the primary cause; tariffs increased economic distress. |
| 1922 | Fordney-McCumber Tariff | Doubled duties; caused economic distortions and retaliation but did not trigger a crisis; preceded the Roaring Twenties. |
| April 2, 2025 | U.S. aggressive tariff announcement (10%+ tariffs) | Immediate 4% drop in S&P 500; increased market volatility; inflationary pressures; downgraded global growth outlook. |
Trade Uncertainty and Market Crash 2025
Sudden changes in trade policy created confusion for investors and businesses. On April 2, 2025, the announcement of sweeping tariffs led to a sharp sell-off in stocks. The S&P 500 dropped over 10% in just two days. The Dow Jones also fell. Many experts warned that tariffs could cause a recession. The International Monetary Fund lowered its global growth forecast from 3.3% to 2.8%. The U.S. growth outlook dropped to 1.8%, and the chance of a recession rose to 40%.
Trade tensions also led to global supply chain disruptions. Companies faced higher import costs and squeezed profit margins. Inflation expectations reached a three-decade high of 4.1%. While the Federal Reserve did not raise interest rates quickly, the overall economic outlook became more uncertain. The 2025 market crash showed how quickly markets can react to trade policy shocks. History shows that aggressive tariffs often bring market volatility and economic risks. Many businesses and investors learned that tariffs could cause a recession, especially when combined with other pressures.
Inflation and Interest Rates
Persistent Inflation
Rising inflation remained a major concern in 2025. Many economic experts noticed that prices did not fall as quickly as expected. Several financial factors contributed to this trend:
- The Congressional Budget Office projected that overall inflation would decline through 2025, but nonenergy services stayed expensive because of tight labor markets and steady wage growth.
- The Federal Reserve’s earlier actions in 2023 and 2024 slowed demand, but inflation in some sectors continued.
- Short-term Treasury interest rates stayed high in early 2024, which made borrowing more costly for businesses and families.
- Inflation in the first quarter of each year often ran higher than average. For example, core PCE inflation in January 2023 and 2024 reached about 6% annualized, much higher than other months.
- In early 2025, core PCE inflation was predicted to stay around 2.7% annualized. If monthly inflation stayed high, the yearly rate would remain near 2.8%. This showed that inflation was persistent, especially compared to earlier economic cycles.
Note: Persistent inflation in 2025 made it harder for families to plan their budgets and for businesses to set prices. Many investors watched these trends closely.
Federal Reserve Rate Hikes
Interest rate hikes by the Federal Reserve played a key role in shaping the economic landscape in 2025. The central bank kept the effective federal funds rate within its target range, which helped control inflation and maintain market stability. The following table highlights how these actions affected financial markets:
| Aspect | Evidence/Action | Impact on Market Stability |
|---|---|---|
| Effective Federal Funds Rate (EFFR) | Stayed within target range | Helped prevent market volatility |
| Repo Rates | Remained steady with low volatility | Avoided rapid unwinding of trades and market disruptions |
| Leveraged Funds’ Short Treasury Futures | About $1 trillion in March 2025 | Stability prevented forced selling and financial stress |
| Basis Trade Behavior | Basis remained stable, unlike the 100 basis point jump in March 2020 | Prevented sharp disruptions seen in past crises |
| Monetary Policy Tools | Used ON RRP and SRF to support liquidity | Maintained funding and dampened upward pressure on rates |
These actions by the Federal Reserve helped keep the economic system stable during a period of uncertainty. By using technical operations and liquidity tools, the central bank reduced the risk of sudden market shocks. Investors and businesses relied on these measures to navigate the challenges of 2025.
Geopolitical Tensions
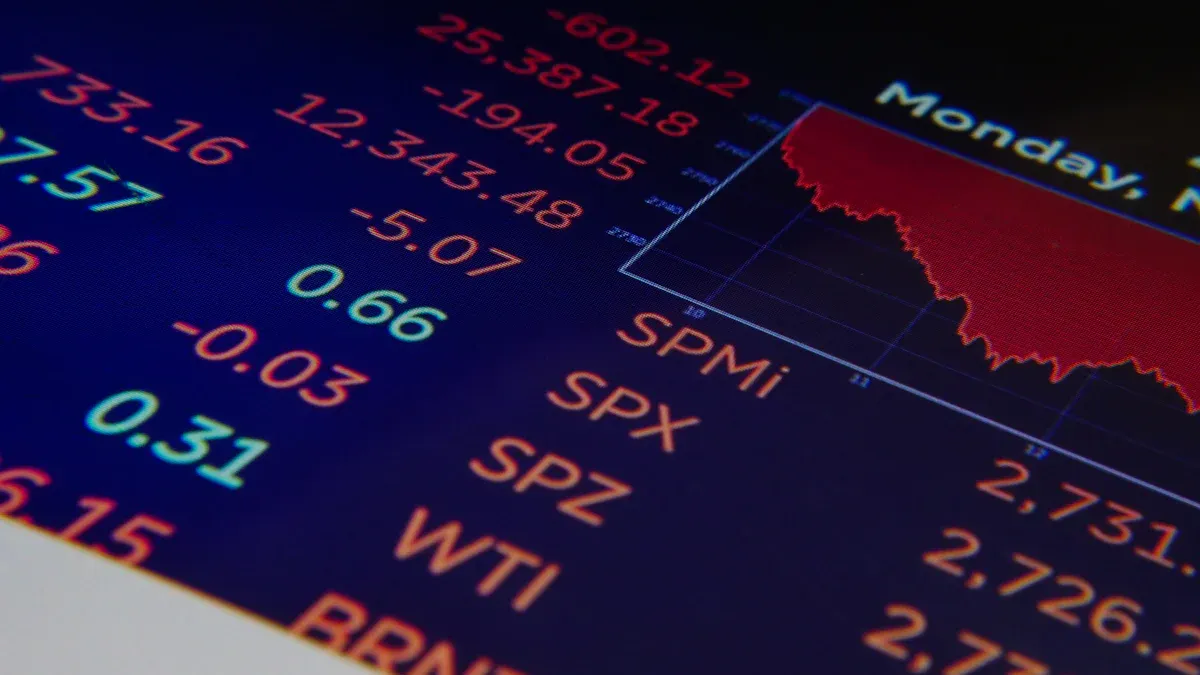
Image Source: pexels
Global Instability
Geopolitical tensions in 2025 created a challenging environment for investors and businesses. Several global events increased uncertainty and made planning difficult. Many countries experienced shifts in power, new trade alliances, and changing economic centers. Governments introduced new regulations and tax rules, which varied across regions. Technology also played a role, with rapid changes in artificial intelligence and quantum computing. These factors led to threats against supply chains, assets, and infrastructure.
BlackRock’s risk dashboard showed that regional wars, U.S.-China competition, cyberattacks, and Russia-NATO tensions all affected markets. Asset prices, such as currencies and commodities like Brent crude oil, became more sensitive to news about conflicts. Companies faced pressures from aging populations and the need to integrate new technology into their workforces. These trends forced businesses to rethink their strategies and focus on managing risks.
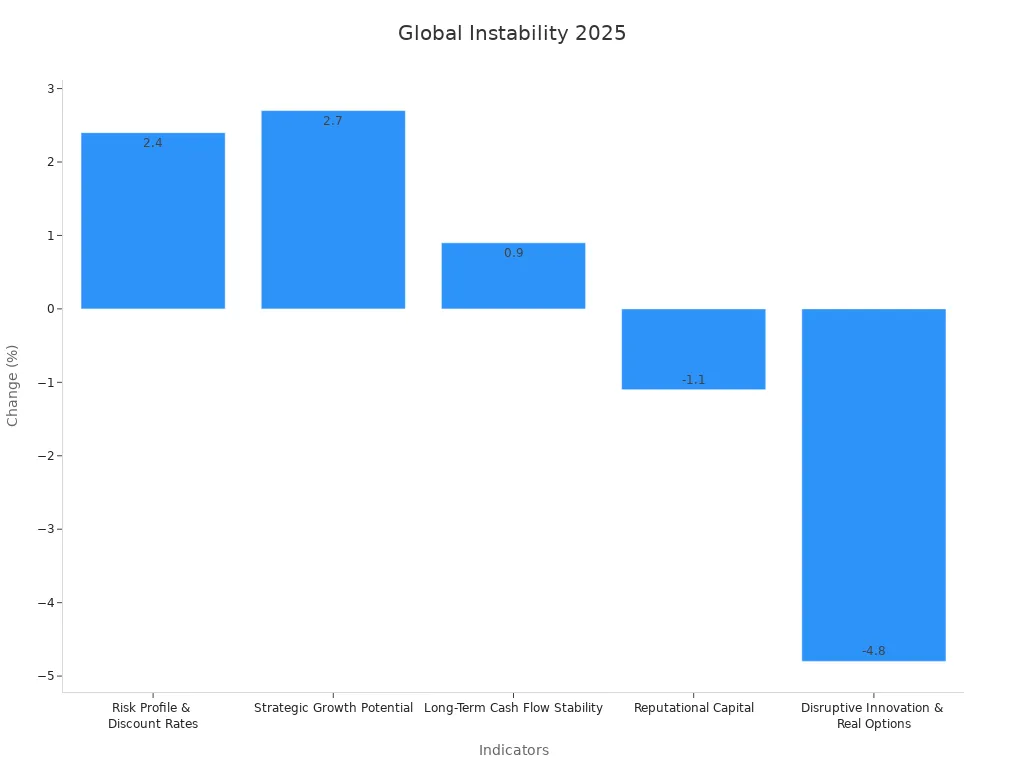
The following table highlights how global instability changed investor sentiment in 2025:
| Indicator | Change (%) | Interpretation & Impact on Investor Sentiment |
|---|---|---|
| Risk Profile & Discount Rates | +2.4 | Investors became more concerned about geopolitical risks and focused on risk management. |
| Strategic Growth Potential | +2.7 | Investors rewarded companies with strong growth plans, even during volatility. |
| Long-Term Cash Flow Stability | +0.9 | Confidence grew in companies that showed stable revenue and margins. |
| Reputational Capital | -1.1 | Investors paid more attention to short-term risks and operational performance. |
| Disruptive Innovation & Real Options | -4.8 | Investors wanted clear progress and less risk in innovation projects. |
Recession Fears
In 2025, fears of a recession grew stronger. Many investors and economists watched for signs of trouble. Surveys showed that the odds of a recession jumped from 26% in late 2024 to 36% by March 2026. This was the largest increase since 2022. More than half of economists expected inflation to stay above the Federal Reserve’s 2% target through 2027. Job growth forecasts dropped from 120,000 jobs per month to only 92,000.
Consumer confidence reached its lowest point in 12 years. More Americans expected unemployment to rise than at any time since 2009. Manufacturing activity fell to its lowest level since April 2023, and the service sector also expected a decline. The S&P 500 dropped over 10% from its record high, moving close to bear market territory. Bond yields on 10-year U.S. Treasuries rose sharply after tariff announcements, showing that markets felt uncertain.
| Forecast / Survey Metric | Value / Change | Timeframe / Source |
|---|---|---|
| Recession Odds | Increased to 36% from 26% in late 2024, largest jump since 2022 | March 2026 forecast, Bankrate Economic Indicator Poll |
| Inflation Expectations | 55% of economists expect inflation above Fed’s 2% target through 2027, up from 15% previously | 2025 survey, Bankrate |
| Job Growth Forecast | Downgraded to 92,000 jobs/month from 120,000 jobs/month | 2025 forecast, Bankrate |
| Policy Uncertainty Mentions | Tariffs mentioned 32 times; policy 19 times; uncertainty 15 times | Economists’ qualitative responses, 2025 |
These numbers show that recession fears shaped investor behavior and business decisions. Many companies focused on stable cash flows and risk management to survive the uncertain economic climate.
High Valuations and Market Sentiment
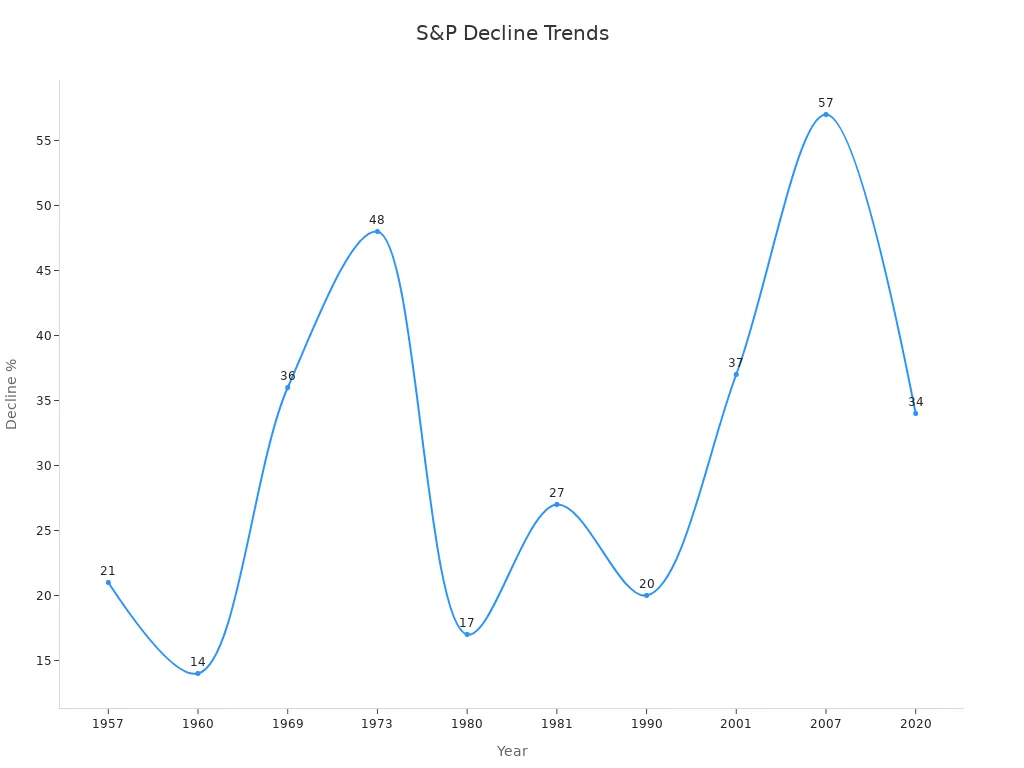
Overpriced Stocks
Stock prices in early 2025 reached levels far above historical averages. Many analysts pointed to the Buffett Indicator, which compares the total value of the U.S. stock market to the size of the economy. By March 31, 2025, the market capitalization stood at $59.10 trillion USD, while the annualized GDP was $29.51 trillion USD. This put the Buffett Indicator at 200%, about 57% higher than the long-term trend. The table below shows these numbers:
| Metric | Value | Interpretation |
|---|---|---|
| Total US Stock Market | $59.10 trillion | Market capitalization as of March 31, 2025 |
| Annualized GDP | $29.51 trillion | US economy size |
| Buffett Indicator Ratio | 200% | Market value is 200% of GDP |
| Deviation from Trend | +1.8 std dev | 57% above historical average |
Other valuation measures, such as price-to-earnings and price-to-book ratios, also signaled overvaluation. The S&P 500 traded at more than 24 times next year’s expected earnings, well above its 5- and 10-year averages. Academic research shows that overpriced stocks can increase the risk of a stock market crash. Overvaluation often leads to hidden financial risks, especially when companies use aggressive accounting or have concentrated ownership. These risks can distort market signals and make the economic system more fragile.
- Nearly all valuation indicators pointed to high prices.
- Strong earnings growth and return on equity supported some of the rise, but did not remove the risk of overpricing.
- High valuations made investors nervous about entering the market at such expensive levels.
2025 Market Crash: Investor Reactions
When the 2025 market crash began, stock prices fell quickly across the world. On April 2, S&P 500 futures dropped 3.9%, and Nasdaq-100 futures fell 4.7%. The next day, the Nasdaq Composite lost 1,600 points, its worst sell-off since the COVID-19 pandemic. The S&P 500 dropped 6.65%, nearly triggering a trading halt. Other markets, such as the Nikkei 225 in Japan and the KOSPI in Korea, also saw sharp declines.
| Date | Market/Index | Percentage Drop | Key Event/Note |
|---|---|---|---|
| April 2 | S&P 500 Futures | -3.9% | Immediate tumble after announcement |
| April 3 | Nasdaq Composite | -1,600 points | Worst sell-off since COVID-19 pandemic start |
| April 4 | S&P 500 | -5.97% | Second consecutive day of losses |
| April 3-7 | Nikkei 225 (Japan) | -7% | Largest loss since March 2020, triggered curb |
Investor confidence dropped sharply. The AAII Sentiment Survey showed bullish sentiment at only 25.4%, much lower than the historical average of 37.5%. Bearish sentiment stayed above 50% for eight weeks, showing deep caution and fear. The percentage of S&P 500 stocks above their 200-day moving average fell to 28%, reflecting weak market breadth. Volatility spiked, but then fell quickly as markets began to recover. A new investor sentiment index, designed to track irrational behavior, proved better at predicting stock returns during this period. This tool helped experts understand how fear and panic contributed to the rapid decline and later recovery in the market.
Economic Fallout and Strategies
Immediate Effects
The 2025 market crash caused rapid changes across the economy. Households continued to spend, helped by steady wage and job growth, even as inflation stayed high. Many banks relaxed lending standards, which made it easier for families to borrow and spend. Businesses faced higher costs from tariffs and supply chain disruptions. Some companies delayed investments because of economic uncertainty. The government started to cut spending to improve efficiency. The stock market lost over $6 trillion USD in just two days after new tariffs were announced. This sharp drop in market losses affected retirement accounts and business confidence.
| Sector | Immediate Impact |
|---|---|
| Households | Continued spending, higher borrowing |
| Businesses | Increased costs, delayed investments |
| Government | Reduced spending, new efficiency measures |
| Stock Market | $6 trillion USD loss in two days |
Long-Term Impact
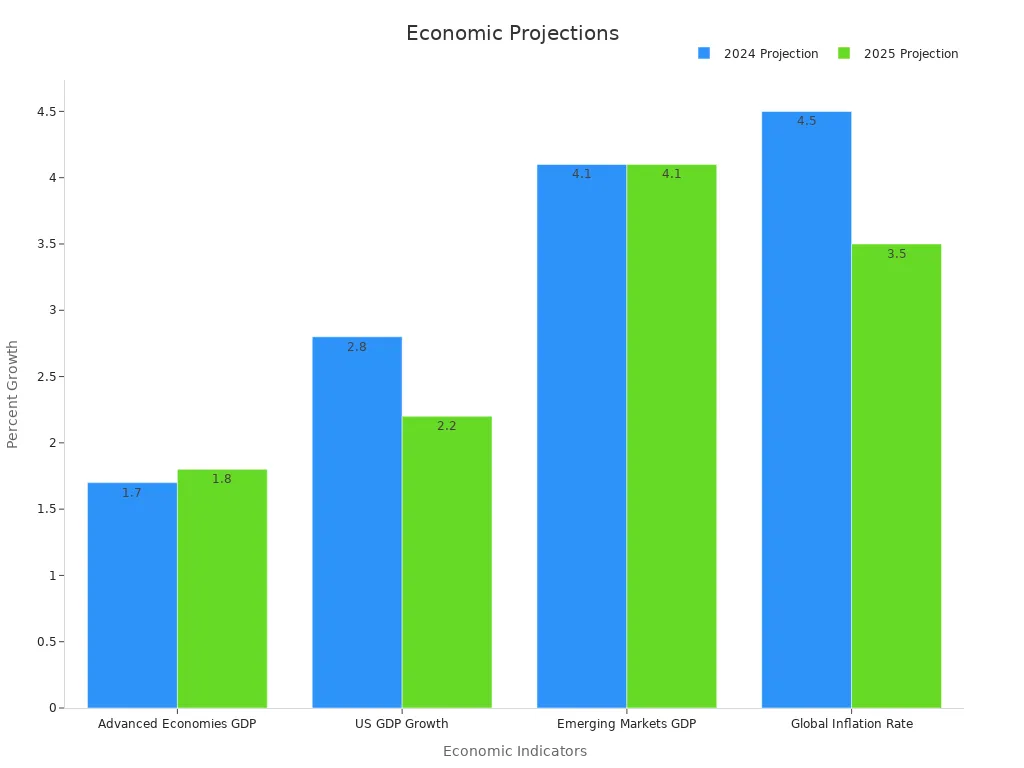
The long-term effects of the crash will shape economic growth for years. Global GDP growth is expected to remain stable at about 3.1% in 2025, but regions will recover at different speeds. The United States will see slower growth, dropping from 2.8% in 2024 to 2.2% in 2025. Europe and Japan will show modest improvement, while China’s growth will slow to 4.5%. Inflation will fall but stay above pre-pandemic levels, keeping pressure on families and businesses. Monetary policies will differ by region, adding to economic uncertainty. Market losses may lead to slower investment and higher risks of recession in some countries.
| Economic Indicator | 2024 Projection | 2025 Projection | Context/Comparison |
|---|---|---|---|
| Global Real GDP Growth | ~3.1% | ~3.1% | Stable, but uneven across regions |
| US GDP Growth | 2.8% | 2.2% | Slower, but still positive |
| Euro Area GDP Growth | <1% | ~1.3% | Modest recovery |
| China GDP Growth | 5.2% | 4.5% | Slowing due to structural challenges |
| Global Inflation Rate | 4.5% | 3.5% | Declining, but above 2019 levels |
Protecting Your Portfolio
Investors can take steps to manage risk during periods of economic uncertainty and market losses. Studies show that keeping at least 50% of a portfolio in stocks helps maintain growth and supports withdrawal rates of 7-8% over 15-20 years, with about a 75% success rate. Higher stock allocations often lead to better results, even during downturns. Flexible withdrawal strategies, such as reducing spending when markets fall, can help portfolios last longer.
Tip: Holding 3-6 months of expenses in cash, or up to 2 years for retirees, can prevent the need to sell investments during a downturn.
Here are some best practices for protecting investments:
- Maintain a long-term view. Stocks have not lost value over any 15-year period in the last 50 years.
- Adjust asset allocation based on age and risk tolerance.
- Continue saving and investing during downturns if possible.
- Build a cash reserve for emergencies.
- Stay flexible and consider delaying retirement or working part-time if needed.
The market crash 2025 resulted from aggressive tariff hikes, persistent inflation, Federal Reserve rate increases, high stock valuations, and global tensions. Machine learning models show that crashes often involve many factors, not just one. Investors and businesses saw that the market crash 2025 had a strong impact on economic growth. Understanding these patterns helps people prepare for future risks. Staying informed and watching for changes in market signals can help protect investments.
FAQ
What triggered the 2025 market crash?
Aggressive tariff hikes, persistent inflation, Federal Reserve rate increases, high stock valuations, and global geopolitical tensions triggered the 2025 market crash. These factors combined to create uncertainty and led to sharp declines in major stock indexes.
How did tariffs affect businesses in 2025?
Tariffs raised import costs for many companies. Businesses paid more for materials and products. Many firms delayed investments or cut spending. Some companies reported lower profits because of higher expenses.
Did inflation stay high after the crash?
Inflation remained above pre-pandemic levels after the crash. Prices for goods and services stayed elevated. Many families and businesses continued to feel pressure from higher costs throughout 2025.
How did investors react during the crash?
Investors sold stocks quickly when the market dropped. Many shifted money into safer assets like U.S. Treasury bonds. Investor confidence fell, and surveys showed a rise in bearish sentiment.
What steps can investors take to protect their portfolios?
Investors can keep a diversified portfolio, hold some cash for emergencies, and avoid panic selling. Maintaining a long-term view and adjusting asset allocation based on age and risk tolerance can help manage risk during market downturns.
The 2025 market crash, driven by aggressive tariff hikes, persistent inflation, Federal Reserve rate policies, high stock valuations, and global geopolitical tensions, underscores the need for strategic investing in a volatile environment. Coordinating trades across global markets to mitigate risks is challenging, with high cross-border fees and complex overseas account requirements creating barriers. BiyaPay simplifies this by enabling you to invest in both U.S. and Hong Kong stock markets directly on its platform without needing an overseas account. With real-time, fee-free conversion of over 200 digital currencies, including USDT, into 30+ fiat currencies like USD and HKD, and cross-border remittance fees as low as 0.5%. A 1-minute BiyaPay account registration ensures rapid, secure entry, empowering you to navigate tariff-driven volatility, protect your investments, and seize opportunities in 2025’s turbulent markets.
Safeguard your portfolio in 2025’s volatile markets! Join BiyaPay.
*This article is provided for general information purposes and does not constitute legal, tax or other professional advice from BiyaPay or its subsidiaries and its affiliates, and it is not intended as a substitute for obtaining advice from a financial advisor or any other professional.
We make no representations, warranties or warranties, express or implied, as to the accuracy, completeness or timeliness of the contents of this publication.


Contact Us
Company and Team
BiyaPay Products
Customer Services


is a broker-dealer registered with the U.S. Securities and Exchange Commission (SEC) (No.: 802-127417), member of the Financial Industry Regulatory Authority (FINRA) (CRD: 325027), member of the Securities Investor Protection Corporation (SIPC), and regulated by FINRA and SEC.
registered with the US Financial Crimes Enforcement Network (FinCEN), as a Money Services Business (MSB), registration number: 31000218637349, and regulated by FinCEN.
registered as Financial Service Provider (FSP number: FSP1007221) in New Zealand, and is a member of the Financial Dispute Resolution Scheme, a New Zealand independent dispute resolution service provider.