- EasyCard
- Trade
- Help
- Announcement
- Academy
- SWIFT Code
- Iban Number
- Referral
- Customer Service
- Blog
- Creator
How Economic Events Are Shaping Stock Rises in 2025


Image Source: pexels
Major economic events continue to shape the stock market today, driving both optimism and caution among investors. Recent data shows the U.S. economy maintains steady growth, with real GDP rising near 3%, while core inflation remains above 2.5%. The Federal Reserve’s policy rate reduction to 4% and projected S&P 500 earnings growth reflect strong consumer confidence. However, tariffs and policy uncertainty add volatility, with higher trade barriers threatening market stability and investor confidence.
Understanding these economic factors helps investors navigate stock rise opportunities and manage risks in a changing market landscape.
| Economic Indicator | Value / Forecast | Impact on Stock Market 2025 |
|---|---|---|
| U.S. Real GDP Growth Rate | Around 3%, cooling to ~2% under policy risks | Indicates economic growth moderation affecting market optimism |
| Core Inflation | Expected to remain above 2.5% | Sustained inflation influences Fed policy and valuations |
| Fed Policy Rate | Anticipated reduction to 4% | Monetary easing supports equity valuations |
| Annualized Bond Returns | 4.3%–5.3% | Attractive fixed income returns affect asset allocation |
| S&P 500 Price Target (J.P. Morgan) | 6,500 with EPS of $270 for 2025 | Reflects market expectations of earnings growth and valuation |
Key Takeaways
- Steady economic growth and controlled inflation in 2025 support rising stock prices and investor confidence.
- Lower interest rates help companies borrow cheaply, boosting profits and encouraging stock market gains.
- Tariffs and trade barriers create market volatility, so diversifying investments helps manage risks.
- Technology and innovation drive new opportunities, but investors should watch for fast changes and adjust accordingly.
- Geopolitical events and policy uncertainty can cause sudden market shifts; staying informed and flexible protects investments.
Stock Market Outlook
2025 Trends
The stock market today faces a complex environment in 2025. Investors see both challenges and opportunities. The S&P 500 posted its worst quarterly performance since 2022, dropping 4.3% in Q1. Despite this setback, forecasts show an 11.5% earnings per share growth for the year. Eight out of eleven large-cap sectors remain positive year-to-date, but major indices corrected at least 10% from recent highs. Small-cap stocks declined more than large-caps, with a 17.1% drop from their 52-week highs.
Note: The Russell 1000 Growth Index fell by 10%, while the Value Index gained 2.1%. This shift signals a rotation from growth to value, a trend not seen in the previous two years.
| Indicator/Metric | Data/Observation |
|---|---|
| S&P 500 Quarterly Performance | -4.3% in Q1 2025 |
| S&P 500 EPS Growth Forecast | 11.5% for 2025 |
| Large-Cap Sector Performance | 8 of 11 sectors positive YTD |
| Sector Corrections | Large-cap: -9.7%; Small-cap: -17.1% from highs |
| Credit and Interest Rate Conditions | No signs of contraction |
| Fed Policy | Lower real interest rates projected |
| Equity Market Corrections | Major indices corrected 10%+; below 200-day moving average |
| GDP Projections | 2% real GDP growth consensus; -2.8% Q1 contraction (Atlanta Fed) |
Key Drivers
Several factors shape the stock market outlook for 2025. Earnings growth expectations stand at 13-15% for 2025-2026. The S&P 500 forward P/E ratio reached 21.5 at the end of 2024, reflecting high valuations. Investors expect a 10% total return for the S&P 500, with 8-10% from earnings growth and 1-2% from dividends. However, valuation compression could subtract 5% from returns.
Rising stock prices depend on consumer confidence and stable economic data. Productivity gains from technology and deregulation add about 1% to growth. Inflation expectations remain near 2.25%, and the 10-year Treasury yield rose from 3.6% to 4.8%.
A style rotation is underway. Mega-cap stocks like Amazon, Alphabet, and Meta shifted from pure growth to a blend of growth and value. Their growth forecasts declined, but book-to-price ratios increased, showing maturing business models.
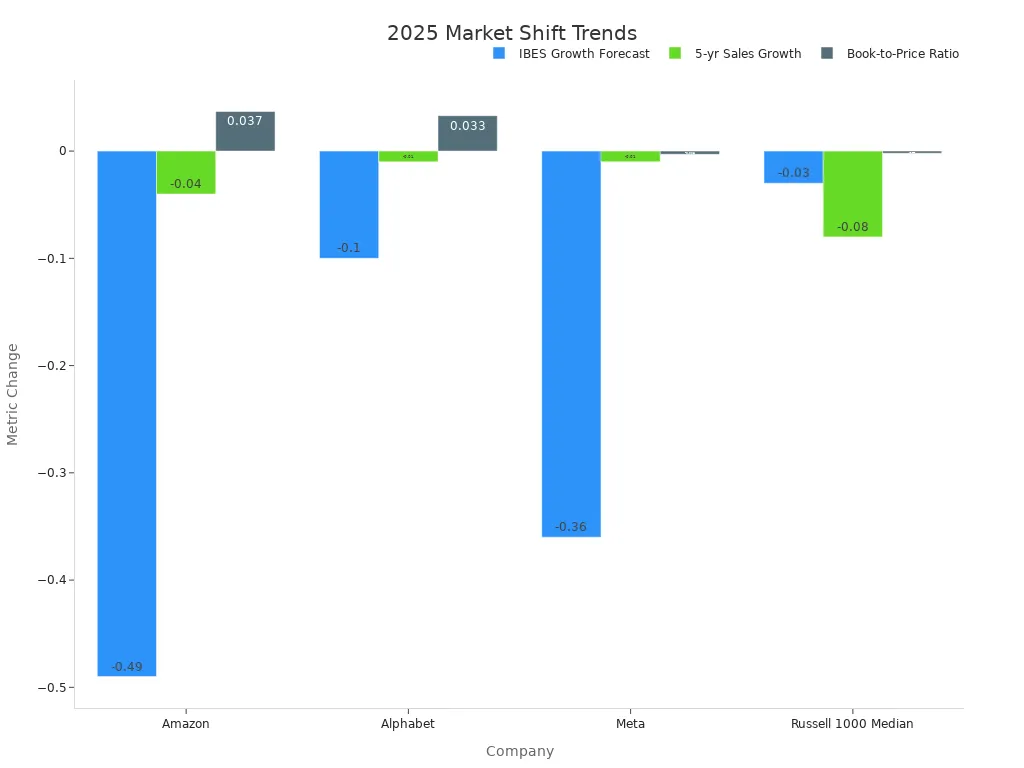
Investors watch market reactions closely. Bull markets in the past relied on strong confidence and steady economic growth. In 2025, the market rewards value and resilience over pure growth. This bull run highlights the importance of understanding both growth and value in stocks. The stock market today reflects these shifts, and investors must adapt to changing conditions in global markets.
Interest Rates
Policy Impact
Interest rates play a central role in shaping the direction of stocks in 2025. The Federal Reserve’s decisions on monetary policy influence borrowing costs, consumer spending, and business investment. When the Fed lowers rates, companies can borrow at lower costs, which often leads to higher profits and rising stock prices. In 2025, the policy rate reduction to 4% has supported equity valuations and encouraged investors to seek returns in riskier assets.
Quantitative easing (QE) programs have also affected interest rate trends. By purchasing Treasury securities, the Federal Reserve increases demand, which keeps yields low. When the Fed tapers these purchases, yields tend to rise. For example, the Federal Open Market Committee (FOMC) announced a plan to reduce asset purchases, signaling a shift toward tighter policy. This move put upward pressure on interest rates and influenced market expectations.
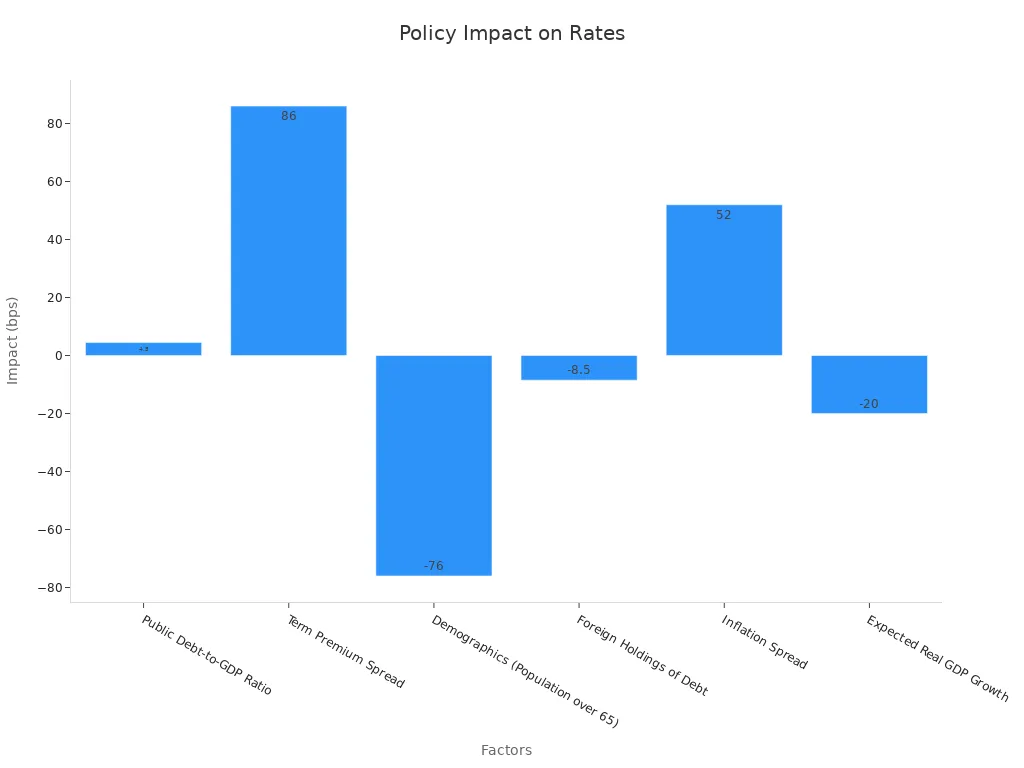
Several factors impact interest rates over time. The public debt-to-GDP ratio, term premium spread, demographics, and inflation all play a part. For instance, a 1 percentage point increase in the debt ratio can raise rates by about 4 to 5 basis points. Demographic changes, such as a growing population over age 65, tend to lower rates. Inflation and economic growth expectations also affect rate movements, with higher inflation pushing rates up and strong growth sometimes leading to lower rates after a lag.
| Factor / Variable | Impact on Interest Rates (bps) | Notes |
|---|---|---|
| Public Debt-to-GDP Ratio | ~4 to 5 bps increase per 1 ppt increase in debt ratio | Effect grows over time, up to ~6 bps after 1 year |
| Term Premium Spread | +86 bps | Large positive impact; effect decreases over time |
| Demographics (Population over 65) | -76 bps | Downward pressure on rates; effect stable over time |
| Foreign Holdings of Debt | -8.5 bps | Downward pressure; effect increases with lag |
| Inflation Spread | +52 bps (after 1 year lag) | Becomes significant with delay |
| Expected Real GDP Growth | -20 bps (significant at 3-4 quarter lags) | Growth expectations reduce rates at longer lags |
The relationship between interest rates and stocks is often inverse. Higher rates increase borrowing costs for companies, which can reduce profits and lower stock valuations. Lower rates encourage borrowing and economic growth, boosting stock prices. When rates are low, bonds become less attractive, so investors move money into stocks. This dynamic has shaped market trends in 2025, as investors respond to both policy changes and economic signals.
Historical data supports these trends. For example, during the 2015-2018 rate hikes, the S&P 500 still averaged 8.6% returns. In the 1980s and 1990s, even with high interest rates, the S&P 500 delivered strong annual returns. When the Fed cuts rates, stocks often rise in the following year, especially if the market is near all-time highs.
| Interest Rate Cycle | Stock Market Performance |
|---|---|
| 2015-2018 Rate Hikes (Fed raised rates by 225 basis points) | S&P 500 averaged 8.6% returns despite rising rates |
| 1980s High Interest Rates | S&P 500 averaged over 16% annual returns |
| 1990s High Interest Rates | S&P 500 averaged over 18% annual returns |
| Rate Cut Cycles since 1929 (14 cycles) | 12 cycles saw positive S&P 500 returns in 12 months following first cut |
| Rate Cuts when S&P 500 near all-time highs (12 instances) | Market was higher one year later in all instances |
Note: The 10-year Treasury yield moved between 3.63% and 4.79% from late 2024 to early 2025, shaping investor sentiment and asset allocation.
A quantitative investment model, combining interest rate risk and firm value, shows that investment falls as rates rise. The term structure of rates has nonlinear effects on investment and stock performance. Credit spreads and bond prices also help predict investment trends, highlighting the importance of interest rate risk in understanding stocks.
Sector Impact
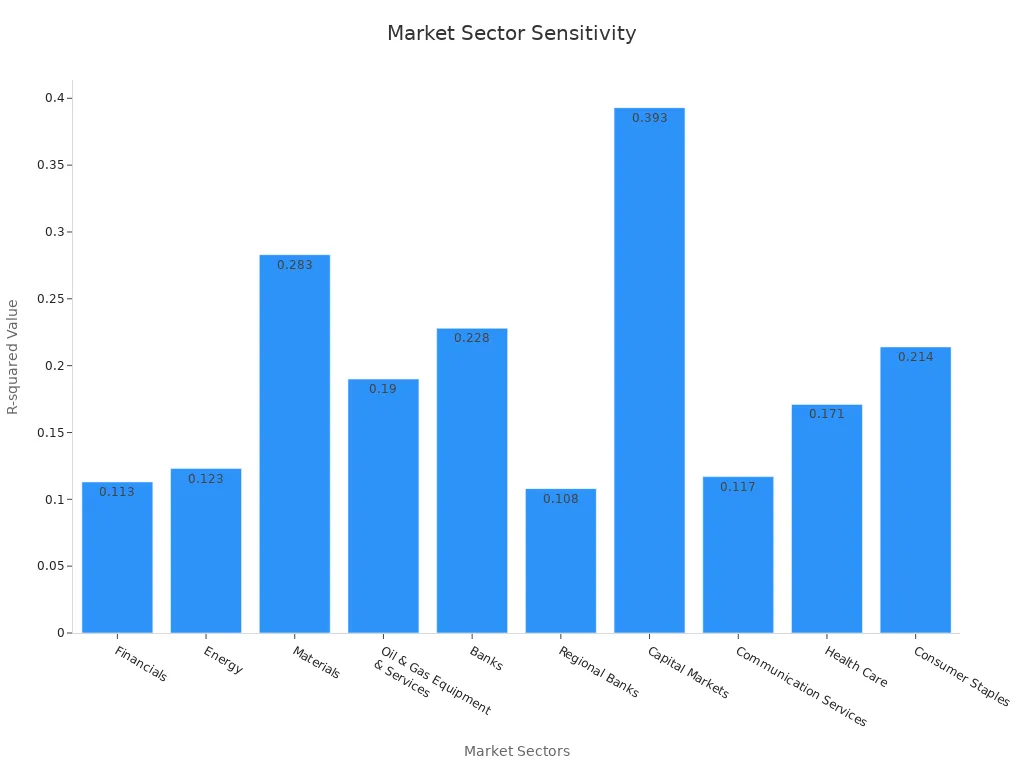
Interest rate changes do not affect all sectors equally. Some sectors benefit from rising rates, while others face challenges. Financials, energy, and materials often perform well when rates rise. Banks and financial firms can earn more from lending at higher rates. Energy and materials benefit from economic growth that often accompanies higher rates.
| Sector | Sensitivity Direction to Rising Rates | Statistical Evidence Summary |
|---|---|---|
| Financials | Positive | Strong positive correlation with rising rates |
| Energy | Positive | Strong performance during rising rates |
| Materials | Positive | Performs well during improving economic growth |
| Technology | Negative | Higher rates weigh on valuations |
| Communication Services | Negative | Negative correlation with rising rates |
| Health Care | Negative | Performs better during falling rates |
| Consumer Staples | Negative | Better performance amid falling rates |
Technology and communication services show negative sensitivity to rising rates. These sectors rely on future growth, so higher borrowing costs and discounted future cash flows can hurt valuations. Health care and consumer staples, considered defensive sectors, tend to perform better when rates fall or remain stable.
Life insurers stand out as a sector that benefits from higher rates. After 2015, increases in interest rates led to higher equity values for life insurers. This happens because their liabilities have longer maturities than their assets, so rising rates improve their financial position.
Small-cap stocks, such as those in the Russell 2000, are more vulnerable to higher rates. These companies depend more on borrowing and face increased costs and volatility when rates rise. In late 2024, interest rate sensitive sectors like utilities and real estate lost ground as Treasury yields rose. However, some recovery occurred in early 2025, especially for real estate investment trusts (REITs), as the outlook for falling interest rates improved.
Tip: Investors can manage risk by diversifying across sectors with different sensitivities to interest rates. A balanced portfolio can help smooth returns during periods of rate changes.
A comparative analysis of recent interest rate changes shows that growth stocks remain central to investment success in 2025. The U.S. economy is strong, with rising corporate profits and share buybacks supporting the market. Interest rate normalization and a stable outlook create a favorable environment for stocks, especially in financials, IT, consumer discretionary, and communication services. While volatility persists, positive growth expectations support staying invested.
Inflation and Economy

Image Source: pexels
Inflation Effects
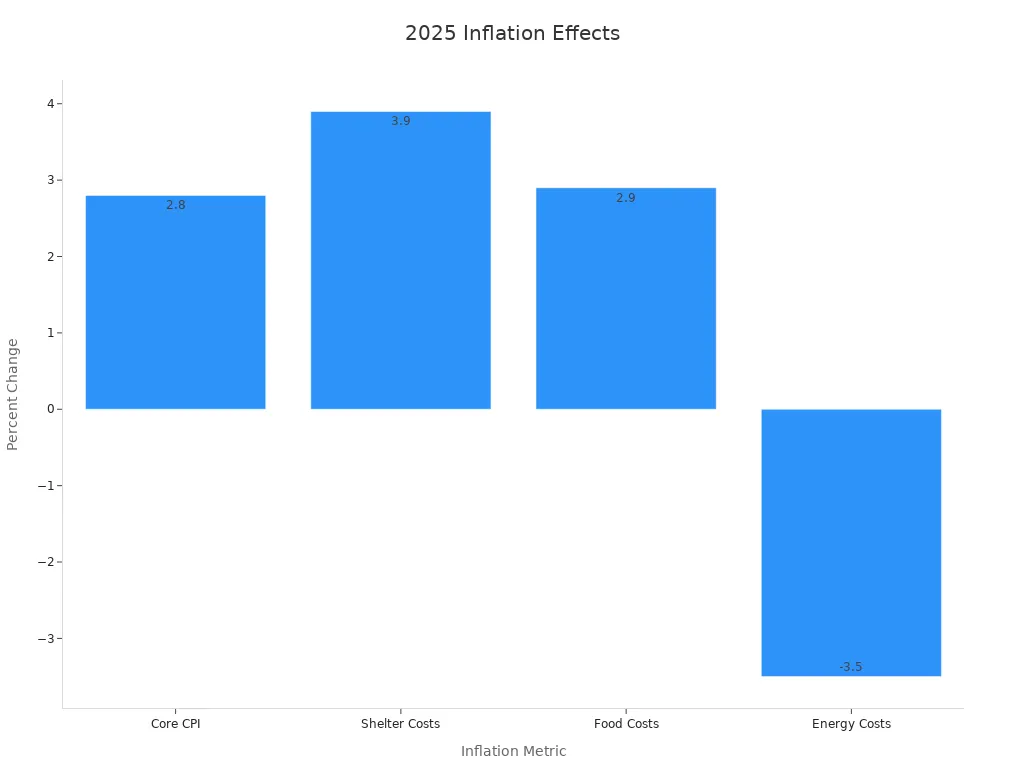
Inflation remains a central concern for investors in 2025. Recent inflation reports show that price increases have moderated, with the Consumer Price Index (CPI) rising 2.4% to 2.5% year-over-year. Core CPI, which excludes food and energy, stands at 2.8%. These numbers fall below most economist forecasts, suggesting a controlled inflation environment. The U.S. economy benefits from this stability, as steady inflation supports both consumer spending and business planning.
| Inflation Metric | Value/Change | Impact on 2025 Stock Market and Economy |
|---|---|---|
| Consumer Price Index (CPI) | 2.4% to 2.5% (year-over-year) | Modest inflation with slight upward pressure; below economist forecasts, indicating controlled inflation environment. |
| Core CPI (ex-food & energy) | 2.8% (year-over-year) | Slightly below expectations; indicates underlying inflation remains stable, supporting steady consumer spending. |
| Shelter Costs | +3.9% (year-over-year) | Largest contributor to inflation; deceleration in housing market may offset tariff-driven price increases. |
| Food Costs | +2.9% (year-over-year) | Moderate increase, contributing to inflation but not sharply impacting consumer spending. |
| Energy Costs | -3.5% (year-over-year) | Decline helps offset inflationary pressures, supporting consumer resilience. |
| Tariff Impact | Estimated initial price spike ~1.4% | Potential to increase costs for businesses; limited pass-through to consumers so far, creating uncertainty in markets. |
| Federal Reserve Policy | Interest rates steady in 2025 | Reflects steady inflation; rate cuts in late 2024 support economic growth, balancing inflation risks and market stability. |
| Consumer Spending | Rising despite inflation fears | Indicates resilience in economy, supporting stock market stability despite inflation concerns. |
Tariffs have played a significant role in shaping inflation trends. The initial spike in consumer prices from new tariffs reached about 1.4%. Many businesses absorbed these costs at first, but some expect to raise prices within three months. This situation creates pressure on profit margins and adds uncertainty to stock valuations. The Federal Reserve has responded by keeping interest rates steady, which helps reduce market volatility.
| Key Forecasts and Effects | Details | Stock Market Implications |
|---|---|---|
| Initial Tariff Price Spike | ~1.4% increase in consumer prices expected in short term | Could cause short-term inflationary pressure, increasing market uncertainty. |
| Tariff Policy Uncertainty | Tariff rates and scope remain fluid; pauses and reversals possible | Creates volatility and risk for investors; diversification advised. |
| Business Response | Many businesses may absorb costs initially; some expect to raise prices within 3 months | Profit margin pressures could affect corporate earnings, influencing stock valuations. |
| Economic Slowdown Risk | Potential slowdown and rising unemployment if tariffs persist | Could lead to Fed rate cuts, which might support stock prices despite economic risks. |
| Federal Reserve Policy | Fed likely to hold rates steady in near term, monitoring tariff impact | Stability in interest rates reduces market volatility, but uncertainty remains due to tariffs. |
Headline inflation in May 2025 increased only 0.1% month-over-month. Core inflation also rose 0.1%. These figures signal that inflation remains under control, which supports stock market stability. Services inflation, especially in housing, has moderated. This trend helps offset higher prices from tariffs and goods. The U.S. economy continues to show resilience, with consumer spending rising even as inflation persists.
Statistical models, such as the equity stock duration model based on the Dividend Discount Model (DDM), help explain how inflation affects stock prices. These models show that changes in inflation and real interest rates can directly impact stock valuations. For example, higher inflation can reduce the present value of future dividends, leading to lower stock prices. However, if inflation remains stable and predictable, markets can adjust, and investor confidence improves.
| Aspect | Description |
|---|---|
| Model | Equity stock duration model based on Dividend Discount Model (DDM) |
| Key Equation | dpp = -DDDM(1 - γ + ∂h/∂r) dr - DDDM(1 - λ + ∂h/∂I) dI |
| Variables | dpp: % change in stock price due to real interest rate and inflationDDDM: Duration of Dividend Growth Modelγ: Growth rate sensitivity to real interest rate∂h/∂r: Change in equity market risk premium due to inflation rateλ: Growth rate sensitivity to inflation flow-through parameter∂h/∂I: Change in equity market risk premium due to inflation ratedr: Change in real interest ratedI: Change in interest rate due to inflation change |
| Data | Quarterly stock prices of non-financial firms in DJIA30 and NASDAQ100 (1999-2016), US inflation rate, T-bill interest rate |
| Regression Model | y_it = α_i + Σ β_i x_it + Σ β_i size_it + Σ β_i z_itwhere y_it = stock prices, x_it = changes due to inflation and real interest rate, size_it = firm size dummies, z_it = inflation and interest rate level dummies |
| Statistical Tests | Panel unit root test (Levin et al., 2002) for stationarityGranger causality tests for directional relationshipsLinearity vs nonlinearity tests |
| Theoretical Context | Incorporates Modigliani-Cohn hypothesis and Fama’s work to interpret model assumptions and empirical findings |
Note: Investors should monitor inflation reports closely. Even small changes in inflation can shift market sentiment and affect portfolio performance.
Economic Growth
Economic growth remains a key driver of stock market performance in 2025. The U.S. economy has shown steady expansion, with real GDP growth near 3%. This growth supports rising corporate earnings and helps maintain investor confidence. Historical data reveal that after a major market decline, the third year often brings positive but more moderate returns. For example, the late 1990s saw strong gains, with the S&P 500 posting increases of 33%, 29%, and 21% from 1997 to 1999.
Several factors contribute to the positive outlook for economic growth. The widespread adoption of artificial intelligence (AI) has sparked a productivity boom. Companies across many industries use AI to improve efficiency and boost profit margins. This trend supports higher stock valuations and attracts new investment. Mega-cap technology stocks now trade at valuation multiples about 50% lower than during the dotcom bubble, suggesting room for further growth.
Investor sentiment has shifted through different phases. Early in the bull market, pessimism dominated. As the economy improved, skepticism gave way to optimism. This transition often aligns with stronger market performance. The Federal Reserve’s approach to interest rates also shapes the outlook. The pace of rate cuts can extend the bull market or, if too rapid, trigger excessive risk-taking.
- Historical returns after large market declines tend to be positive, though often more muted than in recovery years.
- AI-driven productivity gains support economic growth and corporate profitability.
- Valuation multiples for large tech stocks remain below historical peaks, allowing for potential expansion.
- Investor sentiment has moved from skepticism to optimism, which usually supports higher stock prices.
- Federal Reserve policy decisions on rates will influence the duration and strength of the current bull market.
Tip: Investors should watch for signs of sustained economic growth, such as rising productivity and strong earnings reports. These indicators often signal continued stock market strength.
The U.S. economy continues to show resilience, even as inflation and policy uncertainty persist. Consumer confidence remains high, supporting steady spending and investment. As the economy grows, opportunities for investors expand, especially in sectors benefiting from new technology and stable inflation.
Tariffs and Trade
Trade Barriers
New tariffs and trade policy changes in 2025 have reshaped the global economic landscape. The U.S. introduced a tariff framework that is projected to reduce GDP growth by about 1% in 2025 and 1.4% in 2026. Core PCE inflation is expected to rise by 1.4 to 2.2 percentage points, depending on the scope and duration of these tariffs. Stock markets responded sharply to these announcements. The S&P 500 ETF dropped nearly 4%, while the Nasdaq-tracking QQQ fell over 4.5%. The Dow Jones Industrial Average lost more than 1,400 points, and the Nasdaq Composite declined almost 6%. These market reactions highlight the immediate impact of trade barriers on investor sentiment and equity valuations.
Statistical analyses show that reducing trade barriers can improve efficiency and welfare by allowing better resource allocation. However, dynamic models suggest that sudden changes in trade policy can trigger price fluctuations and instability. Time-varying trade barriers, often influenced by political factors, can increase volatility in commodity prices and raise the risk of economic crises. An optimal level of trade barriers may help balance efficiency gains with the costs of instability.
Market Volatility
The escalation of tariffs in April 2025 led to a significant market crash and ongoing volatility. The S&P 500 declined over 10% within two days, and economists lowered U.S. GDP growth forecasts for 2025 to 0%. Core inflation forecasts rose to 3.8%. These shifts have created persistent volatility, making diversification and nimble portfolio management essential for investors.
Sectors most exposed to trade developments include technology, industrials, and consumer discretionary, as 41% of corporate revenue comes from exports. When tariffs cause earnings to fall, market valuations adjust quickly. For example, if earnings drop from $285 to $260 per share, an index valued at 6000 would reprice to 5460. High forward earnings multiples, now at 21.91x, signal vulnerability to earnings disappointments. Investors should monitor inflation trends and diversify across sectors to manage risk during periods of heightened market volatility.
Tip: Staying informed about trade policy changes and maintaining a flexible investment strategy can help investors navigate uncertain markets.
Technology Trends
Innovation Impact
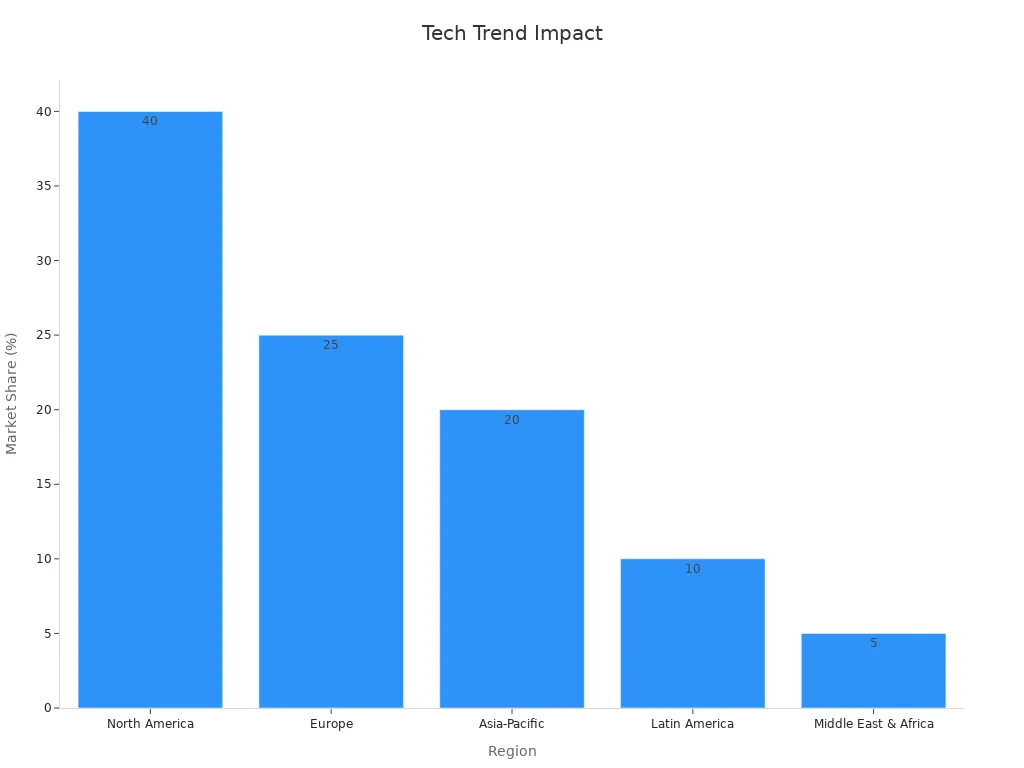
Technology continues to shape the financial markets in 2025. Artificial intelligence, machine learning, and data analytics drive new ways to create value for investors. Companies use these tools to improve predictive modeling, manage risk, and increase trading efficiency. The rapid adoption of these technologies has led to strong growth in the quantitative investment market. The projected compound annual growth rate (CAGR) from 2025 to 2032 stands at 13.9%. North America leads with a 40% market share, followed by Europe and Asia-Pacific.
| Metric/Aspect | Data/Value |
|---|---|
| Projected CAGR (2025-2032) | 13.9% |
| North America Market Share | 40% |
| Europe Market Share | 25% |
| Asia-Pacific Market Share | 20% |
| Latin America Market Share | 10% |
| Middle East & Africa | 5% |
| Major Firm Revenue Example | Citadel: > $4 billion |
| Key Technology Drivers | AI, machine learning, data analytics |
| Market Segments | Algorithmic trading (fastest growing) |
Despite the excitement around innovation, statistical analysis shows that early-stage venture capital returns do not correlate with public stock market rises. AngelList data finds almost zero correlation between innovation indices and stock performance, even when measured over several months. Venture investments often depend on a few standout companies and have long time horizons. This means that while innovation creates long-term value, it does not always move in step with public stocks in the short term.
A study of China’s Stock Connect program shows that stock market liberalization can boost corporate innovation. Firms eligible for foreign investment produced more and higher-quality patents. This improvement comes from better corporate governance and easier access to funding. However, the effect reflects how stock market changes can support innovation, not a direct link between innovation indices and stock returns.
Tech Stocks
Tech stocks remain a major force in the market. Companies that use advanced technology often deliver strong earnings and attract investor attention. Algorithmic trading and data-driven strategies help these firms find value in fast-moving markets. The largest technology firms, such as Citadel, report revenues above $4 billion USD, showing the scale of opportunity.
Investors look for value in both established tech giants and smaller firms with new ideas. The rapid pace of innovation means that today’s leaders must keep evolving to stay ahead. While technology can create new value, it also brings risks. Fast changes in technology can lead to sharp swings in stock prices. Investors who understand these trends can find value and manage risk more effectively.
Note: Technology trends will continue to shape the future of stocks. Investors should watch for new developments and adjust their strategies to capture value in this dynamic sector.
Geopolitical Risks
Global Events
Geopolitical risks have become a major factor for investors in 2025. Events such as wars, political tensions, and policy changes can cause sudden changes in the market. JPMorgan’s research shows that global large-cap equity markets often recover from geopolitical shocks, but local markets can suffer lasting damage. For example, the Russo–Ukrainian War led to a sharp rise in energy costs across Europe. Germany’s manufacturing sector lost its edge, and German small-cap companies entered a multi-year earnings recession. This shows that while the global market may stay stable, local or sector-specific stocks can face serious challenges.
MSCI data from 1995 to 2024 reveals that months with high geopolitical risk see lower average global equity returns and higher volatility. Sectors like energy, materials, and consumer services are most sensitive to these risks. Health care and utilities tend to be less affected. Quantitative models, such as TVP-VAR, help track how global events like the Russia-Ukraine conflict or monetary policy shifts impact market volatility and connectedness. During periods of quantitative tightening, stock market returns often transmit more volatility, while exchange rates become more sensitive to shocks.
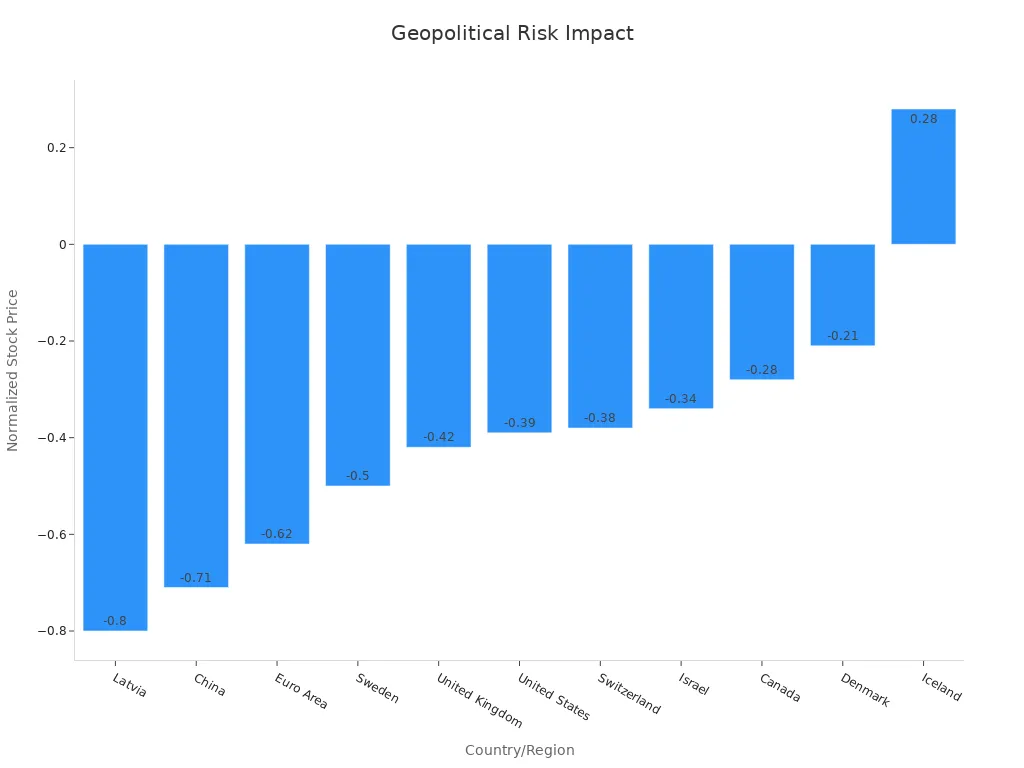
The following table highlights how different countries’ stock prices respond to a one standard deviation increase in global geopolitical risk over one year:
| Country/Region | Impact on Normalized Stock Prices (1 Year after 1 SD Shock) |
|---|---|
| Latvia | -0.80 |
| China | -0.71 |
| Euro Area | -0.62 |
| Sweden | -0.50 |
| United Kingdom | -0.42 |
| United States | -0.39 |
| Switzerland | -0.38 |
| Israel | -0.34 |
| Canada | -0.28 |
| Denmark | -0.21 |
| Iceland | +0.28 (hedge against geopolitical risk) |
Sensitive Sectors
Some sectors feel the effects of geopolitical risks more than others. Energy stands out as highly vulnerable. Conflicts in energy-rich regions, such as the Russia-Ukraine war, often disrupt supply and cause price swings. Trade-related sectors also face challenges when tariffs rise or supply chains shift due to political tensions. Financial services must deal with new regulations and compliance issues, especially as countries adopt different rules for technology and artificial intelligence.
The Global Risks Report 2025 ranks state-based armed conflict as the top geopolitical threat. This risk affects sectors tied to security, technology, and economic stability. Cyber warfare and espionage also threaten technology companies. Geoeconomic confrontation has become a growing concern for economic sectors. CEOs now list higher energy prices and trade wars as leading risks for the market in 2025.
| Sector | Geopolitical Sensitivities and Impacts |
|---|---|
| Consumer and Health | Impacted by government policies on climate, demographics, digital transformation, and taxation changes affecting growth. |
| Financial Services | Risks from geopolitical rivalries, fragmented regulations, and compliance challenges, especially around AI. |
| Government and Infrastructure | Taxation issues influencing capital flow; challenges in funding decarbonization and sustainable care initiatives. |
| Industrials and Energy | Geo-energy dynamics and climate policies reshape market demands and business models. |
| Private Equity | Exposure at portfolio level; demographic divides affect fundraising and investment opportunities. |
| Technology, Media & Entertainment and Telecommunications | Digital sovereignty policies impose new regulations and investment opportunities; alignment with geopolitical standards needed. |
Investors should monitor global events and sector trends closely. Staying informed helps manage risk and spot new opportunities in a changing market.
Risks and Uncertainties
Policy Uncertainty
Policy uncertainty remains a major challenge for financial markets in 2025. Changes in government spending, tax rates, or regulations can shift the direction of the market quickly. When policy uncertainty rises, employment growth in industries that rely on federal demand slows by about 0.4 percentage points. This slowdown shows how sensitive the labor market is to unclear policies. Financial market volatility, measured by indices like the VIX, increases when economic policy uncertainty grows. This pattern appears in the United States, Japan, and other G7 countries. Higher uncertainty leads to more volatile stock prices, lower returns, and reduced investment in sectors that depend on stable policies.
Empirical models use historical data to estimate how economic variables respond to policy changes. These models help policymakers understand the likely effects of new policies, but they also show that results can vary widely. For example, different models may predict different outcomes for inflation or employment after a policy shift. The table below compares two common modeling approaches:
| Criteria | Econometric Models | Statistical Models |
|---|---|---|
| Data Requirement | Requires extensive, high-quality economic data | Relies primarily on historical data patterns |
| Complexity | High complexity due to integration of economic theory | Lower complexity, focused on data trends |
| Adaptability | Less adaptive to sudden regime or structural changes | More flexible and adaptive but may miss structural breaks |
External Shocks
External shocks can disrupt the market and slow economic growth. These shocks include natural disasters, health crises, and social unrest. In 2025, supply-side shocks such as food and oil price spikes and supply chain disruptions have played a major role in driving inflation. Quantitative studies show that these shocks have a lasting effect on consumer prices and the GDP deflator. The market also reacts to international trade changes and policy shifts, which can move capital flows and affect domestic stability.
Digital transformation, climate change, and geopolitical realignments add new layers of risk. These factors influence inflation and capital flows, shaping the market in ways that are hard to predict. Investors can manage uncertainty by diversifying their portfolios, staying informed about policy changes, and using risk management tools. Regularly reviewing asset allocation and setting clear investment goals help reduce the impact of sudden shocks.
Tip: Investors should monitor policy announcements and global events closely. Quick action and a flexible strategy can help protect portfolios from unexpected risks.
Economy and Stock Rise

Image Source: pexels
GDP and Earnings
The relationship between economic growth and stock rise often appears strong, but recent data shows a more complex picture. Over the past decades, the correlation between GDP growth and positive earnings growth in the stock market has shifted. For example, in the United States, the rolling 10-year correlation dropped from 0.7 to 0 before 1993, then increased to 0.8 until the COVID-19 crisis. During the pandemic, the connection nearly disappeared as the economy slowed but stocks surged due to stimulus measures. Developed markets have seen their median correlation rise from 0.2 to 0.6, while emerging markets show weaker links because of different market structures.
| Period/Region | Correlation Range/Value | Notes |
|---|---|---|
| US (Rolling 10-year, 1958-93) | Declined from 0.7 to 0 | Correlation weakened over this period |
| US (Rolling 10-year, post-1993) | Increased to 0.8 | Strong correlation until COVID-19 crisis |
| US (COVID-19, 2020) | Decoupled (near zero) | Economy tanked, stock market surged due to fiscal and monetary stimulus |
| US (1900-2020, lagged data) | Generally high | Correlations fell during Great Depression, WWII, 1990s, and COVID-19 |
| Developed Markets (14 countries, 1900-2020) | Median increased from 0.2 to 0.6 | Reflects more capitalistic economies and diversified markets |
| Australia (last 20 years) | Negative correlation | Despite steady GDP growth, stock market fluctuated |
| Emerging Markets | Lower correlations | Due to market structure, retail investor dominance, and less mature markets |
From 1998 to 2020, the link between GDP growth and stock rise weakened. Globalization, forward-looking markets, and monetary policy changes have made stocks less dependent on current economic growth. Investors now focus on positive earnings growth and future expectations rather than past GDP numbers. This shift highlights the need to balance growth and value when analyzing the u.s. economy and its bull run.
Investment Opportunities
Investors seeking strong equity returns should look beyond GDP data. GDP measures current activity but does not predict future stock performance. Leading indicators offer more value for identifying investment opportunities tied to economic growth. These indicators include:
- Consumer Confidence Index (CCI)
- Initial jobless claims
- Durable goods orders
- Building permits
- Manufacturing orders
- Producer Price Index (PPI), which signals early inflation trends
Market indexes, bond yields, and commodity prices also help forecast future trends. When several leading indicators point in the same direction, confidence in a stock rise grows. Investors who track these signals can spot value in both growth and value stocks during bull markets. High consumer confidence and positive earnings growth often signal new opportunities as the economy expands.
Tip: Investors should monitor a mix of leading indicators and earnings reports. This approach helps capture value and manage risk during periods of economic growth.
The stock rise in 2025 reflects the impact of interest rates, inflation, tariffs, and global events. Investors benefit from tracking numerical data, using trend analysis, and comparing indexed growth rates to spot opportunities.
- Evidence-driven strategies, such as diversification and monitoring industrial non-renewable energy consumption, help manage volatility.
- Staying alert to market signals and adjusting portfolios as new data emerges supports better investment outcomes.
Smart investors use data, not predictions, to guide decisions and adapt to changing markets.
FAQ
What economic events most influence stock rises in 2025?
Global growth, interest rate changes, inflation, and new tariffs shape stock performance. Policy uncertainty and geopolitical risks also play major roles. Investors track these events to adjust their strategies and manage risk.
How do tariffs affect different sectors?
Tariffs impact technology, industrials, and consumer discretionary sectors the most. These sectors rely on exports and global supply chains. Companies in these areas often see higher costs and more volatility when tariffs increase.
Why do interest rates matter for stock investors?
Interest rates affect borrowing costs for companies and consumers. Lower rates often boost stock prices by making loans cheaper and encouraging investment. Higher rates can slow growth and reduce stock valuations.
How can investors manage market volatility in 2025?
Investors can diversify across sectors, monitor economic indicators, and stay informed about policy changes. Using risk management tools and reviewing asset allocation regularly helps protect portfolios during volatile periods.
Are technology stocks still a good investment in 2025?
Technology stocks remain important for growth. Companies using artificial intelligence and data analytics often outperform others. However, investors should watch for rapid changes in technology and adjust their portfolios as needed.
The 2025 stock market, shaped by steady GDP growth, Federal Reserve rate cuts, persistent inflation, tariffs, and geopolitical risks, presents both opportunities and volatility for investors. Coordinating trades across global markets to capitalize on these dynamics is challenging, with high cross-border fees and complex overseas account requirements hindering diversification. BiyaPay streamlines this process by enabling you to invest in both U.S. and Hong Kong stock markets directly on its platform without needing an overseas account. With real-time, fee-free conversion of over 200 digital currencies, including USDT, into 30+ fiat currencies like USD and HKD, and cross-border remittance fees as low as 0.5%. A 1-minute BiyaPay account registration ensures rapid, secure entry, empowering you to navigate policy-driven volatility, seize growth opportunities, and protect your portfolio in 2025’s dynamic market.
Capture 2025’s stock market opportunities! Join BiyaPay.
*This article is provided for general information purposes and does not constitute legal, tax or other professional advice from BiyaPay or its subsidiaries and its affiliates, and it is not intended as a substitute for obtaining advice from a financial advisor or any other professional.
We make no representations, warranties or warranties, express or implied, as to the accuracy, completeness or timeliness of the contents of this publication.


Contact Us
Company and Team
BiyaPay Products
Customer Services


is a broker-dealer registered with the U.S. Securities and Exchange Commission (SEC) (No.: 802-127417), member of the Financial Industry Regulatory Authority (FINRA) (CRD: 325027), member of the Securities Investor Protection Corporation (SIPC), and regulated by FINRA and SEC.
registered with the US Financial Crimes Enforcement Network (FinCEN), as a Money Services Business (MSB), registration number: 31000218637349, and regulated by FinCEN.
registered as Financial Service Provider (FSP number: FSP1007221) in New Zealand, and is a member of the Financial Dispute Resolution Scheme, a New Zealand independent dispute resolution service provider.