- EasyCard
- Trade
- Help
- Announcement
- Academy
- SWIFT Code
- Iban Number
- Referral
- Customer Service
- Blog
- Creator
How Today’s DJIA Decline Stacks Up Against Historic Market Falls


Image Source: unsplash
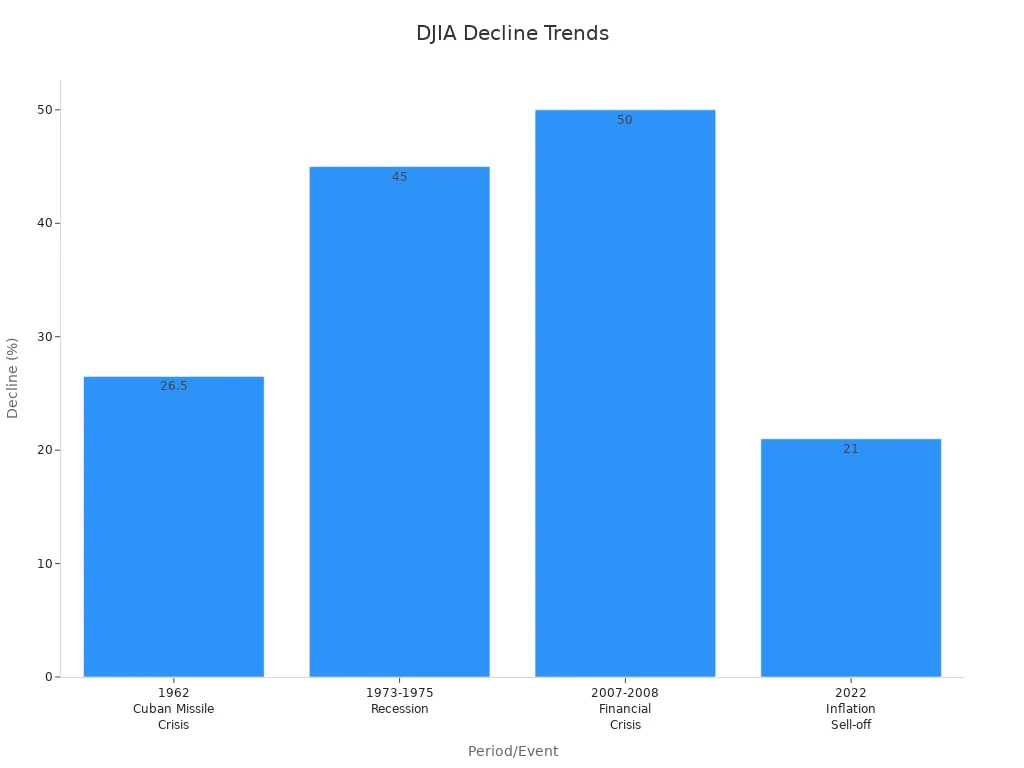
Today’s single-day decline in the dow shocked many investors. The single-day decline reached a level not seen since the 2022 inflation sell-off. Investors now ask, why did djia drop today, and how does this single-day decline compare to the past? The table below shows how the single-day decline stands next to historic drops, such as the 2007-2008 crisis and the 1973-1975 recession.
| Period/Event | DJIA Decline (%) | Context/Notes |
|---|---|---|
| December 2024 | Peak over 45,000 | All-time high reflecting optimism about Fed rate cuts and business growth policies |
| 2007-2008 Financial Crisis | ~50% | Sharp drop due to subprime mortgage and credit crisis triggering the Great Recession |
| 2022 Inflation Sell-off | 21% | Decline post-COVID-19 pandemic due to inflation pressures |
| 1973-1975 Recession | 45% | Significant fall during economic recession |
| 1962 Cuban Missile Crisis | 26.5% | Market loss amid geopolitical tensions |
Understanding each single-day decline helps investors see patterns. Each single-day decline also teaches lessons about market cycles and recovery.
Key Takeaways
- Today’s DJIA drop is large in points but smaller in percentage compared to historic crashes like 1987 and 1929.
- Market declines often happen quickly due to economic shocks, policy changes, and investor fear, even when economic data looks strong.
- History shows markets recover after big drops, but recovery times vary from months to years depending on the situation.
- Investors should stay calm, avoid panic selling, and focus on long-term goals to benefit from market rebounds.
- Diversifying investments and holding quality assets help reduce risk during volatile market periods.
Why Did DJIA Drop Today?
Stock Market Today
The Dow Jones Industrial Average experienced a sharp decline, dropping more than 1,000 points in a single session. Many investors looked at the stock market today and wondered why did djia drop today. The answer lies in a mix of economic signals and investor sentiment. Despite strong economic fundamentals, such as GDP growth expected to exceed 3% in Q2 2025 and unemployment holding steady at 4.2%, the market reacted with fear. Wage gains of 3.9% continue to outpace inflation, and consumer spending remains healthy. Inflation rates, with the Consumer Price Index at 2.4% and the Producer Price Index at 2.6%, have stayed well below the peaks seen in 2022.
Even with these positive numbers, the stock market today reflected investor anxiety about a possible U.S. economic slowdown. This reaction shows how quickly market sentiment can shift, even when the data looks strong.
Key Triggers
Several key triggers explain why did djia drop today. Investors responded to a combination of sector-specific weaknesses, policy changes, and global events. The information technology sector, which often leads market trends, has shown signs of weakness. Capital expenditures in this sector, especially those related to artificial intelligence infrastructure, have plateaued. This signals possible prolonged weakness. The sector has declined about 8% year-to-date, and major stocks like NVIDIA have dropped 3.3% for the year. Slowing growth in technology spending has made investors cautious.
Other factors also played a role:
- Supply and demand imbalances affected stock prices and market equilibrium.
- Inflation concerns influenced investor confidence and market valuations.
- Government fiscal and monetary policies impacted borrowing costs and spending.
- Consumer confidence indices signaled changes in future consumption and savings behavior.
- External events, such as natural disasters or geopolitical conflicts, disrupted markets and investor sentiment.
Empirical studies confirm that markets react immediately to new economic events. For example, research shows that stock markets respond quickly to shocks like the COVID-19 pandemic or major policy announcements. These studies found that when macroeconomic news coincides with earnings reports, markets adjust faster and more accurately. This pattern helps explain why did djia drop today, as investors processed new information and adjusted their positions.
The question of why did djia drop today highlights how sensitive markets are to both data and sentiment. Even when economic fundamentals appear strong, sudden changes in outlook or sector performance can trigger sharp declines.
Major DJIA Drops in History

Image Source: pexels
1929 Crash
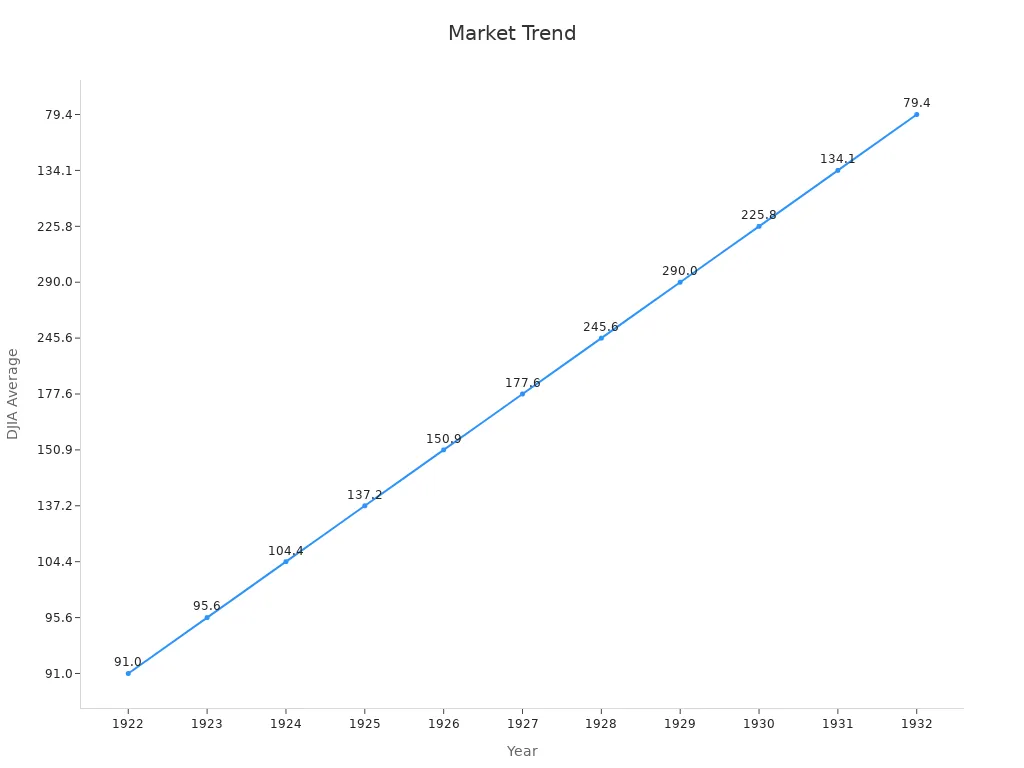
The 1929 Crash marked the most severe single-day decline in stock market history. The market grew rapidly from 1922 to 1929, with the Dow Jones Industrial Average rising over 218%. This growth came from heavy investment in trusts and high leverage. In just eight months of 1929, investment trusts sold $1 billion in shares, more than double the previous year. Stocks became overvalued by at least 30% above their real worth. Price-to-earnings ratios climbed above 15, which was higher than bond yields. When the market turned, the Dow lost 36% of its value between September and December 1929. By 1932, the market had dropped 73% from its peak. The single-day decline during this period shocked investors and led to a long recovery.
Black Monday 1987
Black Monday happened on October 19, 1987. The Dow fell by 508 points, which was a 22.6% single-day decline. This drop remains the largest one-day percentage loss in history. The market had already started to fall in the days before Black Monday. On October 14, the Dow dropped 95.46 points (3.81%). The next day, it lost 57.61 points (2.39%). On October 16, it fell another 108.35 points (4.6%). The crash came from computer-driven trading and panic selling. Investors saw how quickly a single-day decline could erase years of gains.
| Date | Point Loss | Percentage Drop |
|---|---|---|
| October 19, 1987 | 508 | 22.6% |
2008 Crisis
The 2008 financial crisis brought another historic single-day decline. The Dow peaked above 14,000 points in 2007. By February 2009, it had dropped over 50% to just above 6,500. In October 2008, the Dow lost more than 20% in one week. The largest single-day decline during this period was 416 points on February 27, 2007. The crisis started with the collapse of the housing market and spread to banks and the global economy. Unemployment reached 10%, and the Federal Reserve expanded its balance sheet from under $1 trillion to over $4 trillion. The recovery took about six years.
2020 Collapse
The 2020 collapse came from the COVID-19 pandemic. The Dow saw a 26% single-day decline over four trading days in March, equal to a 6,400-point plunge. This drop was faster than the 1929 and 1987 crashes. Some industries, like oil and real estate, lost over 70%. Others, like healthcare, gained value. The market showed extreme volatility, with some stocks swinging up to 130% in a day. The single-day decline in 2020 highlighted how quickly global events can impact markets.
Large declines of 30% or more have happened only six times since 1950. A 50% or greater drop has occurred just four times since 1871. Recovery times vary, from six years after the 2008 crisis to up to 25 years after the Great Depression. The context and composition of the Dow have changed, but the impact of a single-day decline remains significant for investors.
Current Stock Market Collapse
Image Source: unsplash
Plunges 750 Points
The current stock market collapse has drawn attention because the dow plunges 750 points in a single session. This single-day decline stands out as one of the largest in recent years. Market watchers note that the last time the market saw a single 3% down day was almost three years ago. Such a long gap is rare in the past century. Large daily losses often cluster together. When one big drop happens, others may follow soon after. This pattern can lead to even bigger total declines.
Several factors make this single-day decline important:
- Market conditions show overbought levels and very bullish sentiment, similar to what happened in 1987.
- Small-cap stocks and junk debt have started to weaken, which signals trouble for the broader market.
- Risk premiums can spike suddenly, causing sharp drops instead of slow declines.
- Experts like Didier Sornette have found that big drops often come in bursts, not as single events.
A 750-point drop fits with these patterns. It shows how quickly risk can return when market internals weaken.
Percentage vs. Points
Investors often compare single-day decline events by looking at both percentage and point changes. A 750-point drop feels large, but its true impact depends on the dow’s current level. When the index stands above 40,000, a 750-point loss equals less than a 2% decline. In the past, smaller point drops sometimes meant bigger percentage losses because the index was lower.
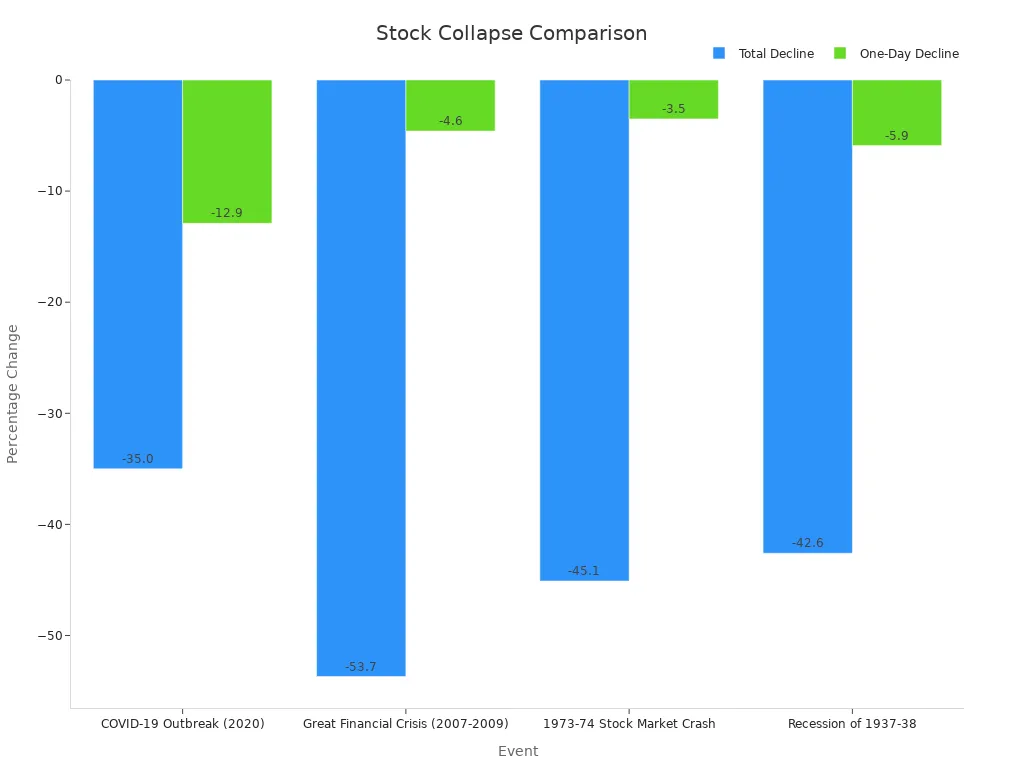
The table below shows how recent and historic declines compare:
| Event | DJIA Decline (%) | Time Frame | Largest Single-Day Decline (%) | Date of Largest Drop |
|---|---|---|---|---|
| COVID-19 Outbreak (2020) | -35.0 | 2/12/2020 - 3/20/2020 | -12.9 | 3/16/2020 |
| Great Financial Crisis (2007-2009) | -53.7 | 10/9/2007 - 3/9/2009 | -4.6 | 10/15/2008 |
| 1973-74 Stock Market Crash | -45.1 | 1/11/1973 - 12/6/1974 | -3.5 | 11/18/1974 |
| Recession of 1937-38 | -42.6 | 9/4/1937 - 3/31/1938 | -5.9 | 11/19/1937 |
Statistical studies show that percentage changes in investor participation have become more volatile since 2020. More people now enter or leave the market quickly. However, the actual dollar amounts invested do not change as much as before. This shift means that percentage declines can look bigger even when point declines are smaller. The break in market behavior around March 2020 marks a new era. Investors now react faster, and the market moves more sharply in percentage terms.
Recovery Patterns
Single-day decline events often cause fear, but history shows that markets can recover. After the 1987 crash, the dow posted a record one-day gain and returned to its old highs within two years. Even in 1987, the index finished the year with a small gain. The 2008 financial crisis brought a much deeper and longer drop. Recovery took several years, and the path back was slow.
The speed of the current stock market collapse stands out. The Federal Reserve now reduces its balance sheet at a pace 2.5 to 3 times faster than in 2017-2019. Each month, up to $95 billion leaves the system, compared to $35 billion before. This rapid tightening removes liquidity and puts pressure on stocks. The environment today also includes high inflation, aggressive rate hikes, and global shocks. These factors make the market more sensitive to policy changes.
Recovery times depend on the size of the single-day decline, the economic backdrop, and how quickly confidence returns. Some collapses see quick rebounds, while others take years. Investors should remember that context matters. The index value, economic conditions, and policy actions all shape the path forward.
Lessons for Investors
What History Shows
History reveals that markets move in cycles. After every major drop, recovery follows. Investors who panic and sell during downturns often miss the rebound. The table below shows how markets have behaved and recovered after big events:
| Historical Event | Market Behavior | Recovery Pattern and Outcome |
|---|---|---|
| Postwar Boom (1957–1969) | Steady rise in S&P 500 | Economic growth led to higher stock prices |
| Stagflation (1970–1981) | Decline below 360 points | Recovery came even after high inflation |
| Internet Boom and Bust (1990–2002) | Sharp rise, then dot-com crash | Market dropped but later recovered |
| Financial Crisis (2007–2009) | Nearly 57% drop | Longest bull run followed, with a 330% rise |
| COVID-19 Crash (2020) | ~15% drop in early 2020 | Quick rebound to record highs by 2021 |
| Market Volatility (2022–2025) | Big swings with recession fears | Market reached new highs |
Investors who stay calm and avoid panic selling give themselves the best chance to benefit from the next recovery. Missing just a few of the best days in the market can cut long-term returns by more than half.
Takeaways Today
Investors today can use several strategies to manage risk and build stronger portfolios:
- Diversify across different assets, such as stocks, bonds, and gold, to reduce risk.
- Consider international stocks to avoid putting all money in one region.
- Focus on companies with strong fundamentals, like steady cash flow and low debt.
- Use fixed income, such as bonds, for stability and income when stocks fall.
- Avoid trying to time the market, as even experts rarely get it right.
- Keep some cash or short-term investments for flexibility during downturns.
A balanced approach helps investors weather market storms. The dow has always recovered from past drops, showing the value of patience and discipline. Investors who focus on quality, diversification, and long-term goals can navigate even the most volatile periods with confidence.
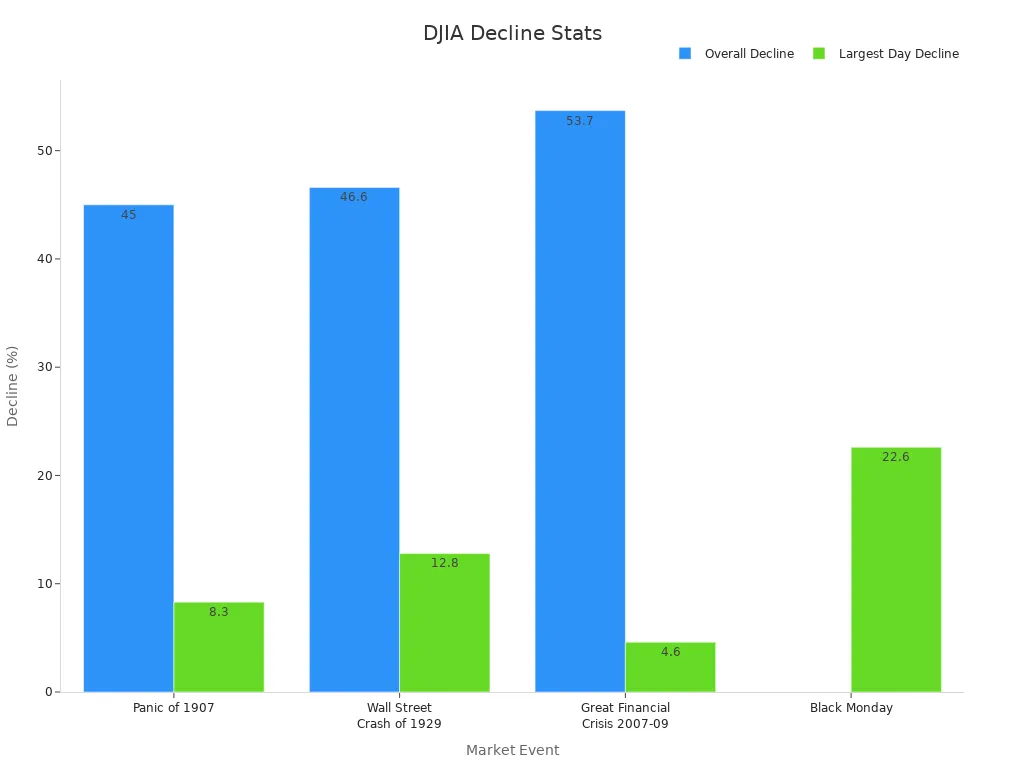
Today’s DJIA decline shares similarities with past market crashes, such as the Wall Street Crash of 1929 and the Great Financial Crisis. The table below shows how today’s drop compares in size and speed:
| Event/Period | DJIA Decline (%) | Duration | Largest Single-Day Decline (%) | Notes on Context and Comparison |
|---|---|---|---|---|
| Today’s COVID-19 Decline | ~35% | ~1 month | N/A | Rapid, severe drop; pandemic-driven shutdown |
| Panic of 1907 | 45% | 10 months | 8.3% (3/14/1907) | Liquidity panic |
| Wall Street Crash of 1929 | 46.6% | ~2 months | 12.8% (10/28/1929) | Led to Great Depression |
| Great Financial Crisis 2007-09 | 53.7% | ~1.5 years | 4.6% (10/15/2008) | Prolonged recession |
| Black Monday (1987) | N/A | 1 day | 22.6% (10/19/1987) | Largest single-day drop |
Markets have always recovered from sharp declines. Investors who stay patient and focus on long-term goals often see positive results after periods of uncertainty.
FAQ
What does a single-day DJIA decline mean for investors?
A single-day DJIA decline shows a sharp drop in stock prices. Investors may feel worried, but history shows that markets often recover. Staying calm and focusing on long-term goals helps most investors.
How does today’s DJIA drop compare to past crashes?
Today’s drop is large in points, but smaller in percentage than past crashes like 1987 or 1929. The Dow now stands at a higher level, so point drops look bigger. Percentage changes give better context.
What usually causes big DJIA declines?
Big DJIA declines often come from economic shocks, policy changes, or global events. For example, the 2008 crisis started with housing problems. The 2020 drop followed the COVID-19 outbreak. News and investor fear can speed up declines.
How long does it take for the market to recover after a crash?
Recovery times vary. After the 1987 crash, the market bounced back in two years. The 2008 crisis took about six years. Quick rebounds can happen, but some recoveries take longer.
Today’s DJIA decline of over 1,000 points, driven by tech sector weakness, policy uncertainty, and shifting investor sentiment, underscores the challenges of navigating volatile markets, especially for PST traders managing early market hours. Diversifying globally to mitigate risk is critical but often complicated by high cross-border fees and the hassle of opening overseas accounts. BiyaPay simplifies this by allowing you to trade U.S. and Hong Kong stocks directly on its platform without needing an overseas account. With real-time, fee-free conversion of over 200 digital currencies, including USDT, into 30+ fiat currencies like USD and HKD, and cross-border remittance fees as low as 0.5%. A 1-minute BiyaPay account registration ensures quick, secure entry, enabling you to diversify your portfolio, manage risk, and seize opportunities during market downturns like today’s.
Navigate market volatility with confidence! Join BiyaPay.
*This article is provided for general information purposes and does not constitute legal, tax or other professional advice from BiyaPay or its subsidiaries and its affiliates, and it is not intended as a substitute for obtaining advice from a financial advisor or any other professional.
We make no representations, warranties or warranties, express or implied, as to the accuracy, completeness or timeliness of the contents of this publication.


Contact Us
Company and Team
BiyaPay Products
Customer Services


is a broker-dealer registered with the U.S. Securities and Exchange Commission (SEC) (No.: 802-127417), member of the Financial Industry Regulatory Authority (FINRA) (CRD: 325027), member of the Securities Investor Protection Corporation (SIPC), and regulated by FINRA and SEC.
registered with the US Financial Crimes Enforcement Network (FinCEN), as a Money Services Business (MSB), registration number: 31000218637349, and regulated by FinCEN.
registered as Financial Service Provider (FSP number: FSP1007221) in New Zealand, and is a member of the Financial Dispute Resolution Scheme, a New Zealand independent dispute resolution service provider.