- EasyCard
- Trade
- Help
- Announcement
- Academy
- SWIFT Code
- Iban Number
- Referral
- Customer Service
- Blog
- Creator
How Geopolitics and Inflation Are Impacting the Market Today


Image Source: unsplash
Stock market news confirms a sharp decline today, with the S&P 500 falling 0.84%, Dow Jones down 0.70%, and Nasdaq dropping 0.91%. The market reacts to escalating geopolitical tensions in the Middle East, higher inflation pressures, and the Federal Reserve’s upcoming rate decision. Investors shift toward safe-haven assets as oil prices rise and inflation data shows a slight uptick. Understanding why market is falling today helps investors navigate volatility and make informed decisions based on the latest analysis.
- S&P 500: 5,982.72 (-0.84%)
- Oil prices: +8% on supply fears
- Gold: +1.5% as risk-off sentiment grows
Key Takeaways
- Rising geopolitical tensions and inflation pressures are causing stock markets to fall and increase volatility today.
- Higher oil prices and new tariffs raise costs for businesses and consumers, fueling ongoing inflation.
- Investor sentiment remains cautious, with volatility indices showing growing market uncertainty.
- Central bank actions, especially Federal Reserve rate decisions, strongly influence inflation and market stability.
- Investors should diversify portfolios, manage risk carefully, and stay informed with real-time news to navigate market changes.
Why Market Is Falling Today
Stock Market News and Key Drivers
The stock market faces significant pressure today. Investors see sharp declines in the S&P 500 and Dow Jones, with the Nasdaq also moving lower. Several key drivers explain why market is falling today. First, the Federal Reserve’s recent decision to keep interest rates unchanged has disappointed those hoping for a rate cut. The Fed’s cautious stance signals ongoing inflation concerns, which weigh on the market. BlackRock’s latest analysis highlights that inflation remains volatile. Although May’s Consumer Price Index rose less than expected, wage growth stays high. This prevents inflation from reaching the Fed’s 2% target.
Geopolitical risks add another layer of uncertainty. Tensions in the Middle East, especially between Israel and Iran, have pushed oil prices up by over 11%. Higher oil prices increase costs for businesses and consumers, fueling more inflation. Trade policy shifts, including new tariffs, begin to lift consumer prices, especially for appliances. The end of the 90-day tariff pause is expected to bring more market fluctuations. Merrill Lynch’s market outlook points to these factors—persistent inflation, geopolitical risks, and shifting trade policies—as the main reasons why market is falling today.
Recent stock market news also shapes investor decisions. Futures movements respond to geopolitical developments, such as delays in decisions on Iran. Institutional demand for certain stocks, like Broadcom, creates volatility in specific sectors. Major indices, including the Dow Jones, S&P 500, and Russell 2000, reflect these trends. Historical market data spanning over 130 years supports the current analysis and helps investors understand why market is falling today.
Note: Real-time news and macroeconomic data play a crucial role in market stability. Models that use live data can better predict sudden changes and price swings, showing the importance of staying updated with stock market news.
Investor Sentiment and Volatility
Investor sentiment drives much of today’s market volatility. The Cboe Volatility Index (VIX) rises as investors react to uncertainty. Newer indices, such as SPOTVOL and the Cboe S&P 500 Left Tail Volatility Index (LTV), provide deeper insights into market fears. SPOTVOL tracks short-term swings, while LTV measures concerns about rare, extreme events. These indices, along with the VIX, show that investor sentiment remains cautious.
Quantified measures confirm the link between investor sentiment and market volatility. Indices use trading volume, put-call ratios, and market turnover to gauge sentiment. Studies show a strong positive correlation between these indicators and volatility. Bullish sentiment can increase short-term volatility, while bearish sentiment often leads to lower returns and different volatility patterns. Mutual fund flows and fund manager sentiment also predict changes in market returns.
The Center for Microeconomic Data’s Survey of Consumer Expectations shows that inflation expectations have decreased, but concerns remain. The labor market outlook improves, with lower unemployment expectations and steady earnings growth. U.S. Bank’s financial perspectives report notes that the Fed’s monetary policy, including rate decisions, directly impacts inflation and unemployment rates. These factors contribute to why market is falling today.
The stock market reacts quickly to fresh news. A recent ScienceDirect study finds that the frequency and content of news flow strongly influence stock price jumps. Companies with high media visibility see greater sensitivity to news events. This sensitivity has increased, making real-time stock market news even more important for understanding why market is falling today.
Tip: Investors should monitor multiple volatility indices and sentiment measures to get a complete picture of market risks. Relying on a single indicator may miss early warning signs of larger moves.
Geopolitics

Image Source: pexels
Global Tensions Impacting the Stock Market
Geopolitical events often cause sharp movements in the stock market. When conflicts or political instability arise, investors tend to move their money into safer assets like gold or U.S. Treasury bonds. For example, Rutgers University uses real-time data to show how sanctions, wars, and trade restrictions can change commodity prices and equity values. The Russia-Ukraine conflict led to higher wheat prices and affected energy exports, which in turn influenced global markets.
J.P. Morgan Private Bank analyzed 36 major geopolitical events from 1940 to 2022. Their research found that the stock market usually drops in the three months after such events. The average real S&P 500 return falls from 1.3% to 0.3%. However, most markets recover within six to twelve months, except in rare cases like the 1973 Arab oil embargo, which caused longer-lasting damage. The table below highlights some key events and their impact on the market:
| Geopolitical Event | Date | Immediate Market Impact | Total Drawdown | Time to Bottom | Recovery Time |
|---|---|---|---|---|---|
| Pearl Harbor Attack | 12/7/1941 | -3.8% | -19.8% | 143 days | 307 days |
| JFK Assassination | 11/22/1963 | -2.8% | -2.8% | 1 day | 1 day |
| Iraq’s Invasion of Kuwait | 8/2/1990 | -1.1% | -16.9% | 71 days | 189 days |
| Sept. 11 Attacks | 9/11/2001 | -4.9% | -11.6% | 11 days | 31 days |
| Russia-Ukraine War | 2/17/2022 | -2.1% | -6.8% | 13 days | 23 days |
| Israel-Hamas War | 10/9/2023 | +0.3% | -4.5% | 14 days | 19 days |
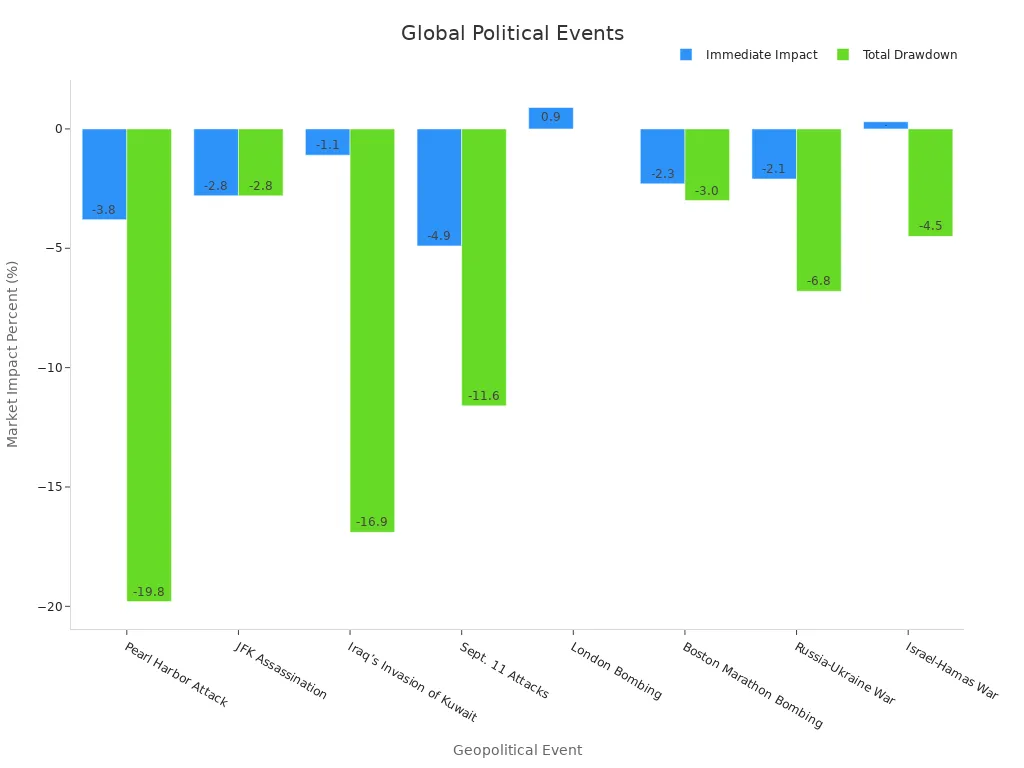
Geopolitical uncertainty often reduces investor confidence and increases volatility. Sectors like defense and commodities may benefit, while industries tied to global supply chains, such as technology and automotive, face more risk.
Recent case studies show that wars, such as the Russia-Ukraine and Hamas-Israel conflicts, disrupt supply chains and raise shipping costs. The Global Supply Chain Pressure Index tracks these disruptions and their effect on the economy. Sectors that depend on global trade, like utilities and telecom, often see the largest negative impacts. Currency markets also react, with investors moving to safe-haven currencies like the U.S. dollar.
Trade Conflicts and Tariffs
Trade conflicts and tariffs play a major role in shaping the stock market. When countries impose tariffs, product prices rise, and consumer spending habits change. For example, a 125% tariff on Chinese imports led to higher prices in the U.S. market. Nearly half of U.S. consumers plan to cut back on spending, and many switch to cheaper brands.
The 2025 U.S.-China trade war showed how tariffs can trigger market volatility. A 10% tariff caused the S&P 500 to drop by 6.65% in one day, and the Cboe Volatility Index spiked to levels seen during the COVID-19 crisis. The U.S. auto industry faced higher costs due to 25% tariffs on imports from Mexico and Canada, affecting companies like Ford and Tesla.
Studies using monthly stock market volatility and economic policy uncertainty indices show that U.S. trade policy changes have a strong and lasting effect on both U.S. and Chinese markets. Before policy announcements, uncertainty can boost returns, but after announcements, markets often fall as expectations adjust. Industry impacts vary: U.S. trade actions hurt Chinese tech and media sectors, while Chinese tariffs affect energy and food industries.
Trade policy uncertainty increases risk for exporters and investors. It can distort trade flows, reduce company profits, and lower stock valuations, making the market more sensitive to global tensions.
Higher Inflation
Inflation Trends and Data
Higher inflation continues to shape the market today. Recent data shows that price pressures remain strong across many sectors. The Consumer Price Index (CPI) stays above the Federal Reserve’s 2% target, especially in core services. Wage growth and shelter costs both contribute to persistent inflation. New tariffs are also raising costs for producers, which may soon reach consumers. The Producer Price Index (PPI) is expected to show more cost increases, signaling ongoing cost-push inflation.
| Inflation Metric / Indicator | Description / Insight |
|---|---|
| Consumer Price Index (CPI) | Persistent inflation above Fed’s 2% target, especially in core services. |
| Producer Price Index (PPI) | Expected to reveal tariff-driven cost increases for producers. |
| Wage Growth | Sustained wage increases add to upward price pressures. |
| Shelter Costs | Elevated shelter costs remain a major inflation driver. |
| Tariffs | New tariffs increase producer costs, likely to impact consumer prices. |
| Treasury Yields (2-year & 10-year) | Volatile yield curve signals uncertainty about growth and inflation. |
Core inflation holds steady at 2.8% annually, showing that price increases remain broad-based. While energy costs have dropped by 3.5%, food and shelter costs continue to rise. Major retailers, such as Walmart, have announced price hikes, and surveys show more small businesses plan to raise prices. U.S. factories report the highest share of price increases since November 2022. Analysts warn that tariff-driven price increases may take months to appear in CPI data, suggesting rebounding inflation could persist.
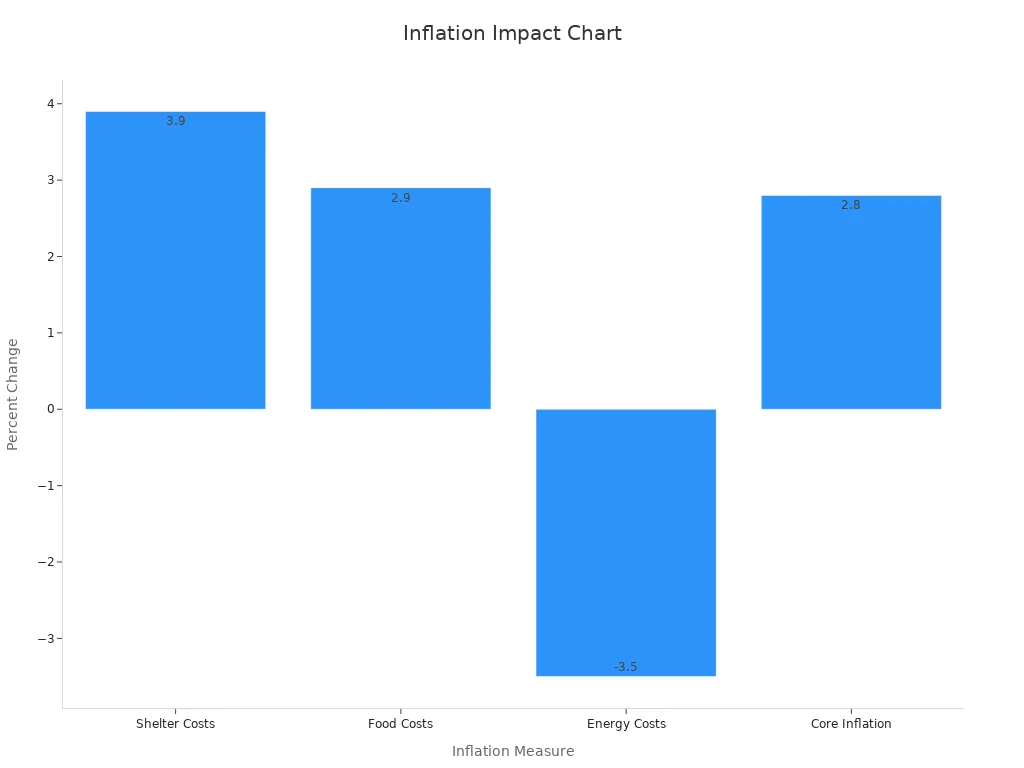
Note: Companies in consumer staples, energy, and healthcare sectors often pass higher costs to consumers, helping protect their profit margins during inflationary periods.
Central Bank Actions
Federal Reserve actions play a critical role in shaping market stability during periods of inflation. The central bank uses interest rate changes and other tools to manage inflation and support financial stability. Recent speeches from the Dallas Fed highlight how monetary policy can influence risk-taking and credit growth. When the Federal Reserve keeps rates low, banks may take on more risk, which can lead to financial vulnerabilities. Tightening policy, such as raising rates, can slow inflation but may also increase financial stress in the market.
Studies show that central banks must balance price stability with financial stability. For example, contractionary monetary policy can reduce inflation but sometimes raises the risk of loan defaults. Macroprudential tools, like higher capital requirements for banks, help manage these risks. The Federal Reserve actions, including rate decisions and regulatory measures, aim to keep inflation in check while supporting the overall health of the financial system.
Tip: Investors should watch for changes in Federal Reserve actions, as these decisions often signal shifts in market conditions and inflation expectations.
Market Volatility
Image Source: unsplash
Credit Spreads and Economic Slowdown
Credit spreads have started to widen, signaling that investors see more risk in the economy. This shift comes as the S&P 500 falls below its 200-day moving average, a technical sign of weakness in the stock market. The VIX index has surged, showing that investor anxiety is rising. Many investors now move their money from stocks to bonds, seeking safety as uncertainty grows. Current data shows that high-yield option-adjusted spreads (OAS) reached 429 basis points in June 2023, up from 327 basis points in early 2022. During past recessions, these spreads climbed over 1,000 basis points, so today’s levels suggest caution but not panic.
| Metric | Peak Value | Current Value | Reference Date | Context/Significance |
|---|---|---|---|---|
| High-Yield OAS | ~600 bps | 429 bps | Early July 2022 / June 2023 | Higher credit risk and refinancing costs |
| HY vs. IG Spread | 432 bps | 288 bps | July 2022 / June 2023 | Reflects market stress during inflation and Fed tightening |
| CCC vs. BB Spread | 935 bps | 717 bps | Nov 2022 / June 2023 | Shows risk premium for speculative bonds |
The economy faces challenges from inflation, Federal Reserve tightening, and global tensions. Highly leveraged companies now face refinancing risks as interest rates rise. Many experts believe that the Fed’s ability to manage a soft landing will determine if the market avoids a deeper downturn. Investors watch credit spreads closely as a warning sign for possible recession and market turbulence.
Sector Impacts in the Stock Market
Volatility does not affect all sectors equally. The energy sector, for example, saw its year-to-date gains drop from over 10% to below 4% by mid-June 2025. The S&P 500 energy sector still posted a 3.92% gain through June 13, 2025, despite recent pullbacks. Crude oil prices, driven by conflicts involving Israel, Iran, Russia, and China, caused sharp swings in energy stocks. Expert analysis highlights that energy prices influence inflation and costs across the economy, especially in transportation and production.
Sector performance reports confirm that volatility impacts each segment differently. Consumer staples often feel the strongest effects from economic policy uncertainty and geopolitical risk. These shocks can cause both positive and negative swings, depending on investor sentiment and risk tolerance. The stock market shows that some sectors, like energy and consumer staples, react more sharply to external shocks, while others remain more stable. This pattern highlights the importance of sector diversification for investors during periods of market volatility.
Market Outlook
Recovery Patterns and Risks
Market outlook remains cautiously optimistic as recovery trends emerge after recent downturns. Historical data shows that recovery phases often begin with rebounds in GDP, industrial production, and employment. Credit growth and profits usually rise quickly during early recovery. Policy support stays in place to encourage growth, while inventories remain low and sales improve. As the cycle matures, growth peaks, credit and profits stay strong, and inventories reach balance with sales.
- Since 1962, bear markets have averaged about 11 months with declines near 34%. Bull markets, in contrast, have lasted around 51 months with gains over 150%.
- The longest bull market lasted more than 12 years, showing strong recovery potential after downturns.
- The U.S. economy is expected to grow in 2025, supported by consumer spending, better financial conditions, and productivity gains.
- Real estate, especially office and industrial sectors, shows signs of moderate recovery and increased demand.
Risk analysis uses several numerical indicators and techniques to measure potential losses and guide decisions. For example, analysts use Single Loss Expectancy (SLE), Annual Rate of Occurrence (ARO), and Annual Loss Expectancy (ALE) to estimate risks. Techniques like Monte Carlo analysis and sensitivity analysis help identify the most significant risks and plan countermeasures. These tools allow investors to understand both the potential for recovery and the risks that remain.
Strategies for Investors
Investors can use several strategies to navigate today’s market outlook. A portfolio check-up helps ensure diversification across size, style, sector, and geography. Performance metrics such as earnings, sales, price-to-earnings ratios, and credit ratings provide valuable insights. Tax-efficient investing, like using funds with low turnover or municipal bonds, can help reduce tax burdens.
- Maintain an emergency fund covering 3-6 months of expenses, adjusted for inflation.
- Use dollar cost averaging to invest steadily during market downturns, which can lower average purchase prices.
- Include Treasury Inflation-Protected Securities (TIPS) in fixed income allocations to help fight inflation.
- Consult financial advisors regularly to align strategies with personal goals and changing market conditions.
- Apply forward-looking portfolio optimization, using option-implied data to reduce volatility and improve returns.
Tip: Investors should focus on risk management, not just volatility. Balancing risk tolerance with portfolio alignment can help achieve long-term goals, even when the market outlook remains uncertain.
Recent stock market declines stem from higher inflation, Federal Reserve policy shifts, and rising geopolitical tensions. JPMorgan notes that elevated valuations and concentrated gains in a few large stocks add to correction risks. Investors should watch for ongoing policy changes and global conflicts, as these drive volatility. The outlook remains mixed, but experts suggest focusing on quality equities, diversified fixed income, and flexible strategies. Staying informed with real-time stock market news helps investors adapt to changing conditions and manage risk as the outlook evolves.
FAQ
What causes the stock market to react quickly to geopolitical events?
Geopolitical events create uncertainty. Investors often move money to safer assets. This shift can cause rapid changes in stock prices. News about conflicts or sanctions can trigger these moves.
How does higher inflation affect daily expenses?
Higher inflation raises the cost of goods and services. Consumers may pay more for food, shelter, and transportation. Companies often pass increased costs to buyers, which can reduce purchasing power.
Why do central banks like the Federal Reserve change interest rates?
Central banks adjust interest rates to control inflation and support economic growth. Raising rates can slow inflation. Lowering rates can encourage borrowing and spending.
Which sectors benefit during periods of market volatility?
Sectors such as energy, consumer staples, and healthcare often perform better during volatility. These industries provide essential goods and services, so demand remains steady even when markets fluctuate.
Navigate volatile markets with confidence using BiyaPay! Our multi-asset wallet enables fee-free USDT conversions to multiple fiat currencies like USD or HKD, with low 0.5% fees for transfers to overseas bank accounts, empowering you to trade global stocks, including on the HKEX, directly. With a 1-minute signup and secure, real-time transactions, BiyaPay simplifies access without complex overseas account setups.
Whether diversifying your portfolio or seizing opportunities, our platform ensures cost-efficiency and reliability. Take control today—visit BiyaPay to register and optimize your investments!
*This article is provided for general information purposes and does not constitute legal, tax or other professional advice from BiyaPay or its subsidiaries and its affiliates, and it is not intended as a substitute for obtaining advice from a financial advisor or any other professional.
We make no representations, warranties or warranties, express or implied, as to the accuracy, completeness or timeliness of the contents of this publication.


Contact Us
Company and Team
BiyaPay Products
Customer Services


is a broker-dealer registered with the U.S. Securities and Exchange Commission (SEC) (No.: 802-127417), member of the Financial Industry Regulatory Authority (FINRA) (CRD: 325027), member of the Securities Investor Protection Corporation (SIPC), and regulated by FINRA and SEC.
registered with the US Financial Crimes Enforcement Network (FinCEN), as a Money Services Business (MSB), registration number: 31000218637349, and regulated by FinCEN.
registered as Financial Service Provider (FSP number: FSP1007221) in New Zealand, and is a member of the Financial Dispute Resolution Scheme, a New Zealand independent dispute resolution service provider.