- EasyCard
- Trade
- Help
- Announcement
- Academy
- SWIFT Code
- Iban Number
- Referral
- Customer Service
- Blog
- Creator
Stock Market Trends Under Trump’s Recent Leadership


Image Source: unsplash
Trump’s 2025 tariffs have created sharp swings in the stock market. Investors now face rising inflation, with forecasts near 4%, and slowing economic growth at about 1.3%. Over 30% of companies named tariffs as their top concern, a major jump from last quarter. The S&P 500 dropped 19% after new tariffs, then partially recovered, showing deep uncertainty.
Understanding these shifts is crucial for anyone following trump stock news or making investment decisions in today’s environment.
Key Takeaways
- Trump’s 2025 tariffs caused sharp stock market swings, raising costs and uncertainty for investors and companies.
- Defensive sectors like Utilities and Health Care performed better, while Technology and Consumer Discretionary faced bigger losses.
- Diversifying investments and sticking to a disciplined plan help manage risks during volatile market conditions.
- Key indicators to watch include tariff rates, market volatility (VIX), Treasury yields, and sector performance shifts.
- Staying informed about policy changes and using forecasting tools can help investors adapt and protect their portfolios.
Trump Stock News
Policy Shifts
Recent trump stock news highlights how the trump administration’s policy changes have shaped market sentiment in 2025. Investors have seen a broad-based rally in major indexes like the Dow Jones, S&P 500, and Nasdaq after the 2024 election. Market forecasters point to strong enthusiasm, especially in sectors such as AI and technology. Companies like Nvidia, Meta, Palantir, and Tesla have experienced significant rallies. Futures markets have reacted sharply to trump’s comments on Iran, causing notable volatility and shifts in stock prices.
- Market sentiment remains cautiously optimistic, supported by detailed stock lists and sector leader analyses.
- Geopolitical developments, particularly those involving Iran, continue to influence futures market fluctuations and investor sentiment.
- Reports and resources, including podcasts and premium investing tools, help investors navigate trump stock news and capitalize on bullish trends.
Historical data shows that political stability has a positive effect on stock indices. For example, studies from Pakistan reveal a 0.24 increase in indices with increased stability. In contrast, political instability often leads to negative stock market performance and increased volatility. In the United States, stock price increases under Republican presidents averaged about 25% from 1925 to 2024. However, major crashes, such as those in 1929, 1974, and 2007, also occurred during Republican terms, showing that specific policy decisions and political events can dramatically influence stock market performance.
Deregulation and Tax Cuts
The trump administration’s focus on deregulation and tax cuts has played a key role in shaping trump stock news. Quantitative models show that intrastate banking deregulation increased county-level economic growth rates by about 0.5 percentage points annually. These changes also brought positive spillovers to neighboring counties. Tax cuts, such as those modeled after the Tax Cut and Jobs Act, led top-earning households to relocate from high-tax cities to lower-tax cities, affecting local earnings and rents. Aggregate income fell by less than 0.2% under certain assumptions, but could decline by about 1.5% when considering broader economic effects.
Empirical analysis shows that U.S. interstate banking and branching deregulations reduced earnings management among firms. Increased banking competition and better access to external credit improved firms’ information environments. These findings suggest that the trump administration’s economic policy has had measurable impacts on corporate earnings and market dynamics, further influencing trump stock news.
Trump’s Tariffs
Image Source: pexels
Tariff-Induced Stock Market Decline
Since January 2025, trump’s tariffs have caused major shifts in the stock market. The S&P 500 dropped by 5.2%, and the Dow Jones Industrial Average fell by 5% by early May 2025. These declines followed a series of new tariffs that targeted imports from several countries. On the day of the tariff announcement, the S&P 500 fell 6%, the Dow Jones dropped 5.5%, and the Nasdaq lost 5.8%. Many market experts link this tariff-induced stock market decline to the uncertainty and higher costs created by the new trade policy. Trump’s statements often blamed outside factors, but most analysts pointed to the trade war as the main cause of the downturn. The stock market reacted quickly to each new policy, showing how sensitive investors remain to changes in international tariffs and the ongoing us-china trade war.
On April 9, 2025, trump announced a 90-day pause on higher, country-specific tariffs for most trading partners. The market responded with a historic rally. The S&P 500 surged 9.5%, the Dow Jones gained 7.9% (about 3,000 points), and the Nasdaq jumped 12.2%. This was the largest single-day gain for the S&P 500 since 2008. Investors saw the pause as a sign that the trade war might cool down. However, the 10% baseline tariff stayed in place, and China faced even higher tariffs, rising to 125%. The market remained volatile as the trade war with China continued, and the risk of further disruptions stayed high.
Supply Chain Disruptions
Trump’s tariffs have forced many companies to rethink their supply chains. The trade war led to higher costs and delays for businesses that rely on global suppliers. Several key trends show how tariffs disrupted supply chains:
- Container traffic at Los Angeles and Long Beach ports increased by nearly 5% year-over-year during the months when tariffs took effect, causing congestion and delays.
- Warehouse vacancy rates in major U.S. logistics hubs dropped to record lows, which drove up storage costs for companies.
- U.S. steel prices rose by 40% after the 2018 tariffs, making it more expensive for manufacturers to produce goods.
- American pork exports to China fell by over 50% after China imposed retaliatory tariffs, hurting U.S. farmers and food producers.
Advanced network analysis showed a 17% change in supply chain strategies for companies hit by tariffs between 2017 and 2019. The automotive sector saw a 37% disruption, with firms moving suppliers away from China and investing more in Mexico, Canada, and domestic sources. These changes increased costs and made it harder for companies to plan for the future. The ongoing us-china trade war and new international tariffs have made supply chains less predictable, which adds to the uncertainty in the stock market.
Trade and Revenue Impact
Trump’s trade policy has changed the way companies and the government earn money from international trade. The following table shows the projected impact of tariffs on government revenue and import volumes:
| Time Period | Projected Tariff Revenue (trillions USD) | Projected Reduction in Imports (trillions USD) |
|---|---|---|
| Next 10 years (2025-2034) | $5.2 trillion (conventional), $4.5 trillion (dynamic) | $6.9 trillion |
| Next 30 years (2025-2054) | $16.4 trillion (conventional), $11.8 trillion (dynamic) | $37.2 trillion |
While tariffs bring in more money for the government, they also reduce the amount of goods the U.S. imports. This drop in trade hurts companies that rely on selling goods overseas. Real wages are expected to fall by 1.4% by 2028, and GDP could drop by about 1%. Employment is projected to decrease by 1.1%, with fewer people joining the workforce. Manufacturing jobs may rise for a short time because of import protection, but services and agriculture lose jobs due to retaliatory tariffs and higher costs.
- U.S. farm exports dropped by 14% because of the trade war and retaliatory tariffs.
- The average U.S. household paid an extra $1,277 each year for goods due to higher prices from tariffs.
- Economists predict a 0.9% loss in GDP growth by 2027 if tariffs continue.
- Some manufacturing jobs increased, such as a 22% rise in steel output, but overall corporate revenues fell as companies faced higher costs and less demand abroad.
The us-china trade war and other international tariffs have made it harder for businesses to plan and invest. Many companies now face lower profit margins and less certainty about future growth. The trade war continues to shape the stock market, with investors watching every move in trump’s trade policy for signs of relief or new risks.
Stock Market Reactions

Image Source: pexels
Volatility Trends
The stock market has experienced higher volatility since trump introduced new tariffs in 2025. Major indexes like the S&P 500 dropped 12% in just four sessions after the tariff announcement, briefly entering bear market territory. Although a 90-day tariff pause led to a short-term stock market recovery, increased stock market uncertainty remains. The VIX index reached 22, signaling persistent turbulence. Treasury yields swung sharply, and the US dollar index fell 4.6% as investors moved away from US assets. Market sentiment declined from -25 to -34, reflecting growing uncertainty about future policy moves.
| Market Segment | Observed Trend / Data Point |
|---|---|
| Equities | S&P 500 dropped 12% in four sessions after tariff announcement; briefly entered bear market territory. |
| Rebounded after 90-day tariff pause but volatility remained elevated. | |
| Defensive sectors outperformed; Energy and Healthcare lagged. | |
| Mega-cap tech stocks down over 15% YTD after +60% gain in prior year. | |
| International Stocks | Outperformed S&P 500 in Q1 for first time since Q3 2023; strong gains in Japan (+6.8%), UK (+5.2%), Europe (+4.4%). |
| Bonds | Treasury yields volatile; corporate credit spreads widened, high-yield bonds underperformed. |
| Rates | Short/intermediate rates fell; long rates rose amid stagflation concerns. |
| Currencies | US dollar index fell 4.6% as investors exited US assets. |
| Commodities | Fell 8.4%, energy prices down 16.2%, Brent crude down 15.5% to $63/bbl. |
| Volatility Indices | VIX at 22, MOVE at 112, indicating elevated volatility in stocks and bonds. |
| Market Sentiment | Declined further from -25 to -34, reflecting increased uncertainty. |
Sector Impacts
Trump’s tariffs have affected industries in different ways. Defensive sectors such as Utilities, Consumer Staples, and Health Care outperformed, showing smaller losses of about 5%. These sectors benefit from stable demand and domestic supply chains. Information Technology and Consumer Discretionary sectors suffered losses over 20% due to supply chain disruptions and reliance on global networks. Companies with strong financial health and stable operations showed better resilience during periods of higher volatility. The S&P 500’s 14% decline in Q4 2018, linked to earlier tariffs, highlights how broad the impact can be.
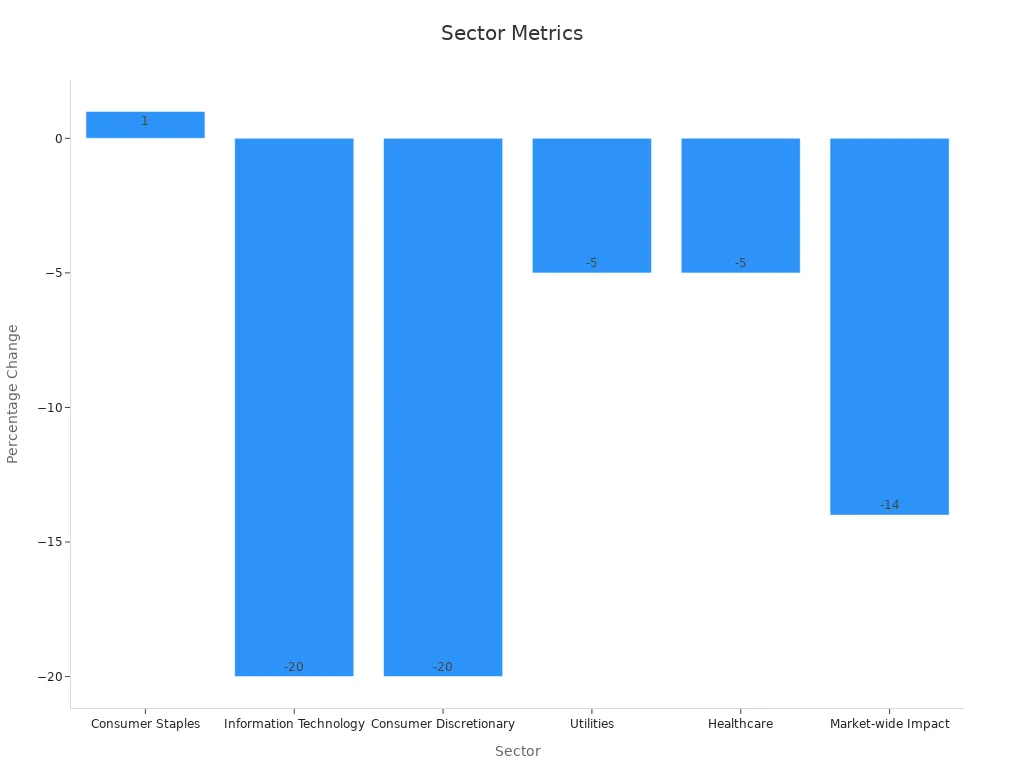
Tariffs on technology products are projected to reduce US consumer purchasing power by up to $143 billion. The automotive industry also faces cost pressures from tariffs on imports from Canada and Mexico, leading to higher prices for consumers.
Investor Sentiment
Investor sentiment has shifted rapidly in response to trump’s policies. The American Association of Individual Investors survey showed a move from extreme bullishness to extreme bearishness within weeks in early 2025. Bearish sentiment stayed above 50% for ten consecutive weeks, a record. Many investors now expect a recession in 2025, according to a Bank of America survey. Companies have delayed investments, adopting a wait-and-see approach as policy uncertainty grows. Despite weaker consumer sentiment, spending has remained steady as buyers rushed to make purchases before tariff-driven price increases.
Note: Investor sentiment indexes, such as those by Baker et al. and Jiang et al., confirm that sentiment swings drive both returns and volatility. Bullish sentiment can increase short-term volatility, while bearish sentiment often leads to lower returns and cautious trading behavior.
US Stock Market Fundamentals
GDP and Growth
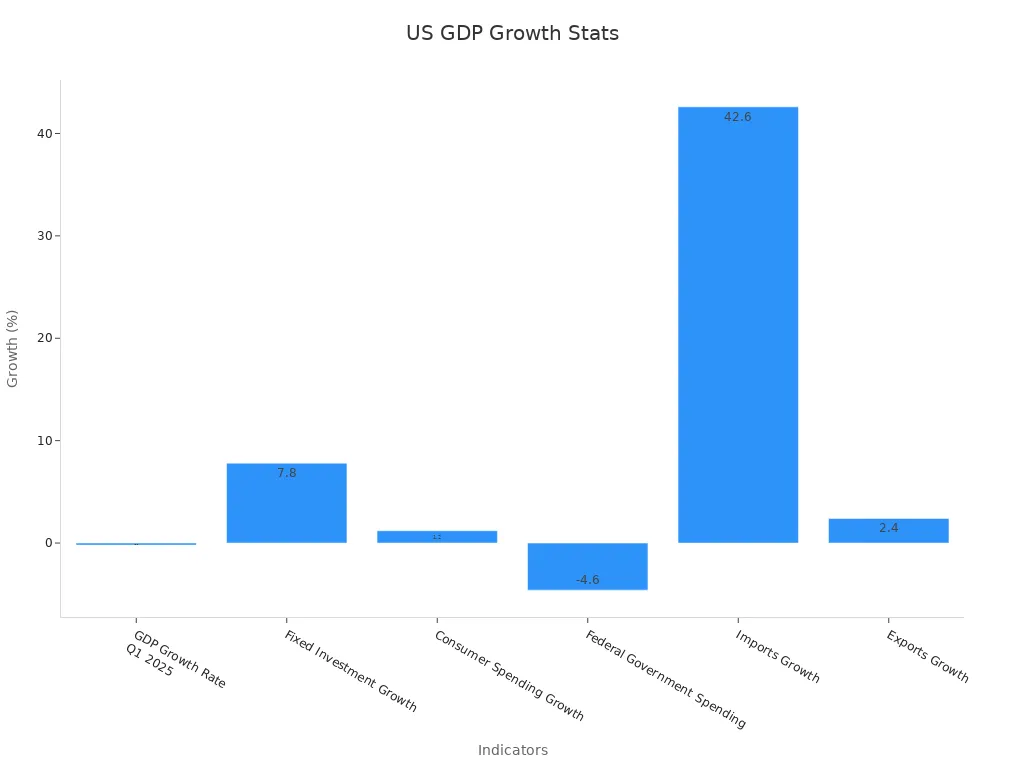
The us stock market reflects the current state of the U.S. economy. In the first quarter of 2025, GDP growth turned negative for the first time in three years, with a -0.2% annualized rate. This contraction signals a slowdown, but some areas remain strong. Fixed investment grew by 7.8%, the highest since mid-2023. Consumer spending increased by 1.2%, but this was the slowest pace since 2023. Federal government spending dropped by 4.6%, reducing support for economic growth. Imports surged by 42.6% as companies rushed to buy goods before new tariffs. Exports rose by 2.4%. The overall GDP level reached $29.98 trillion, up 0.85% from the previous quarter and 4.73% from a year ago.
| Indicator | Value | Context/Significance |
|---|---|---|
| GDP Growth Rate Q1 2025 | -0.2% annualized | First quarterly contraction in 3 years, slight improvement from initial -0.3% estimate |
| Fixed Investment Growth | +7.8% | Strongest gain since mid-2023, partially offsetting GDP contraction |
| Consumer Spending Growth | +1.2% | Slowest pace since Q2 2023, indicating weakening consumer demand |
| Federal Government Spending | -4.6% | Steepest decline since Q1 2022, reducing fiscal stimulus |
| Imports Growth | +42.6% | Surge due to stockpiling ahead of tariffs, impacting trade balance |
| Exports Growth | +2.4% | Moderate increase contributing positively to GDP |
| Overall GDP Level | $29.98 trillion | Up 0.85% from last quarter and 4.73% from one year ago, showing underlying growth despite contraction |
Inflation and Rates
Inflation remains moderate in 2025. The Consumer Price Index stands at 2.4%, and the Producer Price Index is at 2.6%. These numbers are much lower than the peaks seen in 2022. The Federal Reserve has kept interest rates steady after cutting them three times in late 2024. The 10-Year Treasury Bond rate is below its long-term average, while the inflation-adjusted S&P 500 is well above its trend line. This situation shows that stock prices are high compared to interest rates. Historically, high inflation leads to lower stock valuations and more market swings. Value stocks often do better than growth stocks when inflation rises. Investors watch these trends closely because they shape the us stock market’s direction.
Employment and Spending
The labor market remains stable. The unemployment rate holds at 4.2%, and businesses added an average of 144,000 jobs per month in early 2025. Weekly jobless claims have stayed steady for over a year. Consumer spending, which makes up more than two-thirds of GDP, continues to support the us stock market. Retail sales jumped 1.7% in March 2025 as buyers rushed to beat tariffs, but growth slowed to 0.1% in April. From February to April, retail sales were nearly 5% higher than the same period in 2024. Household debt has increased, but most families manage their payments. The Federal Reserve’s steady rates help balance inflation and job growth. Despite lower consumer confidence, high-frequency data shows that spending remains resilient. These trends highlight the importance of employment and spending for economic growth and the us stock market.
Risk Management
Diversification
Diversification remains a core risk management strategy for investors facing the volatility of trump’s 2025 policies. Many financial studies show that spreading investments across different sectors and asset classes helps reduce risk. DALBAR’s Quantitative Analysis of Investor Behavior finds that retail investors often underperform the S&P 500 by several percentage points each year. This gap grows when investors try to time the market during periods of uncertainty, such as those caused by trump’s tariff announcements. J.P. Morgan Asset Management reports that missing just the 10 best market days, which often happen during volatile times, can lower returns by 4.2%. These findings highlight the value of maintaining a diversified portfolio and sticking to a set asset allocation, even when trump’s policies create sharp swings.
However, diversification works best when investors use careful credit analysis. Industry research warns that adding lower-quality or unfamiliar assets can increase risk, especially in short-term portfolios. Experts recommend focusing on higher-quality investments and using a fundamental evaluation process. Large firms often expand their investments across industries during times of high market friction, like the Great Recession, to spread risk and protect cash flow. In today’s environment, with trump’s policies driving rapid changes, dynamic and data-driven diversification strategies help investors manage risk and adapt to shifting market conditions.
Tip: Investors should review their portfolios regularly and adjust allocations as market correlations change, especially when traditional strategies like the 60/40 split become less effective.
Timing Strategies
Timing strategies attract many investors during periods of policy-driven market swings, such as those seen under trump’s leadership. Some traders use sector rotation, moving funds into industries expected to perform well during certain economic cycles. Others rely on technical analysis or event-driven trading, reacting to major news like trump’s tariff pauses or new trade measures. The following table shows how timing strategies played out during a recent policy-driven event:
| Aspect | Details |
|---|---|
| Event | Moderna stock rally during COVID-19 pandemic |
| Entry Point (Long) | $36-$40, anticipating vaccine momentum |
| Trade Management | Trailing stop-loss orders to lock in gains |
| Exit Point (Long) | Near $500 peak, profit-taking due to overvaluation concerns |
| Entry Point (Short) | September 2021, after break of $350 support |
| Short Trade Management | Tight stop-loss orders, close monitoring |
| Influence of News | Positive trial news drove rallies; negative news caused declines |
| Conclusion | Timing strategies based on news and risk management helped mitigate losses and maximize gains |
Despite these examples, research from the Schwab Center for Financial Research shows that trying to time the market, especially during abrupt downturns caused by trump’s policy changes, rarely leads to better results. Investors who wait for the perfect entry often miss out on gains. Consistent investment, such as dollar-cost averaging, proves more effective over time. In the current climate of uncertainty, sticking to a disciplined investment plan and using risk controls like stop-loss orders can help investors navigate the challenges brought by trump’s unpredictable policies.
Geopolitical Risks
Oil Prices
Oil prices often react quickly to geopolitical risks. Many oil reserves sit in regions with political instability, such as the Middle East. When conflicts or tensions rise, oil supply routes can face disruptions. For example, OPEC sometimes changes production levels in response to political or economic events, which can cause immediate shifts in global oil prices. Key maritime routes, like the Strait of Hormuz, remain vulnerable to blockades or attacks. These risks can lead to sudden price spikes.
During the Russian-Ukrainian conflict, Russia stopped sending natural gas to Germany through the Nord Stream-1 pipeline. This action caused European gas futures to surge. The Dutch TTF gas futures contract jumped nearly nine times in one year, reaching $178.50/MWh by October 2022 (using an exchange rate of 1 EUR ≈ 1.06 USD). This example shows how quickly energy markets can react to geopolitical shocks.
Empirical research using advanced models finds that global geopolitical risk shocks increase energy uncertainty. These shocks often raise domestic energy prices in advanced economies and in the euro area. Oil-producing and developing countries may see different effects. The data shows that geopolitical risks have a measurable impact on energy markets worldwide.
Global Tensions
Global tensions, such as those seen during the trump administration, often lead to sharp movements in stock markets. The ongoing trade war and the us-china trade war have added to this uncertainty. Recent conflicts in the Middle East, including those involving Israel and Iran, have caused short-term volatility in the S&P 500. After a dip in February 2025, the index began to recover by June, staying only 1.5% below its all-time high. Oil prices also showed large swings from January to June 2025, with a sharp rise in June linked to the conflict.
The table below highlights how past geopolitical events have affected stock markets:
| Geopolitical Event | Date | Immediate Market Reaction | Total Drawdown | Recovery Time |
|---|---|---|---|---|
| Pearl Harbor attack | 12/7/1941 | -3.8% | -19.8% | ~10 months |
| JFK assassination | 11/22/1963 | -2.8% | -2.8% | 1 day |
| Iraq’s invasion of Kuwait | 8/2/1990 | -1.1% | -16.9% | ~6 months |
| Sept. 11 attacks | 9/11/2001 | -4.9% | -11.6% | ~1 month |
| Russia-Ukraine War | 2/17/2022 | -2.1% | -6.8% | ~3 weeks |
| Israel-Hamas War | 10/9/2023 | +0.3% | -4.5% | ~3 weeks |
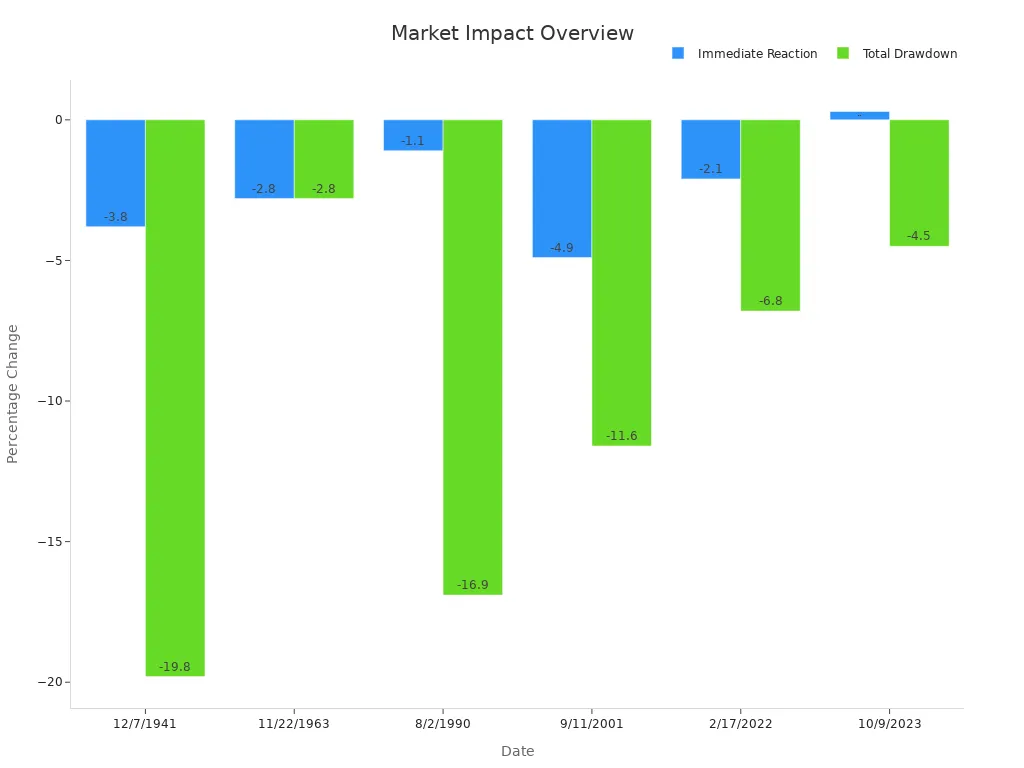
These examples show that while markets often fall after major geopolitical events, they usually recover within weeks or months. The trump administration’s policies, especially tariffs and the trade war, have made investors more sensitive to global tensions. Market participants now watch for new developments that could affect oil prices, trade, and overall market stability.
What’s Next for Investors
Upcoming Trump Stock News
Investors should stay alert to new trump policy announcements. Trump’s recent tariff changes have caused sharp moves in the stock market. The S&P 500 dropped nearly 19% in April after trump introduced new tariffs, then rebounded when trump paused some of these measures. The market remains sensitive to every trump statement about trade or tariffs. Long-term investors may consider entering the S&P 500 index between 5100 and 5500, as long as the economy avoids a recession. Many experts now prefer equal-weighted index funds or active stock-picking over passive, cap-weighted strategies. Quality growth stocks with realistic earnings targets stand out as strong choices. Intermediate-term fixed income assets, especially those in the middle of the yield curve, offer stability. Municipal bonds also present opportunities for steady returns.
Tip: Investors should monitor trump’s tariff policies, Federal Reserve decisions, and economic data releases. Quick reactions to trump’s policy shifts can help protect portfolios from sudden losses.
Key Indicators to Watch
Several key indicators help investors track the effects of trump’s policy changes. Tariff rates have reached historic highs, especially on goods from China, with some rates up to 125%. The VIX Index, which measures market volatility, spiked above 55 after trump’s announcements, showing high uncertainty. The 10-year Treasury yield jumped by 50 basis points in one week, the largest move since 2001. Defensive sectors like utilities and real estate outperformed during periods of trump-driven volatility, while technology and automobile stocks lagged. Net exports contributed a -4.8% drag on GDP in early 2025, reflecting the impact of trump’s trade policy. Domestic demand, however, stayed strong and gave a clearer picture of economic health.
Investors can adapt by using advanced analytics and AI tools for risk assessment. Regularly reviewing data quality, collaborating across teams, and running scenario simulations help manage risks from trump’s unpredictable policy environment. Scenario planning and predictive analytics allow investors to prepare for different outcomes and adjust strategies quickly.
| Indicator | What to Watch For | Why It Matters |
|---|---|---|
| Tariff Rates | Sudden increases or pauses by trump | Direct impact on costs and profits |
| VIX Index | Spikes after trump policy announcements | Signals market uncertainty |
| Treasury Yields | Sharp weekly changes | Affects borrowing and valuations |
| Sector Performance | Defensive vs. cyclical sector shifts | Reveals market risk preferences |
| Net Exports Contribution | Large negative swings | Shows trade policy effects on growth |
Trump’s 2025 policies have reshaped the US stock market. Tariffs under trump have driven volatility, causing sharp swings in investor sentiment. Many investors now watch trump’s decisions closely. Trump’s presidency has made market forecasting more complex. Staying informed about trump’s policy changes, market trends, and global events remains essential. Investors should use risk management and adapt strategies as trump’s actions continue to impact stocks. The table below shows how forecasting models help predict market shifts during trump’s term:
| Forecasting Model / Technique | Description | Role in Market Outlook Forecasting |
|---|---|---|
| Time Series Analysis | Tracks trends and cycles over time | Predicts future market patterns |
| Regression Analysis | Links variables like tariffs to outcomes | Analyzes policy impact |
| ARIMA Models | Handles changing trends and seasonality | Models complex market indicators |
| Machine Learning Algorithms | Learns from data to predict outcomes | Improves accuracy in forecasts |
| Expert Judgment | Uses insights from professionals | Adds qualitative foresight |
| Moving Average & Exponential Smoothing | Smooths data for trend clarity | Aids timely market decisions |
Trump’s next moves will shape the market outlook. Investors should monitor trump’s announcements and use forecasting tools to stay ahead.
FAQ
What caused the recent spike in stock market volatility?
New tariffs announced by Trump in 2025 increased costs for companies. Investors reacted quickly to these changes. The S&P 500 and other indexes dropped sharply. Uncertainty about future policies continues to drive market swings.
How do Trump’s tariffs affect everyday investors?
Tariffs raise prices on imported goods. Many companies pass these costs to consumers. Investors may see lower returns in sectors that rely on global supply chains. Diversification helps reduce risk during these periods.
Which sectors performed best during Trump’s 2025 policies?
Defensive sectors like Utilities, Consumer Staples, and Health Care outperformed. These industries showed smaller losses because they depend less on global trade. Technology and Consumer Discretionary sectors faced larger declines.
What indicators should investors watch in this environment?
Investors should monitor tariff rates, the VIX Index, Treasury yields, and sector performance. These indicators provide early signals of market stress and help guide investment decisions.
How can investors manage risk during policy-driven market swings?
Investors can use diversification and regular portfolio reviews. Many experts suggest focusing on quality assets and using stop-loss orders. Consistent investment strategies often work better than trying to time the market.
Navigate the volatility of Trump’s 2025 policies with BiyaPay! Our multi-asset wallet enables fee-free USDT conversions to fiat currencies like USD, with just a 0.5% fee for transfers to overseas bank accounts, empowering you to trade US stocks like those in the S&P 500 directly. With a 1-minute signup and secure, real-time transactions, BiyaPay simplifies access without the hassle of complex overseas account setups.
Whether diversifying across defensive sectors or capitalizing on tariff-driven rallies, our platform ensures cost-efficiency and transparency. Act now—visit BiyaPay to register and optimize your investments in today’s dynamic market!
*This article is provided for general information purposes and does not constitute legal, tax or other professional advice from BiyaPay or its subsidiaries and its affiliates, and it is not intended as a substitute for obtaining advice from a financial advisor or any other professional.
We make no representations, warranties or warranties, express or implied, as to the accuracy, completeness or timeliness of the contents of this publication.


Contact Us
Company and Team
BiyaPay Products
Customer Services


is a broker-dealer registered with the U.S. Securities and Exchange Commission (SEC) (No.: 802-127417), member of the Financial Industry Regulatory Authority (FINRA) (CRD: 325027), member of the Securities Investor Protection Corporation (SIPC), and regulated by FINRA and SEC.
registered with the US Financial Crimes Enforcement Network (FinCEN), as a Money Services Business (MSB), registration number: 31000218637349, and regulated by FinCEN.
registered as Financial Service Provider (FSP number: FSP1007221) in New Zealand, and is a member of the Financial Dispute Resolution Scheme, a New Zealand independent dispute resolution service provider.