- EasyCard
- Trade
- Help
- Announcement
- Academy
- SWIFT Code
- Iban Number
- Referral
- Customer Service
- Blog
- Creator
The Dow Jones Industrial Average Explained for Modern Investors


Image Source: pexels
The Dow Jones Industrial Average, often called the DJIA, tracks the performance of 30 major companies listed on the US stock market. Investors and analysts rely on the DJIA as a trusted gauge of market health. Its movements often appear in financial headlines, shaping investment strategies across the world.
Recent trends highlight its importance: Following the COVID-19 downturn, the DJIA posted a steady recovery with higher highs and higher lows, reflecting resilience in the broader US stock market. DJIA news today continues to influence decisions for both long-term investors and short-term traders.
Key Takeaways
- The Dow Jones Industrial Average tracks 30 major U.S. companies and uses a price-weighted method, meaning higher-priced stocks affect the index more.
- The DJIA serves as a key market barometer, reflecting the health of the U.S. economy and helping investors make informed decisions.
- Unlike broader indices like the S&P 500, the DJIA focuses on blue-chip companies and offers a focused snapshot of major economic sectors.
- Investors can use the DJIA through index funds, ETFs, and trading strategies to gain exposure to large, stable companies and manage risk.
- While the DJIA provides valuable insights, combining it with other market data ensures a balanced and well-rounded investment approach.
What Is the Dow Jones Industrial Average?

Image Source: unsplash
DJIA Definition
The Dow Jones Industrial Average, or DJIA, stands as one of the oldest and most recognized stock market indices in the world. Charles Dow created the index in 1896 to track the performance of leading industrial companies in the US stock market. The DJIA originally included 12 companies, but today it consists of 30 large, influential corporations that represent a broad cross-section of the U.S. economy. These companies come from sectors such as technology, health care, finance, consumer goods, and industrials.
The DJIA uses a price-weighted method. This means that companies with higher share prices have a greater impact on the index’s movement than those with lower prices. The index calculates its value by adding the prices of all 30 component stocks and dividing by a special divisor. This divisor adjusts for events like stock splits and changes in the list of companies, ensuring the index remains consistent over time.
Note: The DJIA’s price-weighted approach sets it apart from other indices like the S&P 500, which uses market capitalization to determine each company’s influence.
A table below summarizes key facts about the DJIA’s construction and evolution:
| Aspect | Details |
|---|---|
| Creation Year | 1896 |
| Creator | Charles Dow |
| Original Number of Companies | 12 |
| Current Number of Companies | 30 |
| Sectors Represented | Technology, Health Care, Finance, Consumer Goods, Industrials |
| Weighting Method | Price-weighted (stock price determines influence) |
| Notable Recent Additions | Apple (2015), NVIDIA (2024) |
| Comparison to S&P 500 | DJIA: 30 companies, price-weighted; S&P 500: 500 companies, market-cap weighted |
The DJIA’s daily closing prices serve as a foundation for financial research. Analysts use these prices to build networks that reveal how stocks move together, helping investors understand market dynamics beyond simple price changes.
Why It Matters
The DJIA holds a central place in financial markets as a benchmark for the US stock market. Investors, analysts, and policymakers watch its movements closely because it reflects the performance of some of the largest and most influential companies in the country. The DJIA acts as a barometer for the health of the U.S. stock market and the broader economy.
Several factors highlight the significance of the DJIA:
- The index includes 30 blue-chip companies that lead their industries. Changes in their stock prices often signal shifts in the economy.
- Investors use the DJIA to gauge market sentiment and make decisions about buying or selling stocks.
- The DJIA responds to external events such as government policies, Federal Reserve actions, and global economic trends. For example, changes in interest rates or tariffs can cause sharp movements in the index.
- The inclusion of innovative companies like Apple and NVIDIA shows how the DJIA adapts to new economic drivers, such as technology and digital transformation.
- Consumer trends, such as the rise of e-commerce, directly affect the performance of DJIA companies and influence investment strategies.
The Dow Theory, developed by Charles Dow, forms the basis of modern technical analysis. This theory states that the DJIA and related indices, like the Dow Jones Transportation Average, must confirm each other’s trends to validate market direction. If both indices rise together, analysts see this as a sign of a strong market. Volume also plays a role; higher trading volume supports the trend’s strength.
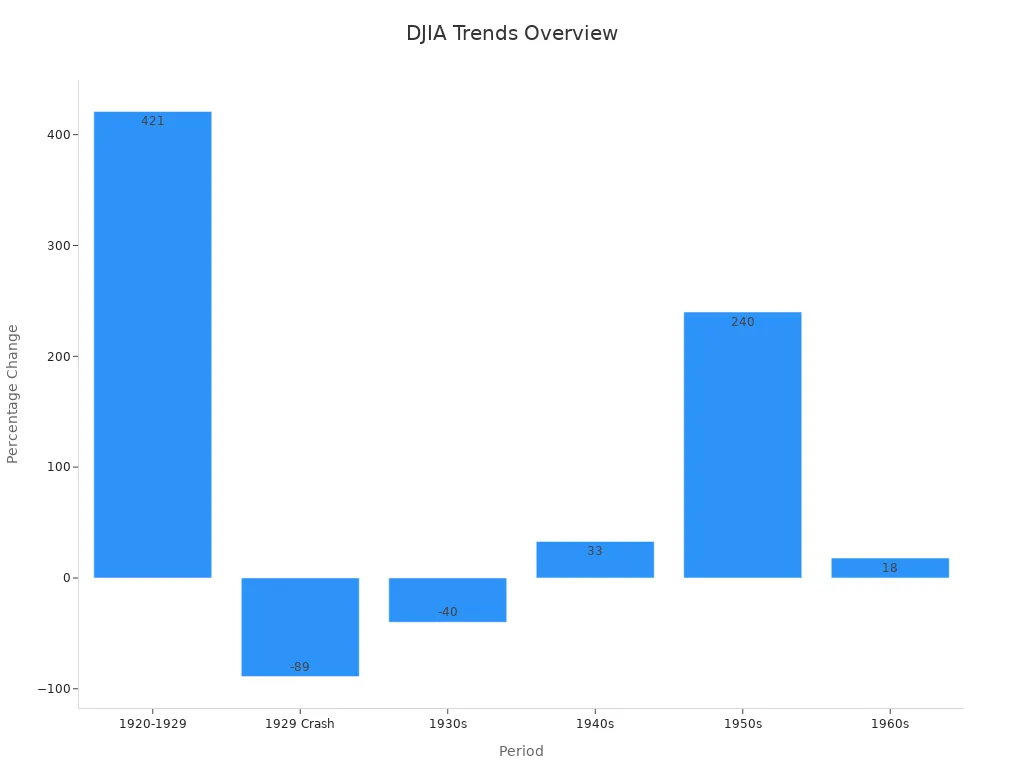
The DJIA’s reliability as a core market indicator comes from its long history and its ability to reflect major economic events. For example, during the 1920s, the index soared by over 400%, only to fall nearly 90% during the Great Depression. These movements show how the DJIA mirrors the ups and downs of the US stock market and the economy.
A look at historical DJIA trends provides further insight:
| Period | DJIA Index Movement | Percentage Change | Historical Context and Significance |
|---|---|---|---|
| 1920-1929 | Rose from 73 to 381 points | +~421% | Roaring Twenties bull run; index expanded to 30 stocks in 1928; peak before 1929 crash. |
| 1929 Crash | Fell from 381.17 (Sep 1929) to 41.22 (1932) | -~89% | Wall Street Crash of 1929 and Great Depression; one of the largest market collapses in history. |
| 1930s | Declined from 248.48 to 150.24 | -~40% | Marked by global instability, wars, and economic recession; worst decade performance for the DJIA. |
| 1940s | Increased from 150.24 to 200.13 | +33% | Post-war reconstruction and optimism despite recession and conflicts. |
| 1950s | Rose from 200.13 to 679.36 | +~240% | Strong growth during Korean War and Cold War era; significant economic expansion. |
| 1960s | Increased from 679.36 to 800.36 | +18% | Market stall during Kennedy Slide but overall gain. |
The DJIA’s long-term trends and responses to major events make it a trusted tool for understanding the direction of the US stock market. Its role as a stock market index extends beyond numbers; it shapes investment strategies and reflects the evolving landscape of the U.S. economy.
History of the Dow
Founding and Early Years
The history of the dow began in 1896. Charles Dow, Edward Jones, and Charles Bergstresser created the Dow Jones Industrial Average to give investors a clear view of the stock market. At that time, company financial reports often misled the public. The DJIA offered a transparent and reliable measure. The first publication included 12 companies, covering almost every major market segment except transportation. These original firms included American Cotton Oil, American Sugar, American Tobacco, Chicago Gas, Distilling & Cattle Feeding, General Electric, Laclede Gas, National Lead, North American, Tennessee Coal & Iron, U.S. Leather, and United States Rubber. The initial value stood at 40.94. The creators wanted to build investor confidence and provide honest market information. The company behind the DJIA later published The Wall Street Journal, which became a trusted financial news source.
Key Milestones
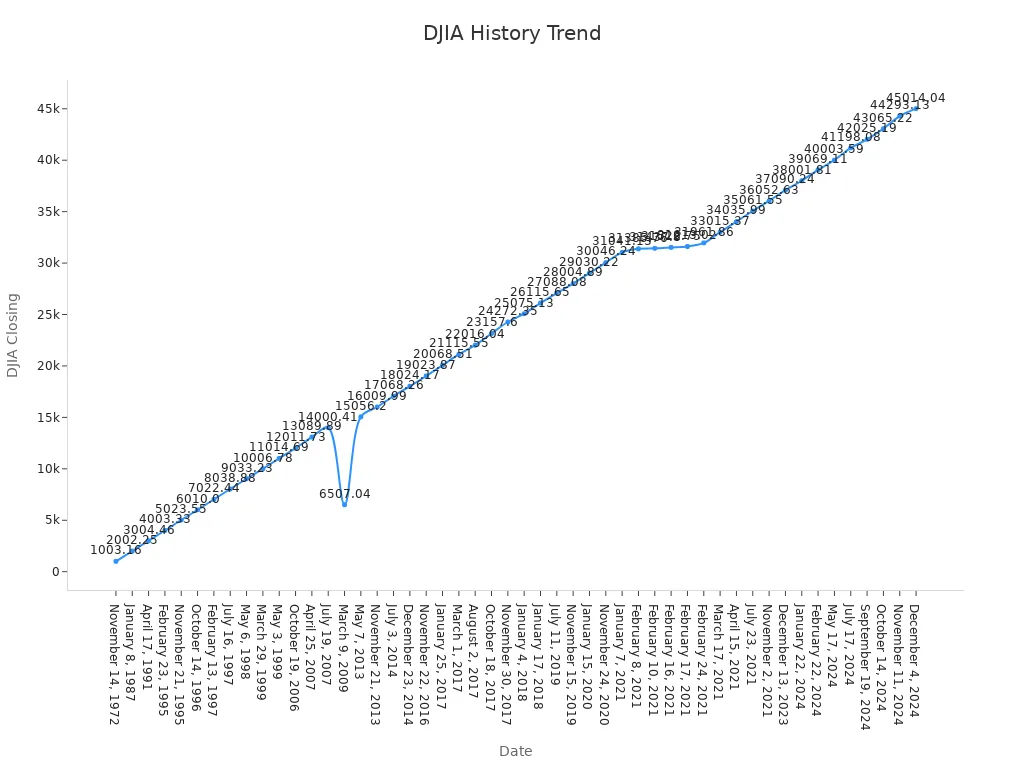
The DJIA has marked many important moments in its long history. The index reached its first major peak at 381.17 points in 1929, just before the stock market crash. By 1932, it had dropped to 41.22, losing almost 89% of its value. The DJIA first closed above 1,000 points in 1972, a milestone that signaled new optimism for investors. Over time, the index crossed many more psychological thresholds, such as 10,000 points in 1999 and 40,000 points in 2024. These milestones reflect both market growth and investor sentiment. The frequency of new highs has increased, showing faster economic expansion and greater enthusiasm for stocks.
| Milestone Event | Date | DJIA Closing Value |
|---|---|---|
| DJIA closes above 1,000 mark | November 14, 1972 | 1,003.16 |
| DJIA closes above 10,000 mark | March 29, 1999 | 10,006.78 |
| DJIA closes above 40,000 mark | May 17, 2024 | 40,003.59 |
Evolution Over Time
The DJIA has changed to reflect the broader economic activities in the us. In its early years, the index focused on industrial companies. Over time, it added leading companies in the united states from technology, health care, and finance. The DJIA now tracks 30 blue-chip firms that shape the U.S. economy. The index often moves in line with key economic indicators, such as GDP, the Consumer Price Index, and employment reports. These trends show how the DJIA mirrors shifts in the economy. Its long history helps investors understand both past and present market conditions.
How the DJIA Works
Company Selection
S&P Dow Jones Indices maintains the Dow Jones Industrial Average. Editors from The Wall Street Journal select the DJIA components. They focus on blue-chip companies that show strong financial health and leadership in their industries. The selection process favors firms with stable dividend policies and a history of regular quarterly payments. Companies must have a large market presence and be widely recognized by investors. The editors avoid adding companies with unstable dividends or those facing major financial problems. The goal is to keep the DJIA representative of the U.S. economy by including only the most reliable blue-chip companies.
- Editors choose companies based on size, reputation, and dividend stability.
- The process excludes firms with erratic dividends or weak management.
- The DJIA components change when a company no longer meets these standards.
- The index aims for diversity by including leaders from different sectors.
Price-Weighted Index
The DJIA uses a price-weighted method to calculate its value. Each stock’s price determines its influence on the index. Higher-priced stocks move the index more than lower-priced ones. The calculation adds the prices of all 30 DJIA components and divides the sum by a special divisor. This divisor adjusts for stock splits and changes in the list of companies. The price-weighted approach means that a $1 change in a high-priced stock affects the index more than a $1 change in a low-priced stock.
- Statistical analysis of DJIA companies shows that financial metrics like Return on Assets (ROA) and Total Asset Turnover (TATO) can influence stock prices.
- Other indicators, such as Debt Equity Ratio (DER) and Price Earnings Ratio (PER), may have less impact depending on the sector.
- Regression analysis and panel data help validate the relationship between these financial indicators and stock returns.
DJIA News Today
DJIA news today provides real-time updates on the performance of blue-chip companies and the overall market. Investors watch these updates to track trends and make informed decisions. As of June 18, 2025, the DJIA opened at 42,236.03. The year-to-date change stands at -0.88%, while the 12-month change is +8.59%. The day’s range falls between 42,118.23 and 42,510.07. The 52-week range stretches from 36,611.78 to 45,073.63. Out of the 30 DJIA components, 15 moved up and 15 moved down.
| Metric | Value |
|---|---|
| DJIA Opening Value | 42,236.03 |
| Year-to-Date Change | -0.88% |
| 12-Month Change | +8.59% |
| Day Range | 42,118.23 - 42,510.07 |
| 52-Week Range | 36,611.78 - 45,073.63 |
| Total Components | 30 |
| Components Up | 15 |
| Components Down | 15 |
DJIA news today also highlights top gainers and decliners among blue-chip companies. For example, Goldman Sachs, JPMorgan Chase, and Merck & Co. led gains, while Visa, Amazon, and McDonald’s saw declines. Economic events, such as Federal Reserve decisions and labor market data, continue to shape DJIA news today and influence investor sentiment.
DJIA vs Other Indices

Image Source: unsplash
S&P 500 and Nasdaq
The Dow Jones Industrial Average stands as one of the most recognized stock market indices, but it is not alone. The S&P 500 and Nasdaq Composite also play major roles in tracking the U.S. market. Each index covers a different segment and uses unique methods to measure performance.
| Feature | DJIA (Dow Jones Industrial Average) | S&P 500 | Nasdaq Composite |
|---|---|---|---|
| Number of Companies | 30 | 500 | Over 2,000 |
| Weighting Method | Price-weighted | Market capitalization-weighted | Market capitalization-weighted |
| Sector Focus | Blue-chip, diversified across sectors | Broad sector diversification | Technology-heavy |
| Price Growth (2019-2022) | +90% | +108% | +133% |
| Volatility & Risk | Least volatile | Moderate volatility | Highest volatility |
| Market Coverage | Large, established companies | Broad US economy | Heavy tech and online business |
The S&P 500 includes 500 large-cap companies and uses market value to determine each company’s influence. The Nasdaq Composite tracks over 2,000 companies, with a strong focus on technology and innovation. These differences shape how each stock market index responds to economic changes.
Differences in Weighting
The DJIA uses a price-weighted approach. This means a company with a higher stock price has more influence, even if it is smaller in size. For example, a $1 change in a high-priced stock moves the DJIA more than a $1 change in a lower-priced stock. This method dates back to the 1890s, when manual calculation was easier with simple averages. Today, this approach can distort the true impact of companies, especially those returning value through dividends or buybacks.
In contrast, the S&P 500 and Nasdaq use market capitalization weighting. This method gives more influence to larger companies by total market value, not just stock price. Market-cap weighting better reflects the economic size and importance of each company. It also captures the impact of growth companies more accurately.
| Feature | DJIA | S&P 500 Index |
|---|---|---|
| Weighting Method | Price-weighted | Market capitalization-weighted |
| Number of Constituents | 30 | 500 |
| Sector Representation | Limited, less diverse | Broad, more diverse |
| Impact on Growth Companies | Can undervalue growth companies | Captures growth companies’ impact |
DJIA in Context
The DJIA covers 30 leading U.S. companies from sectors like technology, health, retail, and finance. Its selective composition provides a focused snapshot of major economic sectors and market sentiment. The DJIA represents less than 1% of the total market, so it does not capture the full range of U.S. business activity. However, its long history and blue-chip focus make it a key barometer for investors.
Investors often use the DJIA alongside other stock market indices to gain a complete view of market trends. The DJIA’s performance, combined with broader indices like the S&P 500 and Nasdaq, helps investors understand both stability and growth in the market.
DJIA for Investors
Benefits
Investors often choose the DJIA as a benchmark for their portfolios. The index offers several advantages:
- The DJIA provides a quick snapshot of the market’s health. Investors can see how major companies perform in real time.
- Index funds that track the DJIA usually have low fees. Passive management reduces costs and can improve net returns.
- Academic research shows that index funds often outperform actively managed funds over long periods.
- The DJIA’s long history gives investors valuable data. They can study past trends and market reactions to make informed decisions.
- The index’s price-weighted structure highlights the impact of higher-priced stocks, which can help investors understand market movements.
- Professional traders use DJIA-linked products like futures, ETFs, and options for hedging and advanced trading strategies.
- Research using quantitative methods, such as Dempster–Shafer theory, shows that investors can rank stocks and optimize portfolios by considering multiple factors, not just past returns.
The DJIA’s secular bull markets have provided positive annualized returns, supporting buy-and-hold strategies for wealth growth.
Limitations
Relying only on the DJIA has risks. Some key limitations include:
- The DJIA tracks just 30 large-cap companies. This narrow focus means it does not reflect the entire market.
- The price-weighted method gives more influence to higher-priced stocks, which may distort the true market picture.
- The index lacks full sector representation. Important areas like energy and utilities may be missing.
- The DJIA has a historical bias toward industrial firms, which may not match today’s economy.
- The small sample size means the index can miss trends in emerging sectors or smaller companies.
- Broader indices, such as the S&P 500 or Wilshire 5000, offer more complete market coverage.
Investors should remember that the DJIA’s limited diversification can increase risk during market downturns.
Using the DJIA
Investors can use the DJIA in several practical ways:
- Many use DJIA-linked ETFs for simple, low-cost exposure to blue-chip stocks.
- Protective put strategies involve buying put options on a Dow ETF to guard against losses while staying invested.
- Some investors sell covered calls on Dow ETFs to earn extra income when expecting flat markets.
- The “Top Ten Dividend Yield” approach invests in the 10 DJIA stocks with the highest yields each year. This method has shown strong results over time.
- Traders analyze option premiums on Dow ETFs to forecast volatility and market direction.
- High-frequency analysis of DJIA returns helps investors spot patterns and time their trades more effectively.
A table below summarizes common DJIA-based strategies:
| Strategy | Purpose | Risk Level |
|---|---|---|
| Index Fund Investing | Long-term growth | Low |
| Protective Put | Downside protection | Moderate |
| Covered Call | Income generation | Moderate |
| Top Ten Dividend Yield | Yield focus, value investing | Moderate |
| Option Premium Analysis | Market timing, risk assessment | High |
Investors should combine DJIA insights with other market data for a balanced investment approach.
The Dow Jones Industrial Average stands as the oldest and most recognized stock market index in the United States. It tracks 30 large companies and uses a price-weighted method. Investors, analysts, and the media rely on the DJIA as a key market barometer. Research shows that familiarity with DJIA stocks shapes investor choices and expectations for returns. The DJIA offers these practical uses:
- Benchmarks investment performance
- Enables portfolio diversification through index funds
- Provides insight into market trends
Investors should combine DJIA insights with other data for well-rounded decisions. Staying informed helps build confidence and supports long-term financial growth.
FAQ
What companies are included in the Dow Jones Industrial Average?
The DJIA includes 30 large U.S. companies. These firms lead their industries. Examples include Apple, Microsoft, and Johnson & Johnson. The list changes when editors decide a company no longer represents the market.
How often does the DJIA change its components?
Editors review the DJIA as needed. Changes do not follow a set schedule. They add or remove companies to keep the index relevant to the U.S. economy.
Can investors buy the DJIA directly?
Investors cannot buy the DJIA itself. They can invest in index funds or exchange-traded funds (ETFs) that track the DJIA. These funds offer exposure to all 30 companies in the index.
Why does the DJIA use a price-weighted method?
The DJIA uses a price-weighted method for historical reasons. Charles Dow designed it this way in 1896. Higher-priced stocks have more influence on the index’s movement than lower-priced stocks.
Unlock the potential of DJIA investments with BiyaPay! Our multi-asset wallet provides fee-free USDT conversions to fiat currencies like USD, with a mere 0.5% fee for overseas bank transfers, enabling seamless trading of DJIA blue-chip stocks. With a 1-minute signup, you can bypass cumbersome overseas account setups and execute trades swiftly to capitalize on market trends or economic events.
Whether investing in index funds or targeting high-yield DJIA stocks, BiyaPay offers cost-efficiency and reliability. Start today—visit BiyaPay to register and elevate your DJIA investment strategy!
*This article is provided for general information purposes and does not constitute legal, tax or other professional advice from BiyaPay or its subsidiaries and its affiliates, and it is not intended as a substitute for obtaining advice from a financial advisor or any other professional.
We make no representations, warranties or warranties, express or implied, as to the accuracy, completeness or timeliness of the contents of this publication.


Contact Us
Company and Team
BiyaPay Products
Customer Services


is a broker-dealer registered with the U.S. Securities and Exchange Commission (SEC) (No.: 802-127417), member of the Financial Industry Regulatory Authority (FINRA) (CRD: 325027), member of the Securities Investor Protection Corporation (SIPC), and regulated by FINRA and SEC.
registered with the US Financial Crimes Enforcement Network (FinCEN), as a Money Services Business (MSB), registration number: 31000218637349, and regulated by FinCEN.
registered as Financial Service Provider (FSP number: FSP1007221) in New Zealand, and is a member of the Financial Dispute Resolution Scheme, a New Zealand independent dispute resolution service provider.