- EasyCard
- Trade
- Help
- Announcement
- Academy
- SWIFT Code
- Iban Number
- Referral
- Customer Service
- Blog
- Creator
What Was the Dow When Trump Left Office and Why It Matters Now


Image Source: pexels
On January 20, 2021, the Dow Jones Industrial Average closed at 31,188.38 as President Trump left office. This number holds significance because investors and analysts often use it to measure the market’s response to major political changes. President Trump saw the Dow Jones Industrial Average climb from 20,000 to over 30,000 points in three years, marking one of the fastest 10,000-point gains in history. President Trump’s time in office included record highs and strong consumer spending. Many still ask, what was the dow when trump left office, to compare market strength and leadership. President Trump’s policies, such as tax cuts and deregulation, played key roles in this rapid market ascent.
Key Takeaways
- The Dow Jones closed at 31,188.38 on January 20, 2021, marking a historic high as President Trump left office.
- Stocks grew rapidly during Trump’s term, with the Dow surpassing 30,000 points for the first time in November 2020.
- Market volatility increased due to events like the COVID-19 pandemic and trade tensions, but stocks showed resilience and quick recovery.
- The Dow’s closing value at Trump’s departure remains a key benchmark for comparing market performance across presidencies and political changes.
- Investors should focus on long-term economic trends and avoid panic during market swings to build strong, lasting portfolios.
What Was the Dow When Trump Left Office?

Image Source: pexels
Closing Value on January 20, 2021
On January 20, 2021, the Dow Jones closed at 31,188.38. Many investors and analysts continue to ask, what was the dow when trump left office, because this number serves as a benchmark for market performance during a major political transition. The closing value can be verified through historical financial databases, such as the Bank of America Corporation’s investor relations website, which provides accurate records for specific dates. This closing figure marked a historic high for the market, reflecting the strong momentum that carried through the final days of president trump’s administration.
The question, what was the dow when trump left office, matters for more than just historical curiosity. It helps investors compare the performance of stocks across different periods and leadership styles. During president trump’s term, the market experienced significant growth. The following table shows how various assets performed from 2017 to 2021, giving a broader view of the financial landscape as president trump left office:
| Asset/Index | Performance 2017-2021 (%) |
|---|---|
| Bitcoin | +3,329.1 |
| S&P 500 Growth | +115.4 |
| S&P 500 | +63.0 |
| Gold | +52.7 |
| MSCI Emerging Mkts | +46.2 |
| S&P 500 Value | +37.3 |
| MSCI Europe | +20.8 |
| MSCI China | +7.4 |
| U.S. Dollar | -9.0 |
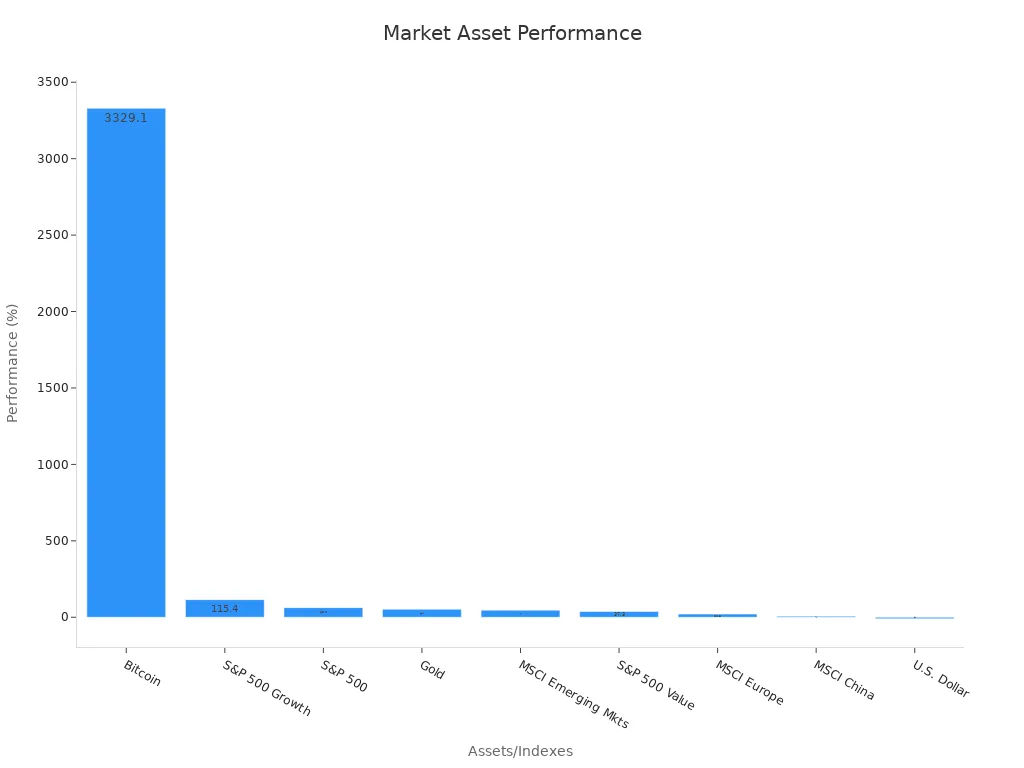
The table and chart above highlight the remarkable gains in stocks, especially in growth sectors. Bitcoin surged over 3,300%, while the S&P 500 rose by 63%. These numbers show that stocks performed well under president trump, and the closing value of the dow jones industrial average on his last day stands as a symbol of that era.
Market Reaction on the Final Day
The market’s reaction on the final day of president trump’s term drew attention from investors worldwide. Many wanted to know, what was the dow when trump left office, because the answer reflects how stocks responded to political uncertainty. On January 20, 2021, stocks showed steady movement, with the Dow closing at a record high. This performance came after a period of volatility caused by events such as the January 6 Capitol incident and the ongoing COVID-19 pandemic.
Several economic indicators help explain the market’s behavior as president trump left office:
- The “Trump Effect” was measured using tools like the Volfefe Index and Google Trends, showing a positive impact on stocks and volatility.
- The Presidential Election Cycle created patterns in stock returns, challenging traditional market theories.
- Political uncertainty and investor sentiment led to increased market volatility and risk premiums.
- Investment strategies like the Political Year Cycle Strategy saw higher returns before elections.
- Market reactions to political news, including unexpected outcomes, affected financial stability and short-term exchange rates.
- President trump’s unique communication style, especially on Twitter, influenced market volatility.
On the final day, analysts observed that stocks remained resilient. Minute-by-minute data showed that before the January 6 event, returns for Bitcoin, the Dow, S&P 500, and Nasdaq 100 were positive. After the event, stocks experienced brief negative movement, but the market quickly recovered. Bitcoin showed the highest volatility, while traditional stocks like the Dow and S&P 500 demonstrated stability. Summary statistics, including variance and standard deviation, confirmed these trends.
The question, what was the dow when trump left office, continues to guide discussions about market strength and investor confidence. The closing value on January 20, 2021, and the market’s reaction on that day, offer valuable lessons for anyone interested in stocks and economic history.
Final Day of Trump Presidency
Key Milestones Reached
The final day of Trump presidency marked the end of a period filled with remarkable achievements for the stock market. One of the most notable milestones was the Dow Jones Industrial Average breaking 30,000 for the first time on November 24, 2020. The index closed at 30,046.24 points, a level never seen before. This historic climb to 30,000 reflected strong investor confidence, driven by positive news about COVID-19 vaccines and the formal transition of power to President-elect Joe Biden. President Trump held a press conference to highlight this achievement, calling 30,000 a “sacred number.” The breaking 30,000 event became a symbol of record stock gains during his administration.
Throughout president trump’s term, stocks experienced significant growth. The stock market responded positively to economic policies, including tax cuts and deregulation. Investors saw stock prices rise quickly, and the market set new highs several times. The breaking 30,000 milestone stood as a testament to the resilience and optimism that defined the era.
Volatility and Major Events
Despite these achievements, the stock market faced considerable volatility during the final days of president trump’s administration. Several factors contributed to this instability:
- The COVID-19 pandemic caused unprecedented swings in stocks. The CBOE VIX index, which measures market volatility, reached a record high of 82.67 in March 2020. This spike coincided with major pandemic events and government actions, including the announcement of a covid-19 relief proposal.
- Regression analyses showed that COVID-19 sentiment and lockdown news led to sharp increases in volatility. However, government relief efforts helped reduce these jumps, stabilizing the market over time.
- Trade wars and tariffs also played a major role. On days when tariffs were announced, the S&P 500 saw average one-day losses of -1.26%, and the VIX rose by 2.26 points. Treasury prices increased as investors sought safety.
- Empirical models found that trade war shocks explained up to 38% of the variance in the S&P 500, highlighting the impact on stocks and stock prices.
President trump’s communication style and policy decisions influenced market sentiment. The stock market, while achieving growth, also reflected the uncertainty of the times. On the final day of trump presidency, investors watched closely as stocks balanced between optimism and caution.
Why It Matters Now
Political and Economic Relevance
The Dow’s closing value at the end of Trump’s term remains a key reference point in current market and political discussions. Investors and policymakers often look at this number to measure how the stock market responds to leadership changes. For example, after the 2024 presidential election, the Dow Jones Industrial Average surged to a record 43,729 points, jumping 1,508 points in a single day. This immediate reaction reflected optimism about expected policies, such as deregulation and tax cuts. However, not all sectors benefited equally. Real estate and utilities declined due to inflation and Federal Reserve interest rate concerns.
Historical analysis shows that while the stock market often reacts strongly to political events, long-term performance depends more on economic trends like inflation and growth. U.S. Bank strategists found that presidential election outcomes have minimal impact on medium- and long-term stock market returns. Instead, underlying economic conditions drive broader market performance. This means that the Dow’s record at the end of Trump’s term highlights short-term optimism but does not guarantee future gains.
Political analysis uses numerical benchmarks to compare different presidencies. The table below shows S&P 500 gains during several recent terms:
| Presidential Term | S&P 500 Gain (%) | Rank Since 1980 |
|---|---|---|
| Trump (2017-2021) | ~68% | 5th best |
| Bill Clinton (1993-1997) | 77.68% | 1st |
| Bill Clinton (1997-2001) | 72.97% | 2nd |
| Barack Obama (2009-2013) | 74.80% | 3rd |
| Ronald Reagan (1985-1989) | 68.05% | 4th |
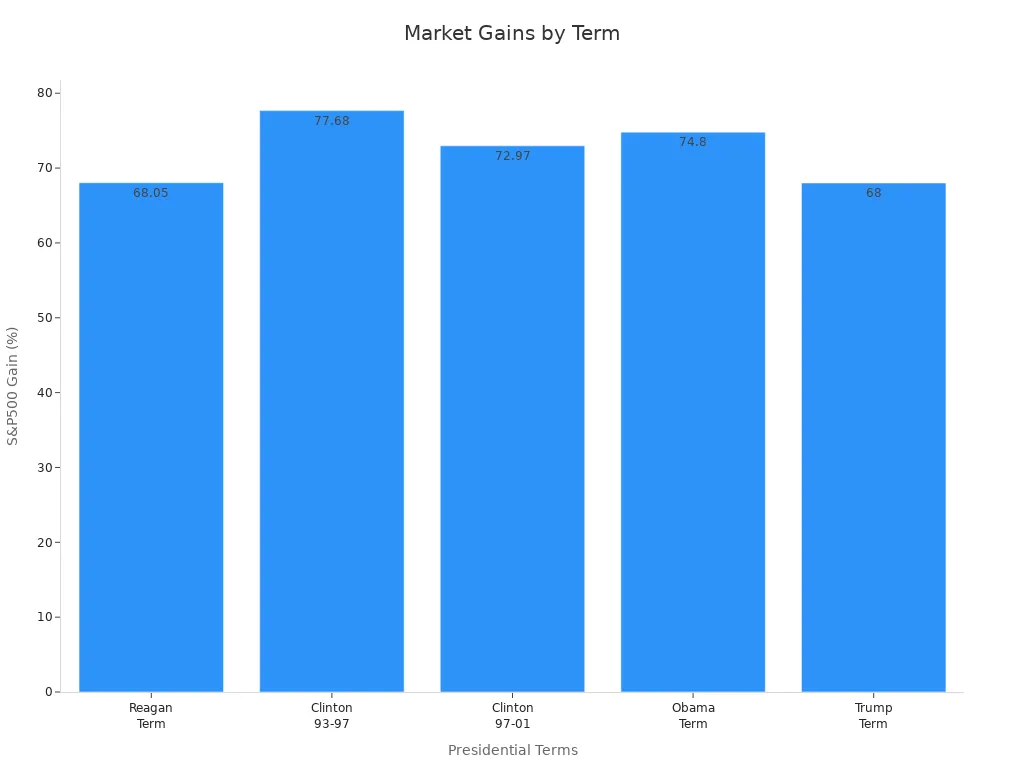
These benchmarks help investors and analysts understand the stock market’s performance in context.
Lessons for Investors
Investors can learn important lessons from the market’s behavior during Trump’s final days. Quantitative studies covering 150 years of U.S. tariff regimes show that tariffs often increase market volatility. During periods of high tariffs, systematic equity strategies, especially those focused on low volatility, have provided stability and added value.
- BlackRock’s research on the S&P 500 from 2005 to 2024 highlights the cost of missing the best recovery days:
- Staying fully invested grew $100,000 to $717,046.
- Missing just five best days reduced this to $452,884.
- Missing 25 best days dropped it to $158,792.
- Dollar-cost averaging helps reduce timing risk and average cost per share.
- Focusing on companies with strong fundamentals offers resilience during uncertainty.
- Panicking during market swings can lead to losses; long-term thinking is crucial.
Financial performance reports, such as balance sheets and income statements, provide numerical insights for strategic decisions. For example, Apple Inc. reported a 15% revenue growth and a 10% rise in operating income in a recent quarter. Investors can use ratios like return on equity to measure profitability and guide their choices.
Investors who understand these lessons can better navigate the stock market during times of change and uncertainty.
Comparing Presidencies

Image Source: unsplash
Trump vs. Recent Presidents
President Trump’s time in office saw notable growth in stocks, especially when compared to other recent leaders. The Dow Jones and S&P 500 both posted significant stock market returns during his term. The S&P 500 rose about 67% from inauguration to the end of his presidency, driven by tax cuts and deregulation. This growth did not start from a market crash, which makes the gains stand out. In contrast, President Obama began his term during a deep recession. Stocks under Obama averaged annual returns of about 12% from 2009 to 2016, reflecting a steady recovery from the financial crisis.
A closer look at financial performance metrics shows that economic growth, job creation, and stock market performance often differ by party and policy. Since World War II, Democratic presidents have generally overseen stronger GDP growth and job creation. However, Trump’s early years featured a robust economy, low unemployment, and moderate inflation. The following table compares key stock market and economic indicators across recent presidencies:
| Presidency | Approximate S&P 500 Gain | Annualized Growth Rate | Key Economic Conditions | Major Challenges | Sector Performance |
|---|---|---|---|---|---|
| Trump (2017–2021) | ~70% | ~12% | Expanding economy, tax cuts | COVID-19 crash in 2020 | Financials, energy, industrials |
| Biden (2021–2024) | ~35% (early 2024) | ~7–8% | Post-pandemic rebound, inflation | 2022 bear market | Tech, green energy, healthcare |
| Obama (2009–2017) | Recovery from recession | ~12% | Stimulus, low rates | Inherited recession | N/A |
Statistical evidence shows that election years bring higher volatility, but average returns remain close to long-term trends. The stock market performed well under both parties, with external events like the pandemic or financial crisis shaping outcomes more than party affiliation. The US Dollar strengthened after Trump’s 2016 win but weakened after Biden’s 2020 victory, reflecting broader economic forces.
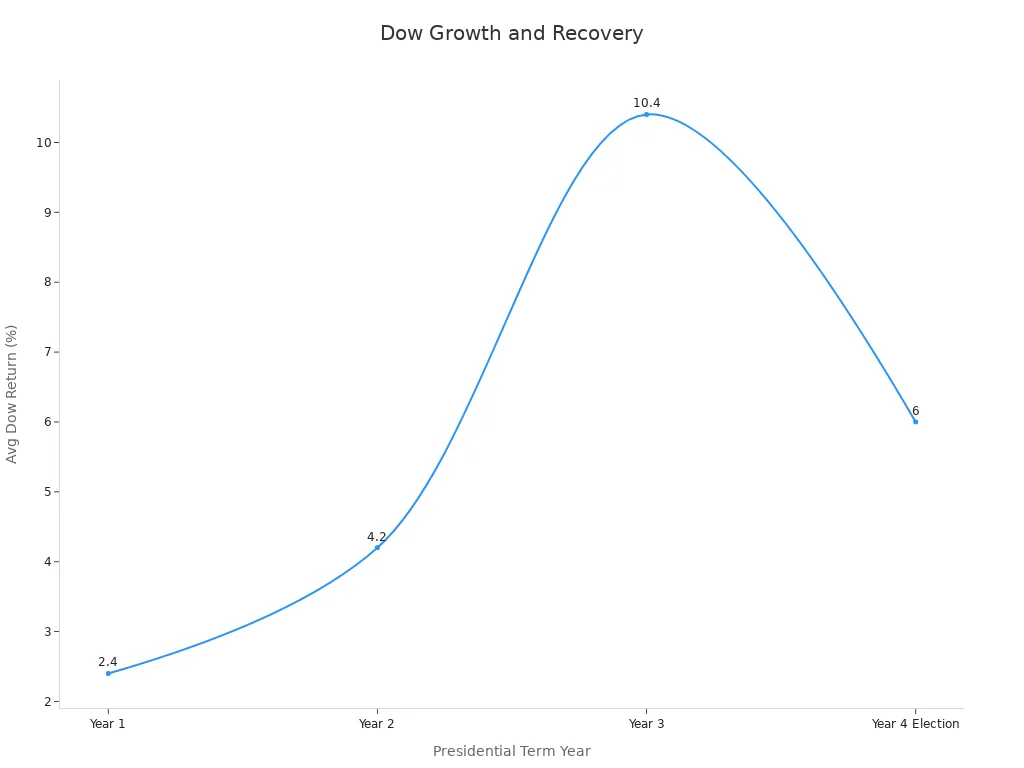
Growth and Recovery Patterns
Growth and recovery patterns in the stock market reveal important differences between administrations. President Trump’s era featured rapid growth in stocks, followed by a sharp drop and quick stock market recovery during the pandemic. The Federal Reserve responded with swift rate cuts, helping stocks rebound faster than in previous downturns. Obama’s recovery was slower, as he inherited a collapsing economy and relied on stimulus and low interest rates to rebuild confidence.
- Obama’s S&P 500 annual returns averaged 12%, starting from a recession bottom.
- Trump’s S&P 500 rose about 67%, with higher volatility and faster rebounds.
- The Federal Reserve’s approach shifted from prolonged low rates under Obama to rapid rate cuts during Trump’s pandemic response.
Historical data confirms that downturns and recoveries occur under both parties, driven by economic cycles. Trump inherited low unemployment and saw it fall to a 50-year low before the pandemic. Job creation exceeded forecasts, supporting strong growth in stocks. The Dow’s performance during Trump’s term fits within typical market cycles, with unique features like the 2017 tax cuts and the pandemic’s impact.
The stock market’s growth under president trump was marked by significant stock market returns, rapid rebounds, and sector shifts. While policy choices matter, external shocks and economic fundamentals play a larger role in shaping long-term stock market performance.
Knowing the Dow’s closing value at the end of Trump’s term helps readers track market history and understand shifts in investor confidence. Key milestones, such as the Dow surpassing 30,000 points in November 2020 and reaching 45,000 points in December 2024, highlight the market’s growth. The table below summarizes major events that shaped the Dow’s journey:
| Date | Event Description | Significance / Value |
|---|---|---|
| November 24, 2020 | Dow exceeded 30,000 points | New record high |
| May 16, 2024 | Dow surpassed 40,000 points | Significant market milestone |
| December 4, 2024 | Dow closed above 45,000 points | Latest record high confirming ongoing growth |
This context allows investors and policymakers to make informed decisions by comparing past and present trends.
FAQ
What is the Dow Jones Industrial Average?
The Dow Jones Industrial Average tracks the performance of 30 large, publicly traded companies in the United States. Investors use it as a key indicator of the overall health of the stock market.
Why do investors watch the Dow’s closing value on presidential transition days?
Investors monitor the Dow’s closing value during transitions to gauge market confidence. Changes in leadership can influence investor sentiment and affect short-term market movements.
How do major events impact the Dow?
Major events, such as elections or global crises, can cause sharp changes in the Dow. These events often lead to increased volatility as investors react to new information.
What does it mean when the Dow reaches a new milestone?
A new milestone, like surpassing 30,000 points, signals strong market momentum. It reflects investor optimism and confidence in economic growth.
How can investors use historical Dow data?
Investors use historical Dow data to compare past and present market conditions. This information helps guide investment decisions and manage risk.
Harness market opportunities amid political shifts with BiyaPay! Our multi-asset wallet offers fee-free USDT conversions to fiat currencies like USD, with a 0.5% fee for overseas bank transfers, enabling rapid trading of US/HK stocks during volatile periods. Register in just 1 minute to sidestep complex overseas account setups and respond swiftly to events like tariff changes or election outcomes.
BiyaPay’s reliable platform supports your long-term investment strategy. Begin today—visit BiyaPay to register and navigate market swings confidently!
*This article is provided for general information purposes and does not constitute legal, tax or other professional advice from BiyaPay or its subsidiaries and its affiliates, and it is not intended as a substitute for obtaining advice from a financial advisor or any other professional.
We make no representations, warranties or warranties, express or implied, as to the accuracy, completeness or timeliness of the contents of this publication.


Contact Us
Company and Team
BiyaPay Products
Customer Services


is a broker-dealer registered with the U.S. Securities and Exchange Commission (SEC) (No.: 802-127417), member of the Financial Industry Regulatory Authority (FINRA) (CRD: 325027), member of the Securities Investor Protection Corporation (SIPC), and regulated by FINRA and SEC.
registered with the US Financial Crimes Enforcement Network (FinCEN), as a Money Services Business (MSB), registration number: 31000218637349, and regulated by FinCEN.
registered as Financial Service Provider (FSP number: FSP1007221) in New Zealand, and is a member of the Financial Dispute Resolution Scheme, a New Zealand independent dispute resolution service provider.