- EasyCard
- Trade
- Help
- Announcement
- Academy
- SWIFT Code
- Iban Number
- Referral
- Customer Service
- Blog
- Creator
Stock Market Plunge Trends to Watch in 2025 and Beyond


Image Source: pexels
Investors face a challenging landscape as stock market plunge risks increase in 2025. Recent data highlight persistent volatility:
- Slower economic growth and higher inflation expectations dominate forecasts.
- Rate volatility remains significant, with 30-year nominal rates up by 27 basis points and real rates rising sharply.
- Low volatility equity factors have outperformed during periods of low growth and high inflation over the past decade.
- Diversification across asset classes and geographies helps manage uncertainty.
Understanding these trends and lessons from the last decade equips investors to respond proactively to a stock market plunge.
Key Takeaways
- Volatility will remain high in 2025, with sharp swings often linked to economic data and recessions, so investors should prepare for sudden market changes.
- Technology stocks heavily influence the market; their gains can boost indexes, but their setbacks can trigger broad declines, making sector monitoring essential.
- Economic cycles strongly affect stock trends; understanding stages like expansion and recession helps investors anticipate market dips and adjust strategies.
- Diversifying investments across asset types and regions reduces risk and improves recovery chances during market plunges.
- Using risk management tools, staying informed on economic signals, and maintaining cash reserves help investors protect portfolios and seize opportunities amid volatility.
Key Stock Market Plunge Trends

Image Source: pexels
Volatility Patterns
Volatility remains a defining feature of the stock market plunge environment in 2025. Investors track volatility using indices such as the VIX for equities and the MOVE for interest rates. These indices reflect how much prices swing over time. During economic data releases, both VIX and MOVE often show more declines than increases, suggesting that markets sometimes calm after new information. However, when a recession begins, volatility usually rises quickly, peaks soon after, and then drops below pre-recession levels within about 90 days. After this period, volatility can surge again, but the size of the increase depends on the recession.
| Aspect | Quantitative Evidence | Description |
|---|---|---|
| Volatility Indices Used | VIX (equity volatility), MOVE (rates volatility) | Data spans from January 1990 to June 2024, covering multiple economic cycles excluding Covid contraction |
| Impact of Economic Data Releases | More declines than increases in VIX and MOVE on release days | Economic releases generally suppress implied volatility rather than increase it |
| Volatility Behavior Entering Recession | Modest increase in volatility after recession start | Initial volatility peak shortly after recession begins, followed by decline over ~90 days |
| Recession Volatility Pattern | VIX and MOVE indices drop below pre-recession levels ~90 days after recession start | Followed by a resurgence in volatility in the subsequent 90 days, magnitude varies by recession |
| Specific Economic Releases Impact | NFP increases VIX in first month of recessions; Services ISM consistently raises VIX at recession start; CPI raises MOVE index heading into and after recession | NFP suppresses volatility in normal times but raises it entering recessions; CPI affects rates volatility more than equity volatility |
| Sample Size | 3 endogenously driven recessions (1990, 2001, 2007-2009) | Excludes Covid contraction due to exogenous shock nature |
Note: Volatility is measured by the standard deviation of returns. Analysts use models like GARCH to predict future volatility, helping investors prepare for sudden market dips.
Technology Sector Impact
The technology sector plays a major role in shaping stock market plunge trends. Over the past decade, technology stocks have driven much of the s&p’s growth. However, this sector also brings higher risk during downturns. When technology companies face earnings disappointments or regulatory challenges, the entire s&p can experience sharp declines. For example, during the dotcom bubble from 2000 to 2002, technology stocks led a prolonged market dip that affected global markets.
Recent trends show that technology stocks remain sensitive to interest rate changes and global supply chain disruptions. As artificial intelligence, cloud computing, and cybersecurity continue to evolve, investors must watch for both rapid gains and sudden corrections. The s&p’s heavy weighting toward technology means that shocks in this sector can trigger a broader stock market plunge.
Economic Cycle Influence
Economic cycles strongly influence stock market plunge risks. The s&p and other indices often move in sync with the broader economy, but sometimes with a delay. Economic indicators such as the Industrial Production Index, Non-Farm Employment, Consumer Price Index, and GDP growth all link closely to stock market performance.
- Stock markets tend to follow business cycles, usually lagging by one to three months.
- Major downturns, like the 2007–2008 global financial crisis and the 2014–2015 oil price collapse, align with sharp drops in the s&p.
- Inflation’s relationship with the stock market has changed over time. In the 1980s and 1990s, higher inflation hurt stock returns. In the 2000s and 2010s, the link became more positive.
- The s&p often lags behind industrial production, challenging the idea that it always predicts economic changes.
Economic cycles include four main stages: Expansion, Peak, Recession, and Trough. During expansion, output and employment rise, supporting stock gains. At the peak, growth slows, and inflation may rise. Recession brings falling GDP, lower spending, and higher risk of a stock market plunge. The trough marks the start of recovery, with markets often rebounding before the economy does.
Investors should monitor these cycles and related indicators to anticipate potential market dips and adjust their strategies accordingly.
Historical Trends
Bear Markets Overview
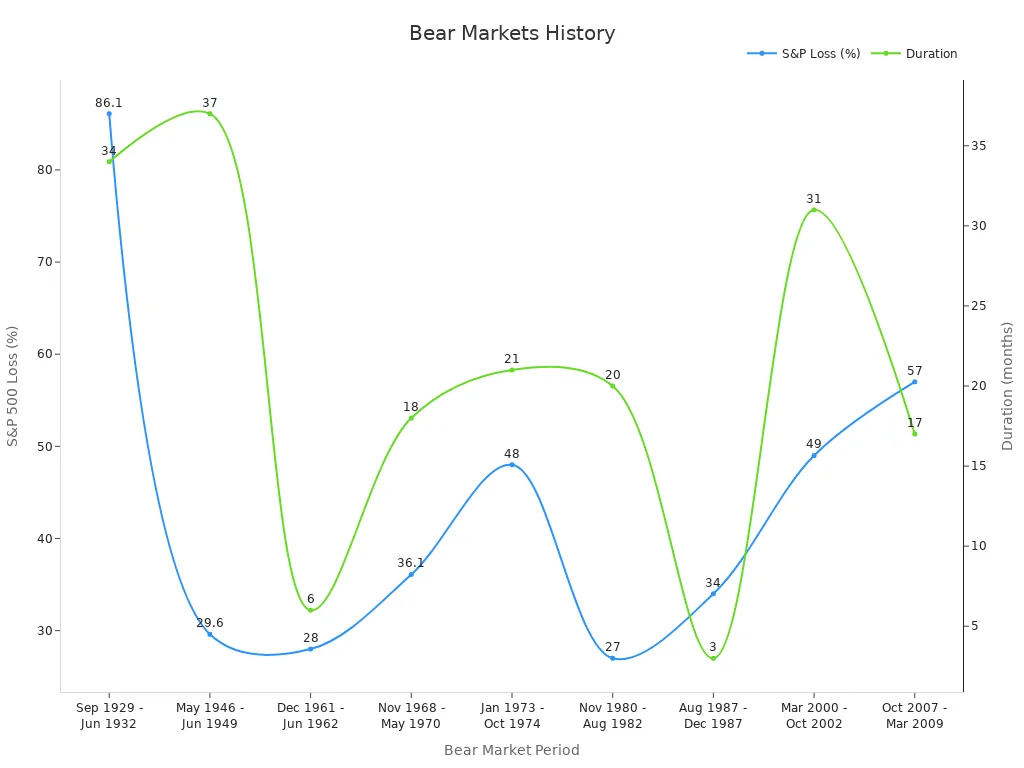
Bear markets have shaped the s&p and global investing for nearly every decade. Since 1928, the s&p has experienced 25 bear markets, with durations ranging from one month to 1.7 years. The average bear market lasts about 9.6 months, and they occur roughly every 4.8 years. Over the past century, 56% of bear markets coincided with recessions, while 44% did not. The s&p saw its most severe decline during the Great Depression, with an 89% drop over three years. The 2007-2009 bear market lasted 1.3 years and saw a 51.9% decline. The table below summarizes key statistics:
| Time Period / Event | Frequency / Count | Average Duration | Duration Range | Severity Range (Decline %) | Notable Examples |
|---|---|---|---|---|---|
| Since 1928 | 25 bear markets | N/A | 1 month to 1.7 years | 20.6% to 89% | 1929-1932 Great Depression (3 years, 89% drop) |
| April 1947 - April 2022 | 14 bear markets | N/A | 1 month to 1.7 years | 20.6% to 51.9% | 2020 bear market lasted 1 month |
Corrections and Recoveries
Market corrections occur more frequently than bear markets. During the 2009-2020 bull run, the s&p experienced five corrections of about 10%. These corrections averaged four months from peak to trough, with recovery times near 113 days. Most corrections, defined as 5%+ declines, did not turn into bear markets. The s&p often rebounded quickly, showing resilience even after sharp drops. Quantitative analysis reveals that recovery patterns can be tracked using intraday data, especially during volatile periods like the 2008 financial crisis. The s&p’s ability to recover from corrections highlights the importance of patience and discipline for investors.
| Metric | Corrections (Non-Bear) | Bear Markets |
|---|---|---|
| Frequency | Frequent during 2009-2020 bull | Less frequent (~1 every 3-5 years) |
| Typical Drawdown | ~10% to -14% average | Roughly -35% to -38% |
| Duration (Peak to Trough) | About 4 months (~133 days) | 10 to 19 months (~289 days) |
| Recovery Time | Approximately 113 days | Longer, often over a year |
| Number of ~10% Corrections | Five during 2009-2020 bull run | None until 2020 pandemic crash |
Lessons from Past Decades
Historical trends show that market crashes often behave as outliers, driven by unique triggers. The s&p has faced major market crashes in almost every decade, including the lost decade of the 2000s. Empirical research finds that companies with high bankruptcy risk lost more value during the 1987 and 2008 crashes. Liquidity shortages made losses worse in 2008. Traditional risk measures like beta did not predict losses well. Instead, firm-specific financial health and market liquidity played bigger roles. Crashes often follow speculative bubbles, with investor herding and imitation fueling rapid price increases before a sharp decline. Mathematical models and statistical patterns, such as log-periodic oscillations, help experts understand and sometimes anticipate crashes. These lessons from each decade remind investors to focus on fundamentals, monitor liquidity, and recognize the warning signs of market correction and crashes.
Market Crash Drivers

Image Source: pexels
Interest Rate Shifts
Interest rate changes play a major role in driving stock market plunges. When rates rise, borrowing becomes more expensive for both consumers and businesses. This leads to less spending and investment. Higher mortgage costs reduce housing demand, causing fewer home sales and pushing more people to rent. Lenders often tighten credit standards during a recession, making it harder for buyers to qualify for loans. Falling home prices can leave many homeowners owing more than their property is worth, which increases foreclosures. A surge in foreclosures floods the market with distressed properties, driving prices down further. These factors increase market volatility and can deepen a downturn.
- Rising interest rates increase borrowing costs and financial stress.
- Reduced spending and investment slow economic growth.
- Lower rates encourage borrowing and support asset prices.
- Market reactions depend on both current rates and expectations for future changes.
- Interest rate shifts affect liquidity, credit availability, and economic confidence.
Interest rate changes often signal the start or end of a recession, making them a key factor for investors to watch.
Global Events
Global events can trigger sharp declines in financial markets. Wars, natural disasters, and public health emergencies often cause sudden drops in stock prices and increased volatility. For example, the S&P 500 index showed a “V” shaped response during wars, with an initial panic followed by recovery. Major events like the 2008 financial crisis and the 2011 Japan earthquake led to higher volatility and changed how markets behaved. Oil prices also react strongly to global events. The First Gulf War caused a 7.29% increase in oil prices, while the COVID-19 pandemic led to a 13.6% decline. Indices such as the Geopolitical Conflict Index help measure the impact of these events on markets.
- Studies use market indices like S&P 500, MSCI World, and Nikkei 225 to track reactions.
- Systemic risk and spillover effects among financial institutions rise during crises.
- Public health emergencies can affect economies for years, as seen in China after COVID-19.
Investors should monitor global events closely, as they can quickly change market conditions and lead to a recession.
Policy and Regulation
Policy changes and new regulations can trigger or worsen market plunges. Governments and central banks often respond to crises with monetary easing or lockdowns. Empirical studies show that monetary policy, such as interest rate cuts, usually supports stock markets during a crisis. Lockdown policies have mixed effects, but some studies find positive market reactions. Markets tend to react more favorably to monetary easing than to containment measures.
| Policy Type | Empirical Findings | Study Scope/Methodology |
|---|---|---|
| Lockdown Policies | Mixed but generally significant impacts on stock markets; some studies find positive market reactions. | Cross-country analyses; event studies during COVID-19 |
| Monetary Policies | Interest rate cuts and monetary easing generally have positive effects on stock markets during crises. | Event studies; high-frequency data around announcements |
| Comparative Impact | Stock markets reacted more favorably to monetary easing than to containment (lockdown) policies. | Robustness checks with different return measures |
| Market Reaction | Positive impact of lockdown and interest rate cuts confirmed; monetary easing perceived as more active. | Cross-country empirical analysis during COVID-19 crisis |
Economic Policy Uncertainty indices show that higher uncertainty leads to increased volatility and risk premiums. Unexpected policy changes can cause strong market reactions, especially during periods of high financial uncertainty. Investors should pay attention to policy announcements, as they can signal changes in inflation or the risk of an economic crisis.
Comparing Past and Present
Data-Driven Markets
Historical market behavior often relied on patterns like support and resistance levels, chart formations, and price cycles. Investors used these trends to predict future movements and plan for long-term growth. In contrast, current stock market behavior responds quickly to real-time events and news. For example, the sharp decline at the start of 2020 during the COVID-19 pandemic showed how fast markets can react to breaking news. Despite this, historical data suggested a recovery would follow, and by September 2020, global equities had rebounded. Today, combining historical trends with real-time sentiment analysis helps investors understand market performance more accurately. Academic studies show that using both types of data can improve prediction accuracy up to 89.80%.
- Predictive modeling now uses lower Mean Squared Error (MSE) for better forecasts.
- Clustering algorithms like k-means improve customer segmentation by about 30%.
- Regression analysis links data use to a 15% increase in market share.
- Nearly 60% of firms use AI and machine learning for real-time analysis.
- Real-time analytics help 75% of companies make faster decisions.
- Companies see a 20-30% boost in ROI when using data analytics.
| Metric | Description | Demonstrated Effectiveness |
|---|---|---|
| Conversion Rate | Percentage of users completing a desired action | Shows marketing success |
| Customer Engagement | Interactions like shares and comments | Reflects audience response |
| Website Traffic | Number of visitors | Measures reach |
| Return on Investment | Profitability of campaigns | Assesses efficiency |
| Customer Acquisition Cost | Cost to gain a new customer | Helps optimize spending |
| Customer Lifetime Value | Total revenue from a customer over time | Indicates retention success |
| Churn Rate | Percentage of customers lost | Highlights retention issues |
| Market Share | Portion of total market controlled | Benchmarks competition |
| Average Revenue Per User | Average revenue per customer | Measures revenue efficiency |
Sector Rotation
Sector rotation describes how investment focus shifts between industries during volatile periods. In the past decade, momentum-based trading rules worked well at the sector level, especially in the 1990s. However, this predictability dropped in the 2000s as sector returns became more correlated and negative autocorrelations appeared. Studies using daily closing prices of sector indices in China over a decade found that information flow between sectors changes during abnormal volatility. For example, the non-bank sector led during the 2014–2015 bubble, while social services dominated at other times. These findings show that sector rotation remains a key feature of market performance, but its effectiveness changes with market conditions.
Retail Investor Role
Retail investors now play a larger role in shaping stock market trends than in any previous decade. Research on Chinese firms from 2007 to 2017 found that higher retail investor attention, measured by search frequency, lowered the risk of future stock price crashes. Retail investors help reduce information gaps and push managers to share negative news sooner, which prevents bad news from building up and causing a sudden plunge. However, recent studies using Robinhood trading data show that retail trading can also increase the co-movement of stock returns and slow the spread of market-wide information. This can make the market more unstable and raise the risk of a recession. Retail investor activity affects liquidity and interacts with institutional investors, making the market more complex and sometimes more vulnerable to sharp declines.
Navigating Plunges
Risk Management
Investors can manage risk by focusing on capital preservation and long-term goals. Warren Buffett’s approach highlights the importance of understanding each investment and avoiding emotional decisions during downturns. He recommends holding cash reserves to avoid forced selling and to seize opportunities when prices drop. Investors should also use quantitative tools to measure risk. These include Value at Risk (VaR), which estimates the maximum expected loss, and Monte Carlo simulations, which model a range of possible outcomes. Scenario analysis and stress testing help investors prepare for adverse conditions.
- Maintain cash buffers for flexibility.
- Use hedging strategies, such as options, to offset potential losses.
- Regularly rebalance portfolios to match changing risk profiles.
- Track risk using key indicators like risk scores, incident frequency, and compliance rates.
Tip: Investors who focus on stable, cash-generating companies often withstand volatility better than those chasing short-term gains.
Diversification
Diversification remains a proven way to reduce risk during market plunges. Empirical research shows that portfolios with a mix of stocks, bonds, gold, and oil perform better in crises than those concentrated in one asset class. Even when asset correlations rise, diversified portfolios still limit losses. Studies of U.S. firms from 2000 to 2020 confirm that diversification lowers the chance of extreme price drops and improves information disclosure. Geographic diversification also helps. For example, during the 2000s, U.S. stocks lost value, while markets in Australia and Canada gained. A balanced global portfolio would have reduced losses significantly.
| Portfolio Type | Downturn Loss | Recovery Performance |
|---|---|---|
| Diversified Portfolio | Lower | Stronger |
| All-Stock Portfolio | Higher | Slower |
| All-Cash Portfolio | Minimal | Weakest |
Monitoring Signals
Investors should monitor leading economic indicators to anticipate market plunges. These indicators include stock indexes, building permits, manufacturing orders, and consumer confidence surveys. When several indicators move in the same direction, the risk of a downturn increases. The Buffett Indicator, which compares total market capitalization to GDP, can also signal overvaluation. It often provides warnings 10 to 24 months before a plunge, though it is not perfect. Investors should use multiple signals together for better accuracy.
Staying informed and setting realistic expectations help investors respond calmly and make better decisions during volatile periods.
Investors face a changing market. They benefit from understanding both past and present trends. The table below shows how analytics guide better decisions:
| Type of Analytics | Key Question Answered | Practical Implication for Market Strategies |
|---|---|---|
| Descriptive Analytics | What happened? | Summarizes past trends to identify patterns, such as seasonal sales spikes, providing a factual basis for further analysis. |
| Diagnostic Analytics | Why did this happen? | Explores causes behind trends by analyzing related data (e.g., customer demographics), helping understand market drivers. |
| Predictive Analytics | What might happen in future? | Uses historical and industry data to forecast future events, enabling informed strategic planning based on likely scenarios. |
| Prescriptive Analytics | What should we do next? | Suggests actionable steps based on predictions and factors, guiding decisions to capitalize on anticipated market behaviors. |
Smart investors review their strategies often. They stay alert to signals and adapt to new realities. Ongoing vigilance helps them prepare for future market changes.
FAQ
What signals often warn of a coming stock market plunge?
Analysts watch for rising volatility, falling consumer confidence, and sharp drops in leading economic indicators. Sudden changes in interest rates or unexpected global events can also serve as early warnings for a potential market downturn.
How can investors protect their portfolios during a market crash?
Investors can diversify across stocks, bonds, and commodities. They may hold cash reserves and use hedging strategies. Regular portfolio reviews help reduce risk. Many experts recommend focusing on stable companies with strong cash flow.
Why do technology stocks impact the entire market during downturns?
Technology stocks often make up a large part of major indexes. When these companies face losses or regulatory issues, their declines can pull down the whole market. Investors should monitor sector performance closely.
How do global events affect stock markets?
Wars, natural disasters, and health crises can cause sudden drops in stock prices. These events increase uncertainty and volatility. Investors often see quick changes in market direction after major global news.
What role do Hong Kong banks play in market stability?
Hong Kong banks provide liquidity and credit to global markets. Their policies can influence investor confidence. During periods of stress, strong banking systems help limit the spread of financial risk.
In a volatile 2025 market, where economic cycles and global events drive sharp plunges, BiyaPay empowers investors to stay resilient. Trade US and HK stocks alongside cryptocurrencies in one secure account, eliminating the need for complex offshore setups. Convert USDT to USD or HKD with real-time exchange rates to seize opportunities across global markets.
With transfer fees as low as 0.5%, BiyaPay outperforms traditional providers, offering cost-effective diversification. Licensed by FinCEN and FINTRAC, it ensures safety amid uncertainty. Sign up in minutes to build a robust portfolio. Join BiyaPay today to navigate market swings with confidence! Start investing with BiyaPay now to capitalize on volatility!
*This article is provided for general information purposes and does not constitute legal, tax or other professional advice from BiyaPay or its subsidiaries and its affiliates, and it is not intended as a substitute for obtaining advice from a financial advisor or any other professional.
We make no representations, warranties or warranties, express or implied, as to the accuracy, completeness or timeliness of the contents of this publication.


Contact Us
Company and Team
BiyaPay Products
Customer Services


is a broker-dealer registered with the U.S. Securities and Exchange Commission (SEC) (No.: 802-127417), member of the Financial Industry Regulatory Authority (FINRA) (CRD: 325027), member of the Securities Investor Protection Corporation (SIPC), and regulated by FINRA and SEC.
registered with the US Financial Crimes Enforcement Network (FinCEN), as a Money Services Business (MSB), registration number: 31000218637349, and regulated by FinCEN.
registered as Financial Service Provider (FSP number: FSP1007221) in New Zealand, and is a member of the Financial Dispute Resolution Scheme, a New Zealand independent dispute resolution service provider.