- EasyCard
- Trade
- Help
- Announcement
- Academy
- SWIFT Code
- Iban Number
- Referral
- Customer Service
- Blog
- Creator
How Chinese Investors Can Seize New Trends in U.S. ETF Investments in 2025


Image Source: pexels
In 2025, the U.S. ETF market dominates the global ETF landscape, with assets exceeding $10 trillion and a compound annual growth rate of nearly 19%. Chinese investors’ interest in U.S. stocks continues to rise, and cross-border ETF capital has expanded rapidly. U.S. ETFs attract investors with their diversification, low costs, and risk dispersion, with technology-themed products being particularly popular. To seize new opportunities in global asset allocation through U.S. stock trading, investors should focus on practical advice and risk considerations outlined below.
Key Points
- The U.S. ETF market is vast with diverse products, ideal for Chinese investors to achieve global asset allocation and risk diversification.
- Technology, consumer, healthcare, and green energy are popular sectors for U.S. ETFs, allowing investors to select thematic ETFs based on interests and risk tolerance.
- U.S. ETF trading is flexible with low fees, and investors can access the U.S. market through various channels for convenient participation.
- Investing in U.S. ETFs requires attention to premiums, liquidity, exchange rate, and tax risks, with diversified investments and dynamic portfolio adjustments.
- Scientific risk management and strategy optimization help achieve stable long-term returns, and investors should maintain risk awareness and respond rationally to market changes.
New Trends and U.S. Stock Trading

Image Source: pexels
ETF Product Innovation
In 2025, the U.S. ETF market continues to drive product innovation to meet diverse investor needs. Several prominent institutions have launched representative innovative ETF products:
- Lazard launched its first actively managed ETF, covering trending themes, Japanese stocks, and next-generation technologies (e.g., hardware, automation, artificial intelligence), with actively managed products gradually entering the ETF space.
- Calamos introduced three Bitcoin-related structured products with downside protection levels of 0%, 10%, and 20%, featuring innovative risk control mechanisms to suit different risk appetites.
- Teucrium issued the first 2x leveraged XRP futures ETF, expanding digital currency derivatives and offering new options for high-risk investors.
- Praxis launched actively managed large-cap value and growth ETFs incorporating ESG factors, blending environmental, social, and governance themes with traditional investment strategies.
The product matrix continues to expand, with 2025 seeing the launch of the first low-altitude economy ETF, sci-tech innovation board AI ETF, and benchmark market-making credit bond ETF. Credit bond ETFs have raised over $3 billion (approximately RMB 21.6 billion at current exchange rates), with strong demand for cross-border ETFs. Data shows that 87.5% of individual investors aim to increase allocations to Hong Kong stocks and U.S. sector ETFs to expand global asset allocation.
Passive index products dominate the U.S. ETF market. In 2023, equity ETFs tracking broad-based indices accounted for 87% of the market, up 8 percentage points from 2013. Sector index ETFs (thematic ETFs) have seen a declining share. Over the past decade, actively managed equity funds experienced net outflows of $2.6 trillion, while index ETFs saw net inflows exceeding $1.9 trillion. Investors increasingly favor low-cost, high-liquidity passive index ETFs, while thematic ETFs cater to specific sector and theme demands.
| Metric | Value/Trend |
|---|---|
| 2023 Equity ETF Broad-Based Index Share | 87% (79% in 2013) |
| Sector Index ETF (Thematic ETF) Share | Declining trend |
| U.S. Passive Equity Fund Share | ~60% |
| U.S. Active Equity Fund Share | ~40% |
| U.S. ETF Assets by End of 2023 | $9.9 trillion |
| Number of U.S. ETF Products by End of 2023 | 3,478 |
| Active Equity Fund Net Outflows (Past Decade) | $2.6 trillion |
| Index ETF Net Inflows (Past Decade) | Over $1.9 trillion |
| U.S. ETF Market Concentration | Dominated by broad-based ETFs, with tech sector highest (26.83%) |
Sector Thematic Hotspots
In 2025, the U.S. ETF market exhibits distinct structural characteristics in sector themes. Technology, consumer, and healthcare and commodity ETFs are key investor focuses. The technology sector benefits from 5G adoption and AI breakthroughs, with related tech ETFs continuously attracting capital inflows. Large U.S. tech stocks maintain profit growth, driving tech ETFs as market hotspots. AI industry chain ETFs perform strongly, with large-scale model technologies fueling industrial revolutions and creating investment opportunities in computing power, communication infrastructure, and related equipment, becoming a key growth driver for tech ETFs.
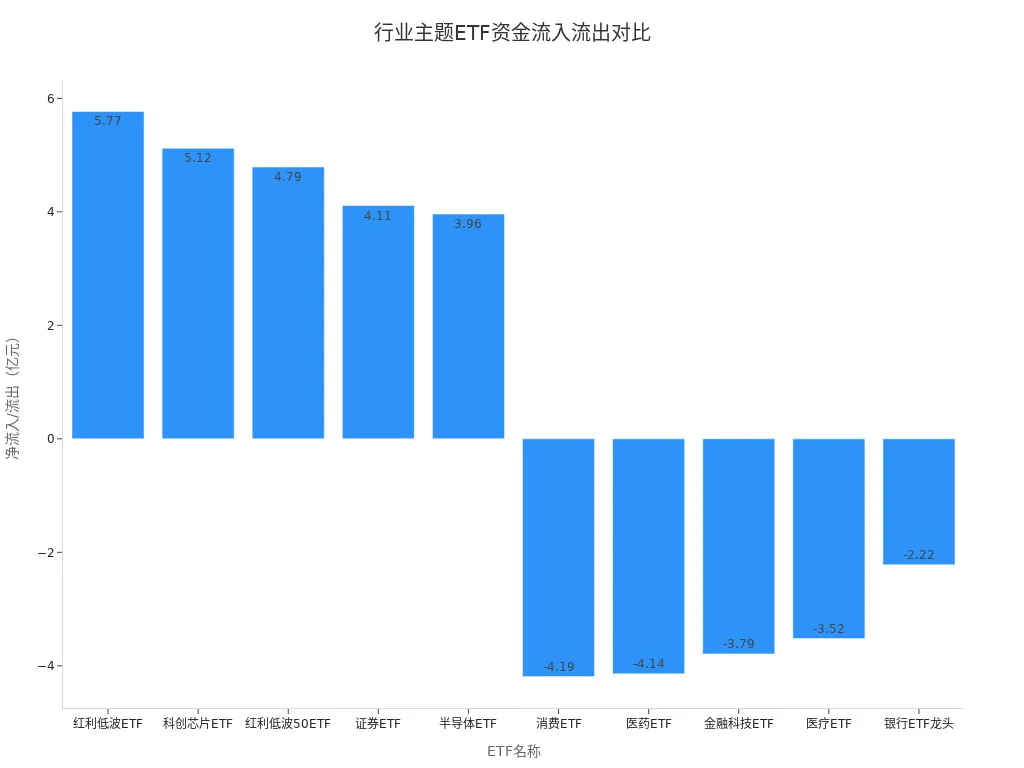
Consumer and healthcare ETFs show stable growth potential due to economic recovery and aging population trends. Gold ETFs remain active, with high net inflows, indicating strong investor interest in commodity ETFs. Capital flow data shows that tech-related ETFs (e.g., sci-tech chip ETFs, semiconductor ETFs) receive net inflows, reflecting growing market preference for tech growth and chip themes. Consumer and healthcare ETFs experience periodic outflows, indicating market structural differentiation and capital rotation.
| ETF Name | Net Inflow/Outflow ($B) | Representative Sector |
|---|---|---|
| Dividend Low Volatility ETF | +5.77 | Low Volatility Blue Chip |
| Sci-Tech Chip ETF | +5.12 | Tech Chips |
| Dividend Low Volatility 50 ETF | +4.79 | Low Volatility Select |
| Securities ETF | +4.11 | Financial Securities |
| Semiconductor ETF | +3.96 | Semiconductors |
| Consumer ETF | -4.19 | Consumer Sector |
| Healthcare ETF | -4.14 | Healthcare Sector |
| FinTech ETF | -3.79 | Financial Technology |
| Medical ETF | -3.52 | Healthcare |
| Leading Bank ETF | -2.22 | Banking |
In U.S. stock trading, investors often adopt a core-satellite strategy (broad-based ETFs as the core, sector/thematic ETFs for opportunities) and buy-hold-rebalance strategies to enhance portfolio stability and return management.
Policy and Regulation
The U.S. ETF market attracts global investors with low costs, high liquidity, and tax advantages. By early 2025, total U.S. ETF assets are expected to exceed $10.7 trillion, with 2023 net inflows reaching a historic high. Chinese investors can achieve diversified investments and capture high-growth opportunities through U.S. stock trading but must closely monitor risks from changes in U.S.-China regulatory policies.
Progress in U.S.-China audit supervision cooperation is expected to mitigate the risk of Chinese concept stocks being shorted, boosting their valuations and market confidence. Following positive signals from the State Council’s Financial Stability and Development Committee, Chinese concept stocks rebounded significantly in the U.S. market, with the Nasdaq Golden Dragon China Index rising nearly 33%, and multiple Chinese concept stocks gaining over 30%. Regulatory authorities are actively promoting U.S.-China audit supervision agreements, expected to further stabilize markets and reduce investment risks.
Investors should dynamically adjust portfolios based on risk tolerance, leveraging international market resources. The U.S. trading environment continues to improve, offering Chinese investors more diverse global asset allocation options.
Investment Advantages and Challenges
Risk Diversification and Low Costs
U.S. ETFs offer multiple investment advantages. First, ETFs cover stocks, bonds, commodities, and currencies, enabling investors to achieve asset diversification and effectively spread risk. Second, ETF management fees are generally lower than those of actively managed funds, with an average fee rate of just 0.20%, significantly reducing investment costs. ETF holdings are highly transparent, allowing investors to monitor portfolio structures anytime. The U.S. ETF market is vast, with total assets expected to exceed $10.7 trillion by early 2025, demonstrating strong market appeal. ETFs also offer tax advantages, with in-kind redemption mechanisms reducing capital gains taxes, further enhancing investment efficiency.
Since their inception in 1993, ETFs have become a key tool for global investors to allocate assets due to their high transparency, low costs, and flexible trading.
Trading Flexibility
ETFs offer flexible trading, allowing investors to trade in real-time on the secondary market like stocks. Compared to traditional mutual funds, ETF subscription and redemption processes are more convenient, with lower trading costs. U.S. trading platforms generally support T+0 trading, enabling investors to adjust strategies promptly based on market changes. The wide variety of ETF products, including broad-based index ETFs and thematic/sector ETFs, caters to different risk appetites and investment goals.
Capital and Channels
Chinese investors can participate in U.S. ETF investments through the following channels:
- Opening accounts through official online platforms of U.S. brokers, requiring identity and residency proof, after which investors can directly trade U.S. stocks.
- Purchasing certain U.S. stocks (e.g., Chinese concept stocks) through the Stock Connect mechanism, though the investment scope is limited.
- Investing in QDII funds to indirectly access U.S. ETFs without opening a U.S. account.
- Using overseas account services from securities firms, such as Futu Securities, Tiger Brokers, BBAE Securities, Zru Securities, and Longbridge Securities (Singapore channels), which support Chinese investors in opening accounts, particularly for emerging products like Bitcoin spot ETFs.
During cross-border investments, investors face challenges such as QDII quota restrictions, high compliance thresholds, and increased tax risks. Brokers must strictly adhere to regulatory requirements, reporting cross-border capital flows, facing significant compliance pressures. Future policies will dynamically adjust quota approvals and promote forex innovations, with cross-border capital flows and compliance environments continuing to evolve.
Sector Tracks and Representative ETFs
Technology and Innovation
Technology and innovation ETFs perform strongly in the U.S. market. Semiconductor, chip, and material-themed ETFs are the largest, with assets exceeding $100 billion (approximately RMB 720 billion at 1 USD = 7.2 RMB) in 2024, accounting for over half of the category. AI ETFs rank second with about $14.3 billion. Capital flows indicate sustained net inflows into AI, robotics, and fintech ETFs. Representative products include Nasdaq 100 ETF (QQQ), Vanguard Information Technology ETF (VGT), Technology Sector ETF (XLK), iShares U.S. Technology ETF (IYW), iShares Semiconductor ETF (SOXX), Global X Artificial Intelligence & Technology ETF (AIQ), Global X Robotics & Automation ETF (ROBO), and ARK Innovation ETF. These ETFs allow investors to capture technological innovation dividends, suitable for those seeking high growth and high volatility.
Consumer and Healthcare
Consumer-themed ETFs perform actively in the U.S. market. The S&P Consumer Select Sector ETF achieved a monthly return of 11.74% in May 2025, making it one of the top-performing ETFs that month. Capital flows show positive inflows into consumer-themed ETFs. Innovative drug ETFs have yielded over 30% this year, such as Huatai-PineBridge Hang Seng Innovative Drug ETF and Yinhua CSI Hong Kong Stock Connect Innovative Drug ETF. Healthcare ETFs, however, see net outflows, with investors adopting a cautious stance. Consumer and healthcare ETFs suit investors focused on economic cycles and demographic changes, balancing defense and growth.
Green Energy
Green energy ETFs focus on renewable energy, clean energy, and carbon neutrality themes. Investors can target subsectors like wind, solar, electric vehicles, and energy storage through green energy ETFs. These ETFs typically have high volatility, suitable for investors with a medium-to-long-term perspective and higher risk tolerance. Representative products include iShares Global Clean Energy ETF (ICLN) and Invesco Solar ETF (TAN). These ETFs are poised to benefit from global energy transitions and policy support.
China-Themed ETFs
China-themed ETFs offer opportunities to invest in China’s economic growth and structural transformation. ETFs like the Nasdaq Golden Dragon China Index ETF and Chinese Internet ETF cover key Chinese sectors such as technology, consumer, and healthcare. Investors can conveniently allocate to Chinese assets through the U.S. market, diversifying global investment risks. China-themed ETFs suit investors optimistic about China’s long-term growth and eager to participate in its new economy.
U.S. Stock Trading Risks
Image Source: pexels
Premiums and Liquidity
Premium and liquidity risks are prominent in U.S. ETF investments. Some cross-border QDII ETFs, due to quota restrictions, see secondary market prices significantly exceed net asset values. For instance, in January 2024, the E Fund MSCI USA 50 ETF had a premium rate as high as 40%, with the USA 50 ETF (QDII) issuing multiple premium risk warnings, reaching over 32% and triggering temporary suspensions. Huaxia Nomura Nikkei 225 ETF (QDII) and ICBC Credit Suisse Daiwa Nikkei 225 ETF (QDII) were also suspended due to premium rates nearing 8% and 6%. Premium risks stem from tight QDII quotas, limited off-exchange subscriptions, and ineffective arbitrage mechanisms. Liquidity risks are also noteworthy, with the Invesco Great Wall Nasdaq Technology Market Cap Weighted ETF (QDII) having an off-exchange net subscription cap of only 9 million units on March 14, far below on-exchange daily trading volumes. Large-cap U.S. ETFs like SPY and QQQ have ample liquidity, with risks primarily concentrated in cross-border ETF products.
Tracking Error
ETF tracking error refers to the difference between a fund’s actual returns and its tracked index. Common causes include management fees, trading costs, cash holdings, timing differences in constituent stock transactions, liquidity shortages, currency hedging costs, and regulatory limits on holdings. Commodity futures ETFs may also incur errors due to contract rollover costs. Leveraged and inverse ETFs amplify errors due to daily rebalancing. Tracking errors can cause ETFs to underperform their indices, particularly in high-fee, low-liquidity, or frequent-rebalancing environments. Large-scale, high-liquidity U.S. ETFs typically have lower tracking errors, requiring less concern, but investors should remain vigilant with cross-border and thematic ETFs.
Exchange Rate and Taxation
For Chinese investors, exchange rate fluctuations significantly impact final returns. Investors convert RMB to USD (e.g., 1 USD = 7.2 RMB) to purchase U.S. ETFs. If the USD depreciates against the RMB, repatriating funds may result in exchange losses. Even if an ETF’s USD price rises, RMB-denominated returns may decrease or turn negative. For example, an investor buys an ETF at a 10:1 exchange rate, the ETF rises 100%, but if the exchange rate drops to 5:1, the final return is zero. Global central bank policy changes exacerbate exchange rate volatility, further affecting ETF returns.
Tax risks are also significant. The U.S. imposes a 30% withholding tax on dividends for non-resident aliens, reducible to 10% or 15% by filing Form W-8BEN. Capital gains are generally tax-exempt but subject to specific conditions. Bond ETF interest distributions and REIT income involve more complex tax treatments. Broker withholding mechanisms pose risks, and investors must regularly review tax statements to avoid additional taxes or penalties. U.S. estate taxes have low thresholds, requiring early planning to avoid high estate taxes. High-net-worth investors, high-frequency traders, and those failing to declare dividends are key regulatory targets, needing to proactively separate dividend and capital gains declarations to mitigate tax compliance risks.
Practical Recommendations
Account Opening and Platforms
When selecting a U.S. ETF trading platform, investors should focus on broker compliance, fee structures, and service quality. The table below compares common brokers:
| Broker Type | Broker Name | Advantages | Disadvantages | Suitable Investor Type |
|---|---|---|---|---|
| Domestic Broker | Huatai Securities | Low trading commissions, robust systems, quality service | Limited U.S. stock variety, platform stability | Investors seeking low commissions and service |
| Domestic Broker | CITIC Securities | Convenient fund transfers, strong capital | Higher commissions | Experienced investors seeking variety |
| Domestic Broker | China Merchants Securities | Transparent commissions, stable platform | Limited customer service and resources | Investors needing stable platforms |
| Foreign Broker | Futu Securities | Zero commissions, stable platform, rich resources | Slower fund transfers | Beginners and general investors |
| Foreign Broker | Tiger Brokers | Low commissions, diverse products, timely service | Platform stability issues during peak times | New and multi-product traders |
| Foreign Broker | Interactive Brokers | Low fees, diverse products, professional platform | Complex operations, not beginner-friendly | Experienced, frequent traders |
The account opening process generally includes: selecting a suitable broker, preparing identity and address proof, completing the application, converting RMB to USD (e.g., 1 USD = 7.2 RMB), and transferring funds to the account. Investors should thoroughly understand each platform’s opening policies and trading rules to ensure compliance.
Capital Management
Capital management is a core component of U.S. ETF investing. Investors should adopt diversified allocation strategies, distributing funds across different asset classes and factor products. Multi-factor strategies help spread risk and achieve stable returns. Some investors dynamically adjust capital flows based on market conditions, such as increasing allocations to growth factor ETFs during net inflows. Regular portfolio evaluations and flexible position adjustments are recommended to reduce risks from single-market fluctuations.
Professional investors prioritize risk control, favoring diversified allocations and multi-factor portfolios to pursue stable long-term growth.
Tax Compliance
Chinese tax residents must declare overseas income from U.S. ETF investments between March 1 and June 30 of the following year. Tax authorities may remind taxpayers via phone or SMS, with non-declarers facing additional taxes and penalties. The U.S. and China exchange financial account information through FATCA, enforcing strict compliance. Investors should review bilateral tax treaties and related benefits, consulting local tax authorities when needed to ensure compliance.
Information Access
Investors can access U.S. ETF information through various channels. Sina Finance’s “Clues” column, Morningstar, and Bloomberg provide ETF screeners, product guides, and market data. Major broker platforms like Longbridge Securities, Tiger Brokers, and Interactive Brokers offer websites, research reports, and product introductions to help investors understand ETF products and market dynamics. These tools enhance decision-making efficiency for U.S. stock trading.
Strategy Adjustments and Risk Management
Strategy Optimization
Dynamic portfolio adjustments have become mainstream in U.S. ETF investing. Risk control index strategies allow investors to flexibly adjust stock and cash positions, managing volatility and reducing the impact of sharp market fluctuations on long-term returns. For example, the S&P Risk Control Index family covers 5%-20% target volatility levels, supporting daily and monthly rebalancing, with lower volatility and higher Sharpe ratios than the S&P 500. Related ETF products are mature, with stock weights typically over 90%, covering mainstream markets like the S&P 500. Data shows 10%-15% target volatility risk control indices yield annualized returns of 6%-9%, with significantly reduced volatility and low monthly rebalancing costs, offering practical productization advantages. Investors also commonly use a barbell strategy, allocating funds to tech ETFs and dividend low-volatility ETFs for risk diversification. At quarter-end, some rebalance based on market performance, such as taking profits from tech stocks rising over 30% and shifting to dividend ETFs to optimize return structures. Dollar-cost averaging smooths market volatility, and combining stop-loss and diversified strategies enhances risk management.
Risk Awareness
U.S. ETF investing requires strong risk awareness. Investors should regularly monitor ETF performance, dynamically adjust allocations, and replace underperforming ETFs promptly. Stop-loss mechanisms are critical risk management tools. Many investors set stop-loss thresholds, selling or switching to high-dividend assets when a single ETF’s floating loss exceeds 10% to limit losses.
Investors should develop scientific risk management strategies, including setting stop-loss points and diversifying investments, with a long-term perspective to avoid impulsive decisions due to short-term market fluctuations. Additionally, investors must closely monitor market and policy changes, adjusting strategies promptly. The U.S. market and regulatory environment are constantly evolving, and rational decisions help mitigate systemic risks and protect capital. Through scientific asset allocation and risk control, investors can effectively address price correction risks and achieve stable long-term returns.
In 2025, U.S. ETF investments showcase diverse innovations. Chinese investors should monitor market volatility and policy changes, allocating assets wisely across technology, finance, and other sectors. Experts recommend leveraged allocations to growth and value styles, combining dollar-cost averaging and swing trading to diversify risks. Flexible portfolio adjustments and focus on AI, biopharmaceuticals, and other future industries can help seize new global asset allocation opportunities.
Investors must maintain risk awareness, dynamically optimize strategies, and respond rationally to market changes to achieve stable long-term returns.
FAQ
How much starting capital is needed for U.S. ETF investments?
Investors can participate with low capital. Some platforms support purchases starting at 1 share. For example, 1 share of SPY requires approximately $500 (about RMB 3,600 at 1 USD = 7.2 RMB).
How can Chinese investors transfer funds to U.S. broker accounts?
Investors can transfer USD through Hong Kong banks or third-party payment institutions to U.S. broker accounts. Some brokers supportraspberrypi support RMB-to-USD conversion at real-time market rates.
How are U.S. ETF dividends taxed?
The U.S. imposes a 10%-30% withholding tax on dividends for non-resident investors. Filing Form W-8BEN may reduce this to 10% or 15%. Brokers typically withhold automatically, and investors should review tax statements regularly.
What are the main risks of investing in U.S. ETFs?
Investors face risks such as exchange rate fluctuations, liquidity shortages, tracking errors, and tax compliance. High-volatility and leveraged ETFs carry greater risks, requiring cautious selection.
Which popular U.S. ETFs can Chinese investors choose?
Investors can select ETFs like Nasdaq 100 ETF (QQQ), S&P 500 ETF (SPY), and iShares Global Clean Energy ETF (ICLN). Some platforms also offer AI and semiconductor-themed ETFs.
This article provides a detailed analysis of the 2025 trends in U.S. stock ETF investing, offering comprehensive guidance from innovative products to risk management. However, when embarking on their U.S. stock investment journey, many investors find the primary challenge isn’t selecting a stock, but rather how to efficiently and compliantly transfer funds into a trading account. Traditional cross-border remittance processes are cumbersome and often require you to first open an overseas bank account, which undoubtedly adds significant hurdles to your global asset allocation.
Now, you don’t have to worry about this anymore. BiyaPay is built for global investors, offering a one-stop, barrier-free investment channel. Our platform allows you to participate in both the U.S. stock and Hong Kong stock markets without the need for a complex overseas account. With remittance fees as low as 0.5% and a fast, same-day delivery service, we can help you save significantly on transaction costs and time. Additionally, you can use our real-time exchange rate query feature to stay on top of market movements at any time. Make your path to global investing more convenient and efficient. Register with BiyaPay today.
*This article is provided for general information purposes and does not constitute legal, tax or other professional advice from BiyaPay or its subsidiaries and its affiliates, and it is not intended as a substitute for obtaining advice from a financial advisor or any other professional.
We make no representations, warranties or warranties, express or implied, as to the accuracy, completeness or timeliness of the contents of this publication.


Contact Us
Company and Team
BiyaPay Products
Customer Services


is a broker-dealer registered with the U.S. Securities and Exchange Commission (SEC) (No.: 802-127417), member of the Financial Industry Regulatory Authority (FINRA) (CRD: 325027), member of the Securities Investor Protection Corporation (SIPC), and regulated by FINRA and SEC.
registered with the US Financial Crimes Enforcement Network (FinCEN), as a Money Services Business (MSB), registration number: 31000218637349, and regulated by FinCEN.
registered as Financial Service Provider (FSP number: FSP1007221) in New Zealand, and is a member of the Financial Dispute Resolution Scheme, a New Zealand independent dispute resolution service provider.