- EasyCard
- Trade
- Help
- Announcement
- Academy
- SWIFT Code
- Iban Number
- Referral
- Customer Service
- Blog
- Creator
How Chinese Investors Can Efficiently Select Quality Hong Kong Stocks


Image Source: pexels
In the Hong Kong stock market, you often face issues like insufficient liquidity, inefficient delisting mechanisms, and concentrated industry distribution, making it more challenging to select quality stocks. The Hang Seng Index and Hang Seng Tech Index have performed strongly in recent years, with technology, consumer, and leading stock sectors having low valuations, attracting significant capital inflows. You can define your investment goals, combine index screening, fundamental and technical analysis, and leverage authoritative tools to improve stock selection efficiency.
Key Points
- Quality Hong Kong stocks typically have strong financial health, ample cash flow, and stable dividends, enabling them to withstand market volatility.
- Selecting industry leaders and high-growth companies helps achieve more stable and sustained investment returns.
- Combining fundamental and technical analysis with authoritative tools and index screening improves stock selection efficiency and accuracy.
- Diversified investments and periodic reviews effectively reduce risks, helping you navigate market volatility and unexpected events.
- Beware of speculative themes and high-risk stocks, focus on annual and quarterly reports, and manage risks scientifically to protect asset safety.
Characteristics of Quality Hong Kong Stocks
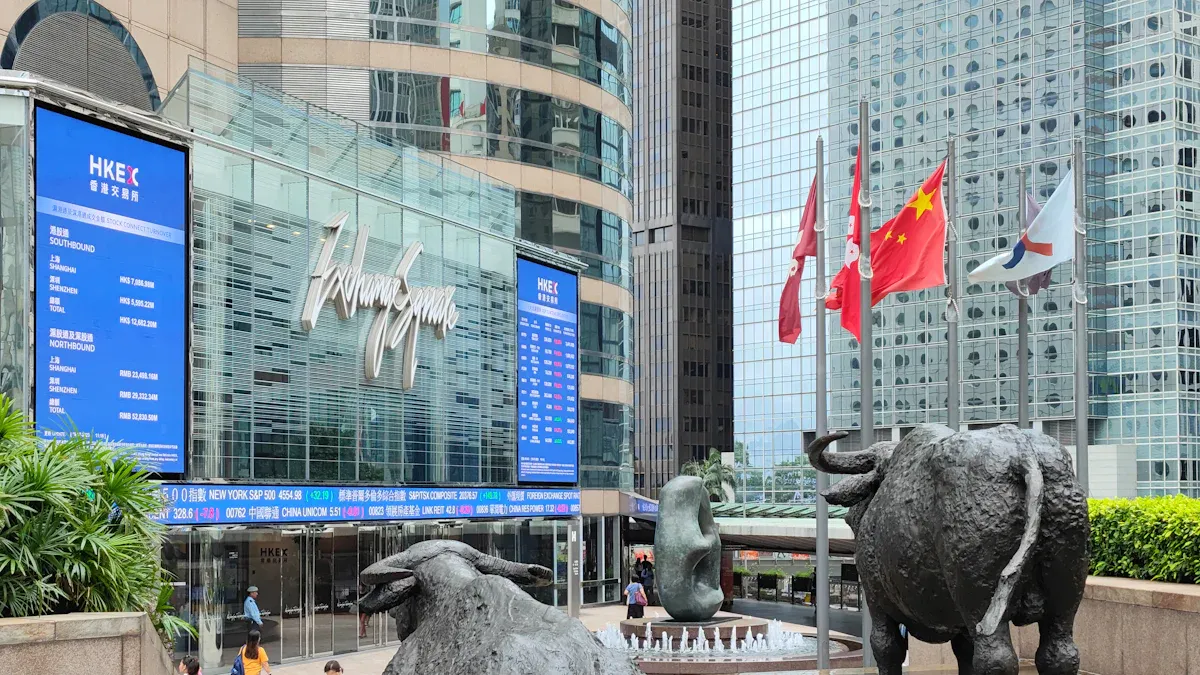
Image Source: unsplash
Financial Health
When selecting quality Hong Kong stocks, you should first focus on a company’s financial health. Free cash flow is a key indicator of financial condition. Companies with strong free cash flow typically have greater profitability and risk resilience. You can assess this through the following aspects:
- Ample free cash flow indicates a company’s ability to handle market volatility.
- Abundant cash reserves, especially for Hong Kong companies that raised funds through IPOs in 2020 and 2021, enhance safety.
- Companies willing to pay dividends reflect good financial health and investment value.
- In volatile markets, outstanding free cash flow performance yields higher long-term returns than other stock types.
- The ESG rating system is also worth your attention, evaluating companies’ sustainability and governance health from environmental, social, and governance perspectives.
Industry Position
Quality Hong Kong stocks are often industry leaders. These companies have large market capitalizations and high market shares. For example, Goldman Sachs’ top ten Chinese giants have a total market capitalization of about 1.6 trillion USD (approximately 11.7 trillion HKD, calculated at 1 USD = 7.3 HKD), holding significant positions in the Hong Kong market. Choosing industry leaders allows you to gain higher market attention and stronger price discovery capabilities.
Industry-leading companies typically have stable market positions and strong competitiveness, making them hard to replace in the short term.
Growth Potential
You also need to focus on a company’s growth potential. Quality Hong Kong stocks typically have high annual compound growth rates for revenue and net profit. The table below shows growth data for some companies:
| Company Name | Time Range | Revenue CAGR | Net Profit CAGR |
|---|---|---|---|
| Rongda Technology | 2023-2024 | ~0.4% | ~49.6% |
| MetaLight | 2022-2024 | ~24.5% | ~111.5% |
| Horizon Robotics | 2024-2027 Forecast | 52.2% | N/A |
You can see that growth rates vary significantly across industries and companies, but quality Hong Kong stocks generally have annual compound growth rates of 8%-50%.
Liquidity
Liquidity is another key criterion when screening quality Hong Kong stocks. Stocks with good liquidity typically have daily trading volumes reaching hundreds of billions of HKD. For example, in early October 2024, during a period of strong liquidity in the Hong Kong market, daily trading volume was about 42 billion USD (calculated at 1 USD = 7.3 HKD). High-liquidity stocks are easier to buy and sell, with more stable price movements.
Dividends and Valuation
When selecting quality Hong Kong stocks, you should also focus on dividend yields and valuations. Quality Hong Kong companies have a dividend yield of about 6.91%, at a historical high, with a P/E ratio of about 5.61 and a P/B ratio of about 0.52, indicating reasonable valuations. High dividends and low valuations mean you can achieve more stable returns with lower risks.
Screening Process

Image Source: pexels
Define Investment Goals
When screening quality Hong Kong stocks, you should first clarify your investment goals. Different goals influence your stock selection direction and strategy. You can follow these steps to refine your investment goals:
- Select industries to focus on, such as technology, healthcare, or consumer sectors, which typically offer strong growth and competitive advantages.
- Track companies’ revenue growth, market share, and technological innovation to select those with core competitiveness.
- Use technical analysis tools like moving averages, Relative Strength Index (RSI), Bollinger Bands, and KDJ indicators to assist in timing buy and sell decisions.
- Adopt a diversified investment strategy to build a diversified portfolio, reducing risks from single industries or stocks.
- Commit to long-term investing, patiently holding quality Hong Kong stocks with strong fundamentals and growth potential.
- Set clear risk tolerance levels, adjusting investment strategies and asset allocations based on personal risk preferences.
- Combine fundamental and technical analysis to comprehensively evaluate stock value and market trends.
- Monitor macroeconomic conditions and market sentiment to assist in judging investment timing and risks.
- Implement risk management measures, such as setting stop-loss points and periodically adjusting portfolios, to protect capital safety.
You can opt for value investing, focusing on undervalued stocks using P/B and P/E ratios to screen reasonably priced stocks, or growth investing, targeting companies with above-average profit growth for capital appreciation.
Risk Tolerance Assessment
You need to understand your risk tolerance. Risk tolerance determines how much volatility and loss you can bear. You can assess yourself through the following aspects:
- Age and income: Younger investors typically tolerate higher risks, and stable income enhances risk tolerance.
- Investment experience: Experienced investors handle market volatility better.
- Investment horizon: Long-term investors can endure short-term fluctuations for long-term gains.
- Psychological resilience: Ask yourself if you can stay rational during short-term losses.
You can select an investment portfolio suited to your situation. If you have low risk tolerance, allocate more to high-dividend, low-volatility blue-chip stocks. If you have higher risk tolerance, you can increase the proportion of growth stocks.
Index and Sector Screening
You can use indices and sectors for preliminary screening. The Hang Seng Index and Hang Seng Tech Index are the most representative indices in the Hong Kong market. The Hang Seng Index covers leading companies, while the Hang Seng Tech Index focuses on technology. You can also screen stock pools based on differences between the Main Board and Growth Enterprise Market.
- Hang Seng Index (HSI): Includes the 50 largest and most liquid companies in Hong Kong, suitable for investors seeking stable returns.
- Hang Seng Tech Index (HSTECH): Focuses on innovative tech companies, ideal for growth-focused investors.
- Main Board: Larger companies with standardized disclosures and good liquidity.
- Growth Enterprise Market: More emerging industries and innovative companies with high growth potential but greater volatility.
You can start by screening stocks from these index constituents that align with your investment goals, then further refine based on industry sectors.
Fundamental Analysis
When conducting fundamental analysis, you need to focus on a company’s financial and operational metrics. The table below summarizes commonly used metrics and their significance:
| Metric Category | Specific Metric | Description |
|---|---|---|
| Financial Metrics | Revenue Growth Rate | Reflects the growth rate of core business revenue, measuring company growth potential |
| Financial Metrics | Core Business Profit Growth Rate | Measures profit growth from core operations, reflecting profitability improvement |
| Financial Metrics | Net Profit Growth Rate | Reflects overall profitability growth trends |
| Financial Metrics | Return on Equity (ROE) | Measures shareholder equity returns, reflecting capital efficiency |
| Financial Metrics | Gross Margin | Reflects profitability after deducting costs from sales revenue |
| Valuation Metrics | Price-to-Earnings Ratio (P/E) | Measures stock price relative to earnings per share, reflecting valuation levels |
| Valuation Metrics | Price-to-Earnings Growth Ratio (PEG) | Considers P/E and profit growth, assessing valuation reasonableness |
| Valuation Metrics | Price-to-Book Ratio (P/B) | Stock price relative to net assets per share, reflecting asset value assessment |
| Valuation Metrics | Enterprise Value/EBIT (EV/EBIT) | Reflects the relationship between enterprise value and profitability |
| Valuation Metrics | Enterprise Value/EBITDA (EV/EBITDA) | Measures enterprise value relative to operating cash flow, reflecting profit quality |
| Operational Metrics | Corporate Governance Structure | Includes management capability and governance standards, impacting long-term development |
| Operational Metrics | Core Competitiveness | Technology, brand, cost advantages, determining market position and sustained profitability |
| Operational Metrics | R&D Investment and Growth Rate | Reflects innovation capability and future growth potential |
| Operational Metrics | Market Share | Reflects competitive position in the industry |
| Operational Metrics | Financial Stability | Includes cash flow status, ensuring operational safety |
You can combine a “bottom-up” approach to individual stock research with macroeconomic and industry analysis to comprehensively evaluate the fundamentals of quality Hong Kong stocks.
Technical Analysis
You can use technical analysis tools to assist in timing buy and sell decisions. Commonly used technical analysis methods include:
- Moving Average System: Uses moving averages of different periods to identify price trends and buy/sell signals.
- Momentum Indicators: Such as MACD, KD, and STC indicators to assess price momentum and trends.
- Support and Resistance Analysis: Identifies key price levels to gauge buying and selling pressure.
- Volume Analysis: Combines volume changes to assess trend strength.
- Fibonacci Retracement Lines: Predicts price pullbacks and rebounds.
- Chip Distribution: Analyzes holding cost distribution to assist in identifying support and resistance.
- Trend Lines: Identifies price trend directions and turning points.
- Moving Average Crossover Signals: Uses moving average crossovers to determine buy/sell timing.
Technical analysis helps you better grasp market rhythms and enhance the accuracy of trading decisions.
Tools and Platform Applications
In practice, you can leverage various authoritative platforms and tools to improve screening efficiency. Common platforms include AA Stocks, Yahoo Finance, and Xueqiu. These platforms provide real-time market data, financial information, industry analysis, and investor communities.
- AA Stocks: Offers real-time Hong Kong stock data, technical analysis tools, and stock screeners, suitable for beginners and advanced investors.
- Yahoo Finance: Supports multi-market data queries with rich financial statements and historical data for fundamental and technical analysis.
- Xueqiu: Aggregates investor insights and practical experience, helping you stay updated on market trends and strategies.
You can also use quantitative strategies and stock pool systems to enhance selection efficiency. For example, building quantitative strategies based on ROE’s seven criteria can theoretically generate 2,187 stock selection strategies. Historical backtesting can identify high-performing strategies with win rates of 79%-83% and average excess returns of about 3%-4%. You can choose offensive or defensive strategies based on market conditions, flexibly adjusting portfolios. If you accurately predict bull or bear markets, historical data shows net value growth up to 39.5 times, far exceeding market averages.
You can combine quantitative strategies and stock pool systems to batch-screen quality Hong Kong stocks, balancing operability and risk diversification to improve overall investment success rates.
Investment Recommendations
Diversified Investing
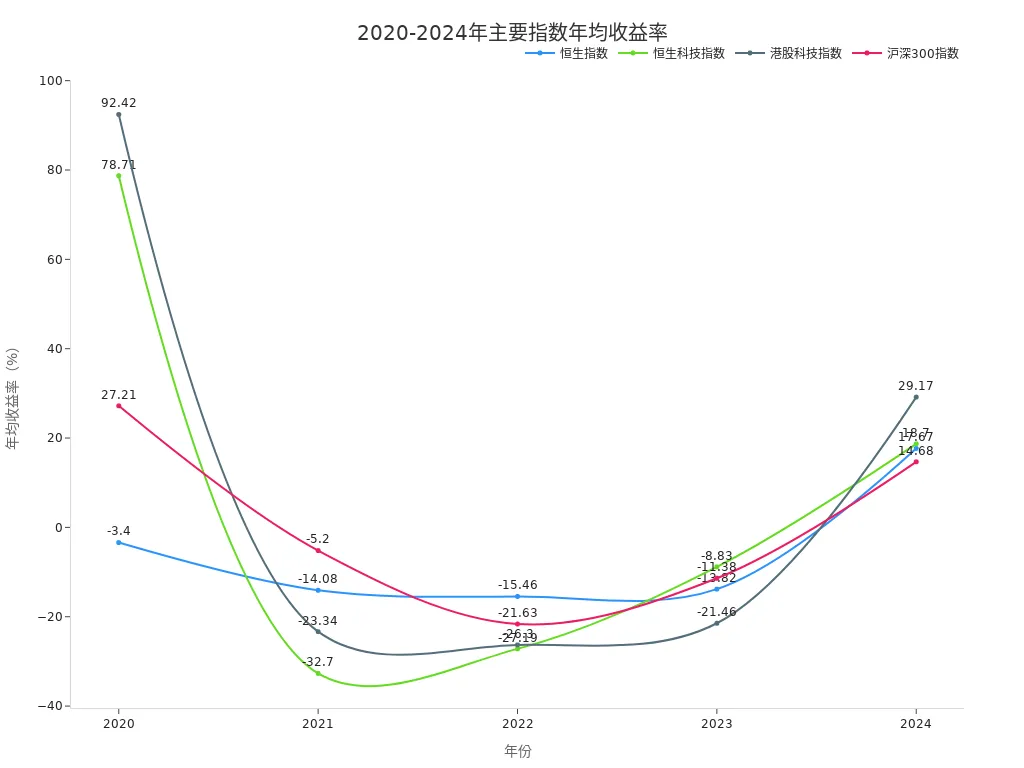
When investing in the Hong Kong stock market, diversified investing is an effective way to reduce risks. By allocating to quality stocks in different sectors, such as consumer, financial, and technology leaders, you can minimize losses from single stock volatility. You can also choose index funds like the Hang Seng Index or Hang Seng Tech Index. These funds cover multiple industries and companies, effectively diversifying risks. Data shows that from 2024 to 2025, the Hang Seng Tech Index rose 73.31%, and the Hang Seng Index rose 42.58%, significantly outperforming the CSI 300 Index. Long-term, Hong Kong index funds enhance portfolio stability through diversified allocations.
| Index Name | 2024-2025 Return (%) | Annualized Return 2020-2024 (%) |
|---|---|---|
| Hang Seng Index | 42.58 | -3.40, -14.08, -15.46, -13.82, 17.67 |
| Hang Seng Tech Index | 73.31 | 78.71, -32.70, -27.19, -8.83, 18.70 |
| Hong Kong Tech Index | 92.52 | 92.42, -23.34, -26.30, -21.46, 29.17 |
| CSI 300 Index | 19.37 | 27.21, -5.20, -21.63, -11.38, 14.68 |
You can easily participate in broad-based Hong Kong index investing through ETFs, enjoying the risk diversification benefits of professional management.
Periodic Reviews
You need to periodically review your investment portfolio. Check your holdings every quarter or half-year, analyzing changes in the fundamentals and market performance of quality Hong Kong stocks. This allows you to identify issues promptly, adjust strategies, and avoid losses due to market changes.
Monitor Policy Risks
The Hong Kong stock market is heavily influenced by policies and macroeconomic events. You should closely monitor factors like U.S.-China trade tensions and regulatory policy changes. Historical data shows that policy changes can amplify market volatility, affecting returns. You can use multi-factor strategies and hedging tools to reduce drawdowns from policy risks.
Avoid High Leverage
When investing in Hong Kong stocks, avoid high-leverage operations. While high leverage can amplify returns, it also magnifies losses. The Hong Kong market’s lack of liquidity and absence of price limits can lead to extreme volatility. You should reasonably control positions to protect capital safety.
Tailor to Your Situation
When formulating investment strategies, you should consider your circumstances. You need to understand the Hong Kong market’s trading rules, regulatory systems, and trading hours. You should also monitor exchange rate fluctuations, trading costs, and information asymmetry risks. Based on your risk tolerance and investment goals, select suitable quality Hong Kong stocks and investment methods.
Guide to Avoiding Pitfalls in Quality Hong Kong Stocks
Beware of Speculative Themes
When selecting Hong Kong stocks, you often encounter “concept stock” hype. Many companies leverage popular themes to attract investors, but their actual performance and growth may not be strong. You should distinguish between companies hyping concepts and those with true core competitiveness. Quality Hong Kong stocks typically have stable financial performance and clear business models, not relying on short-term trends. You can focus more on a company’s core revenue and net profit growth to avoid being swayed by market sentiment.
Focus on Annual and Quarterly Reports
When analyzing Hong Kong stocks, annual and quarterly reports are key tools for understanding a company’s true operating condition. Annual reports include complete financial statements, audit reports, and operational analysis, with audited data offering high reliability. You can focus on the following:
- Financial statements and management discussion and analysis sections, reviewing core metrics like net profit attributable to shareholders, revenue, R&D expenses, and debt-to-asset ratios.
- Combine audit opinions and non-recurring profit/loss adjustments to assess profitability.
- Quarterly reports are concise, suitable for short-term performance tracking, but less reliable as they are unaudited.
- Cross-verify data from multiple channels and monitor major litigation disclosures to enhance judgment accuracy.
- Through annual report analysis, you may find that some companies’ net profit growth stems from non-recurring items, indicating no improvement in actual operations, helping you avoid investment risks.
You should leverage annual and quarterly reports, combined with third-party platform data, to comprehensively assess a company’s true operating condition.
Identify High-Risk Sectors
The Hong Kong stock market includes high-risk sectors. You need to beware of “penny stocks” and “zombie stocks” with small market caps and high turnover rates. These stocks are highly volatile, resembling gambling, and can lead to significant losses. Since 2018, the HKEX has strengthened delisting rules, with Main Board stocks suspended for 18 months and Growth Enterprise Market stocks for 12 months facing mandatory delisting. You can filter out high-risk stocks by observing turnover and liquidity. Data shows that from 2009 to 2019, Hong Kong’s stable return portfolio had an annualized volatility of about 18.1%, with a maximum drawdown of 37.6%, lower than A-shares, but high-risk sectors still pose significant risks. You should also beware of high-dividend traps, as some high-dividend stocks in energy, Hong Kong banks, and utilities require fundamental analysis to identify true quality stocks.
Mitigate Black Swan Events
During investing, you will inevitably encounter unexpected black swan events. Historically, the Hong Kong market has faced multiple major shocks:
- The 2003 SARS outbreak in China caused significant declines in Hong Kong stocks.
- The 2008 global financial crisis led to multiple single-day drops in the Hang Seng Index exceeding 4%.
- The 2015 A-share market crash caused sharp declines in Hong Kong’s heavyweight stocks.
- The 2016 Brexit referendum led to significant drops in related stocks.
- The 2018 U.S.-China trade tensions and U.S. sanctions on ZTE caused sharp stock price fluctuations.
You should also monitor company-level black swan events, such as executive changes, major litigation, or quality/safety incidents, which can cause short-term price volatility. You can reduce the impact of black swan events through diversified investing and periodic reviews, enhancing investment safety.
In Hong Kong stock investing, rational analysis and risk management are critical. The table below shows that after implementing full-process risk control, maximum drawdown dropped from 9.68% to 4.90%, with the return-to-drawdown ratio rising to 3.37, indicating that scientific risk management effectively protects your asset safety.
| Portfolio Type | Annualized Excess Return | Maximum Drawdown | Return-to-Drawdown Ratio |
|---|---|---|---|
| Traditional Multi-Factor Model | 18.77% | 9.68% | 1.94 |
| Risk Control Model | 16.51% | 4.90% | 3.37 |
You should flexibly adjust strategies based on your goals and risk preferences. Many successful investors achieve long-term returns through continuous learning and dynamic adjustments, adapting to market changes. You can adopt these practices to steadily improve investment success rates.
FAQ
How to determine if a Hong Kong stock’s valuation is reasonable?
You can check metrics like P/E and P/B ratios. A P/E below 10 is generally considered cheap. You can also compare with peers in the same sector and assess valuation levels based on profit growth.
What trading rules should you note for Hong Kong stock investments?
You need to understand that Hong Kong stocks have no price limits. Trading hours are 9:30-12:00 and 13:00-16:00 Beijing time. You should also monitor the USD/HKD exchange rate (1 USD ≈ 7.3 HKD).
What are the main risks in Hong Kong stock investing?
You will face risks like exchange rate fluctuations, insufficient liquidity, and policy changes. You can mitigate these through diversified investing and periodic reviews.
How can beginners quickly screen quality Hong Kong stocks?
You can start with Hang Seng Index constituents. Use platforms like AA Stocks and Yahoo Finance to check financial data. You can also screen initially based on dividend yields and growth metrics.
How are Hong Kong stock dividend returns calculated?
You can use the table below for quick reference:
| Item | Description |
|---|---|
| Dividend Yield | Dividend per share / Price per share |
| Settlement Currency | Mostly in HKD, converted to USD |
| Reference Exchange Rate | 1 USD ≈ 7.3 HKD |
This article provides a comprehensive guide for Chinese investors on how to efficiently identify high-quality stocks in the Hong Kong market. The article delves into three core dimensions: identifying characteristics of quality Hong Kong stocks, building a scientific screening process, and avoiding common investment risks. High-quality Hong Kong stocks typically possess traits such as financial health, leading industry positions, high growth, and strong liquidity. Investors can improve their stock-picking efficiency and security by combining fundamental and technical analysis, utilizing authoritative tools, and adopting a diversified investment strategy. The article also emphasizes the importance of paying attention to financial reports, being wary of speculative concepts, and managing policy and market risks, all aimed at helping investors make wiser decisions in the complex Hong Kong stock environment.
However, despite the detailed content of the article, a core challenge for many Chinese investors remains: the flow of cross-border funds. Traditional funding methods, such as international bank wire transfers, are not only complex and time-consuming but also come with high fees and opaque exchange rate spreads. These issues can directly impact investment returns and increase transaction costs.
BiyaPay was created to solve these cross-border financial pain points. We offer a smoother, more cost-effective channel for your investments. We support the conversion between various fiat and digital currencies, allowing you to easily manage global assets, and provide a real-time exchange rate query feature to ensure you always get the best rates. What’s more, our remittance fees are as low as 0.5% with same-day delivery, significantly cutting down your transaction costs and time. Now, you don’t need a complex overseas account to invest in both U.S. and Hong Kong stocks on one platform. Say goodbye to the hassle of cross-border payments and start your efficient financial journey. Register with BiyaPay today to make fund management as smooth as trading.
*This article is provided for general information purposes and does not constitute legal, tax or other professional advice from BiyaPay or its subsidiaries and its affiliates, and it is not intended as a substitute for obtaining advice from a financial advisor or any other professional.
We make no representations, warranties or warranties, express or implied, as to the accuracy, completeness or timeliness of the contents of this publication.


Contact Us
Company and Team
BiyaPay Products
Customer Services


is a broker-dealer registered with the U.S. Securities and Exchange Commission (SEC) (No.: 802-127417), member of the Financial Industry Regulatory Authority (FINRA) (CRD: 325027), member of the Securities Investor Protection Corporation (SIPC), and regulated by FINRA and SEC.
registered with the US Financial Crimes Enforcement Network (FinCEN), as a Money Services Business (MSB), registration number: 31000218637349, and regulated by FinCEN.
registered as Financial Service Provider (FSP number: FSP1007221) in New Zealand, and is a member of the Financial Dispute Resolution Scheme, a New Zealand independent dispute resolution service provider.