- EasyCard
- Trade
- Help
- Announcement
- Academy
- SWIFT Code
- Iban Number
- Referral
- Customer Service
- Blog
- Creator
NVDU Stock Performance in 2025 and What Investors Should Know


Image Source: pexels
NVDU stock enters 2025 with renewed momentum. Recent data shows the stock rebounded over 28% year-to-date by July 10, 2025, after a sharp 19% drop in Q1 due to concerns about AI spending and U.S. export restrictions to China. The following table summarizes key performance figures:
| Metric | Value |
|---|---|
| One-Year Price Change | +24.90% |
| Year-to-Date Price Change | +28% |
| Q1 2025 Price Change | -19% |
| Stock Closing Price (July 10) | $164.10 |
| Outperformance vs. S&P 500 | +12.29 pts |
Investors now see institutional confidence growing as major funds increase their NVDU stock holdings. Understanding both the opportunities and the risks remains crucial for any investment decision in this volatile market.
Key Takeaways
- Nvidia’s stock showed strong recovery in 2025, rising over 28% year-to-date despite early volatility and trade tensions with China.
- Demand for AI hardware and data center solutions drives Nvidia’s revenue growth, with new markets like autonomous vehicles adding future potential.
- Analysts mostly recommend buying Nvidia stock, but some warn about valuation risks and market volatility, so investors should consider their risk tolerance.
- Geopolitical issues, especially U.S.-China trade policies, create uncertainty and could impact Nvidia’s profits and stock price.
- Investors should track key financial metrics like earnings, revenue growth, and data center sales, along with regulatory news and analyst updates to make informed decisions.
2025 Outlook for NVDU Stock

Image Source: pexels
Market Performance
NVDU stock entered 2025 with strong momentum but faced notable volatility. The stock declined nearly 20% early in the year, mirroring the broader semiconductor sector, which lost over 14% due to tariff-related uncertainty and recession fears. In contrast, the S&P 500 gained 1.1% during the same period. Nvidia stock’s performance lagged behind the S&P 500 but aligned with sector trends. Despite these challenges, Nvidia expects earnings growth of 48% for the current fiscal year, driven by demand in artificial intelligence and automotive markets.
The following table compares Nvidia stock’s cumulative price increases over different periods:
| Time Frame | Cumulative Stock Price Increase (%) |
|---|---|
| 5-Year | 1,344.08 |
| 3-Year | 926.16 |
| 2-Year | 348.32 |
| 52-Week | 111.45 |
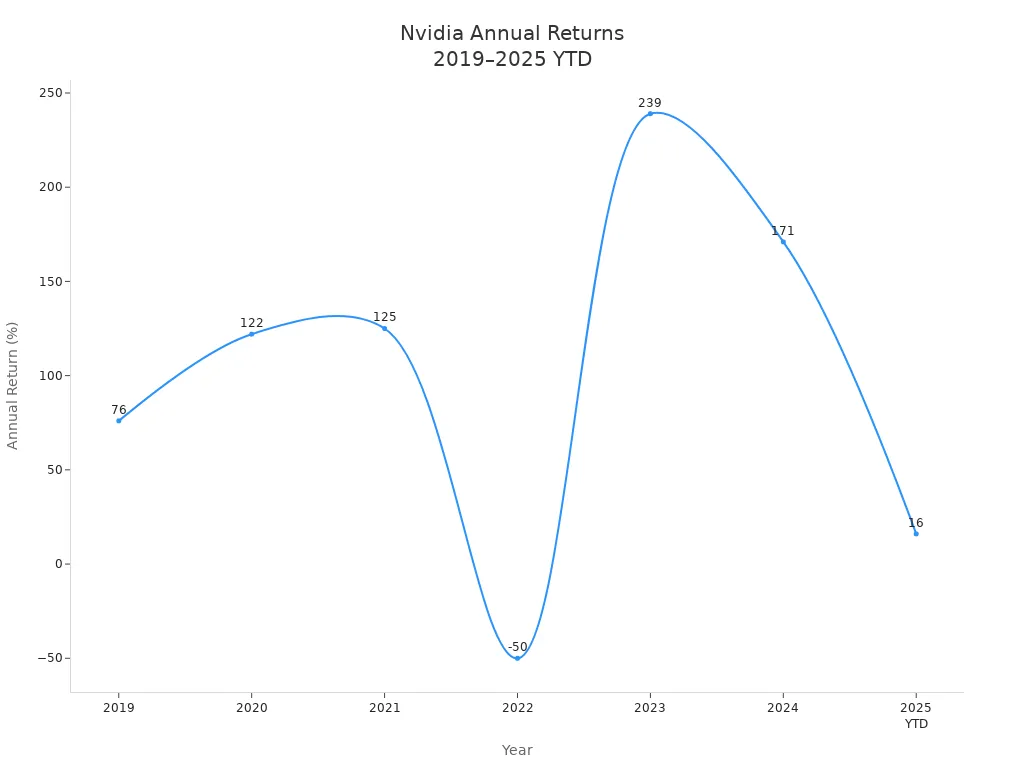
| 2025 YTD | 16 |
Nvidia’s 2025 year-to-date increase of 16% is modest compared to its historical growth. The moderation in returns reflects a normalization after several years of exceptional gains. The chart below illustrates Nvidia’s annual returns from 2019 to 2025 YTD, highlighting the sharp drop in 2022 and lower growth in 2025.
Nvidia’s earnings per share (EPS) continues to grow, reaching $3.14 as of April 2025. However, the quarterly year-over-year EPS growth rate of 28.3% is significantly lower than the five-year average of 90%. This signals a slowdown in earnings growth, which investors should monitor closely.
Macroeconomic factors also influence Nvidia stock. Ongoing US-China trade tensions impact operations and supply chains. Semiconductor supply chain disruptions and component shortages constrain product availability, affecting revenue and earnings. Regulatory and legal risks related to data privacy and competition laws remain important considerations for investors.
Analyst Sentiment
Analysts maintain a generally positive outlook for NVDU stock in 2025. The consensus average price target stands at $183.75, only slightly above the current price of $183.16, suggesting a modest upside of 0.32%. The consensus rating is “Moderate Buy,” with most analysts expecting stable growth.
| Metric | Value |
|---|---|
| Number of Analysts | 42 |
| Consensus Average Price Target (2025) | $183.75 |
| Current Price | $183.16 |
| Forecasted Upside | 0.32% |
| Highest Price Target | $250.00 |
| Lowest Price Target | $120.00 |
| Consensus Rating | Moderate Buy |
| Analyst Ratings Breakdown | 1 Sell, 5 Hold, 32 Buy, 4 Strong Buy |
Several major firms have raised their price targets for Nvidia stock:
- Piper Sandler: Price target raised from $180 to $225, Buy rating, +22.84% upside
- Morgan Stanley: Price target raised from $170 to $200, Buy rating, +9.19% upside
- Mizuho: Price target raised from $185 to $192, Buy rating, +4.83% upside
- Needham: Price target raised from $160 to $200, Strong Buy rating, +9.19% upside
- Oppenheimer: Price target raised from $175 to $200, Buy rating, +9.19% upside
Most analysts highlight Nvidia’s leadership in AI and data center technologies, expansion into autonomous vehicles, and investments in edge computing as key growth drivers. Strategic acquisitions and partnerships, supported by strong free cash flow, reinforce positive sentiment. However, analysts also warn of slowing revenue growth in the Data Center segment, intensifying competition from other AI hardware providers, and geopolitical risks, especially related to China.
Investors should watch for changes in trade policy, supply chain stability, and competitive developments. Monitoring Nvidia’s earnings reports and analyst upgrades will help gauge future performance.
NVDU stock is likely to outperform the semiconductor sector if trade tensions ease and demand for AI solutions remains strong. However, the stock may not match its historical growth rates, and volatility could persist. Investors should remain alert to macroeconomic shifts and regulatory changes that could affect Nvidia’s outlook.
Recent Trends in Nvidia Stock
Price Movements
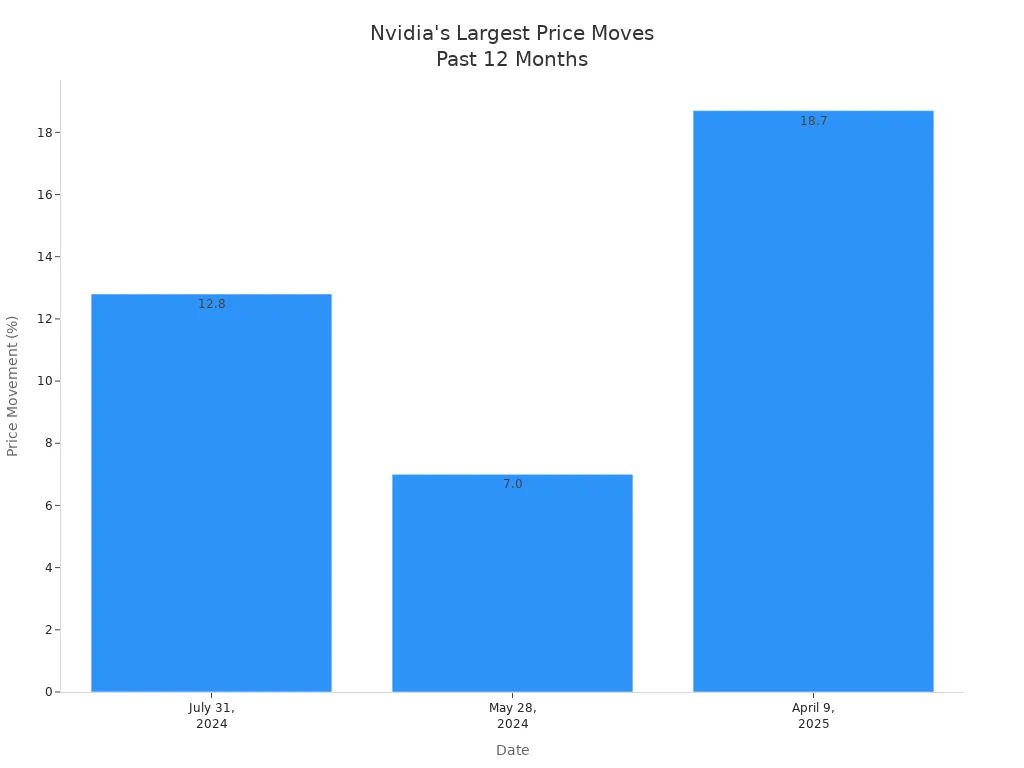
Nvidia stock has shown remarkable price movements over the past year. The most significant single-day increase occurred on April 9, 2025, when the stock jumped 18.7%. This surge followed a series of company press releases and was succeeded by a slight average decline the next day. On July 31, 2024, Nvidia stock rose 12.8% after headlines reported Nancy Pelosi’s purchase of Nvidia shares, a Morgan Stanley upgrade, and a surge in the chip sector. Another notable movement happened on May 28, 2024, when Nvidia cut AI chip prices in China to compete with Huawei, resulting in a 7% gain.
The table below summarizes these major price movements:
| Date | Price Movement | Context / Headlines |
|---|---|---|
| April 9, 2025 | +18.7% | Largest single-day increase in 12 months; followed by slight average decline next day; 4 moves linked to company press releases |
| July 31, 2024 | +12.8% | Pelosi buys Nvidia, Morgan Stanley upgrade, chip sector surge, US may limit China’s AI chip access |
| May 28, 2024 | +7.0% | Nvidia cuts AI chip price in China amid Huawei competition |
| Late Jan 2025 | Market cap loss of $589B | DeepSeek AI impact caused dramatic market cap loss; followed by rebound; headlines note tech stock fall and Nvidia recovery |
Nvidia’s stock price climbed from approximately $48.15 to $148.85 in 2024, marking a 171.23% increase. In 2023, the price moved from about $14.30 to $50.39, a 239.02% rise. These figures highlight strong upward momentum for Nvidia.
Volatility Factors
Several factors have contributed to volatility in Nvidia stock during 2025. Nvidia reached a new 52-week high of $184.48, with trading volume exceeding 145 million shares. Quarterly earnings in Q1 2025 showed revenue of $44.06 billion, beating estimates, but earnings per share missed expectations at $0.81 versus $0.87. Analyst upgrades from Bank of America and Needham & Co. raised target prices, which increased market activity.
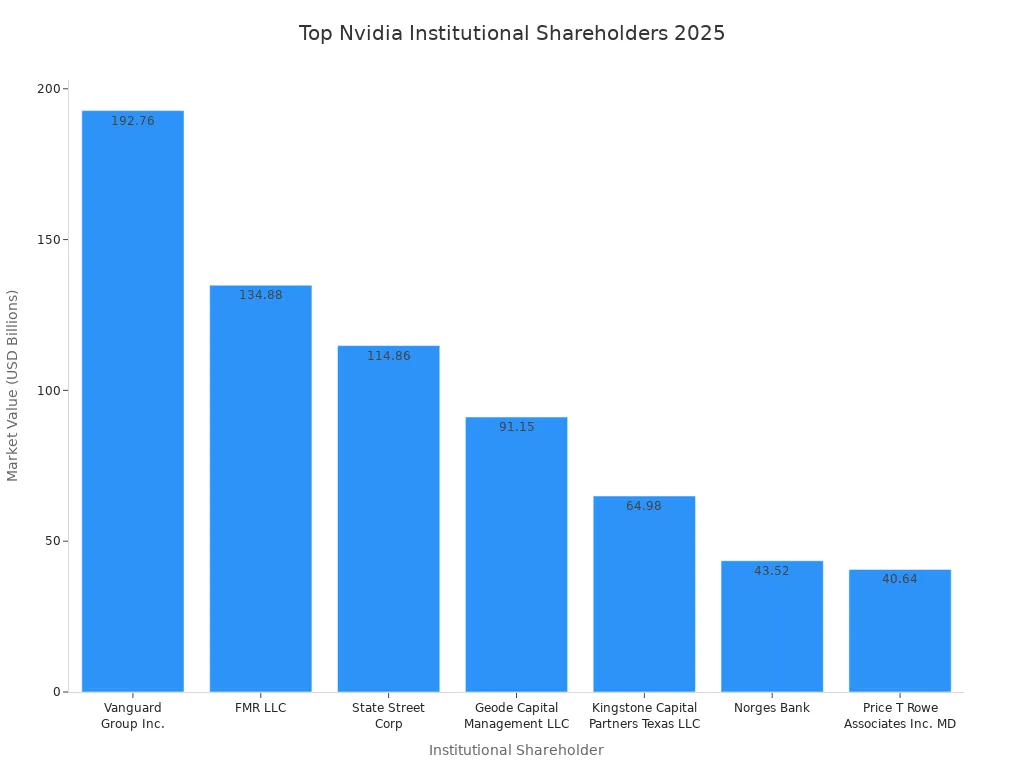
Institutional investors continue to play a major role in Nvidia’s volatility. In 2025, institutional ownership stands at 65.27%. Over the last 12 months, 4,302 institutional buyers contributed $343.54 billion in inflows, while 3,231 sellers accounted for $96.14 billion in outflows. Notable investors such as Vanguard Group Inc. and FMR LLC hold significant market value in Nvidia shares.
Investors should monitor trading volume, earnings results, and institutional activity to understand future movements in Nvidia stock. News related to China, analyst ratings, and product pricing changes also influence volatility.
Growth Drivers for Nvidia
AI Demand
Nvidia stands at the center of the artificial intelligence revolution. Demand for AI hardware continues to surge in 2025, driving significant revenue increases for the company. Nvidia reported a 114% rise in fiscal year revenue, reaching $130.5 billion, fueled by strong sales of Blackwell GPUs. The company shipped between 60,000 and 70,000 Blackwell B200 server systems, each priced between $2 million and $3 million USD. These systems alone could generate up to $210 billion in revenue. Nvidia’s quarterly revenue nearly doubled year-over-year, approaching $40 billion, as advanced packaging capacity from TSMC doubled to meet demand.
Major technology firms such as Meta, Alphabet, and Microsoft have increased capital expenditures in 2025, supporting Nvidia’s leadership in AI infrastructure. CEO Jensen Huang noted that demand for AI inference remains “off the charts,” with popular services like ChatGPT and Gemini driving usage. Analysts expect Nvidia’s revenue to approach $130 billion in 2025, with growth rates moderating to 30–50% annually. The AI accelerator market could reach $2 trillion by 2028, positioning Nvidia for continued expansion.
| Metric | Value | Explanation |
|---|---|---|
| AI infrastructure investment growth (2024 YoY) | 34% | Strong momentum for 2025 |
| Nvidia fiscal year revenue increase | 114% to $130.5 billion | Driven by AI hardware demand |
| Blackwell B200 systems shipment (2025) | 60,000–70,000 units | $120B–$210B potential revenue |
| Nvidia fiscal 2026 revenue projection | $195 billion (51% increase) | Covers most of calendar 2025 |
Tech Partnerships
Nvidia leverages strategic partnerships to accelerate innovation and expand market reach. The company collaborates with leading cloud providers, including Microsoft and Alphabet, to integrate Nvidia’s chips into large-scale data centers. These partnerships enable rapid deployment of artificial intelligence solutions across industries. Nvidia also works with TSMC to secure advanced packaging capacity, ensuring supply meets global demand.
Recent technological innovations highlight Nvidia’s commitment to growth. The GeForce RTX 50 Series GPUs, based on the Blackwell architecture, deliver enhanced gaming and AI-driven graphics. DLSS 4 technology uses AI to boost gaming performance. The Cosmos platform supports robotics and autonomous vehicles, while the DRIVE Hyperion AV Platform advances self-driving technology. Project DIGITS and the GB10 AI Superchip target AI research and desktop computing.
Nvidia’s focus on partnerships and innovation strengthens its position in artificial intelligence, gaming, robotics, and autonomous vehicles. These efforts support sustained growth and market leadership.
Nvidia Stock Financials

Image Source: pexels
Earnings & Growth
Nvidia continues to deliver strong earnings in 2025. The company reported quarterly earnings of $0.81 per share, which missed consensus earnings estimates of $0.87. Despite this, Nvidia’s annual earnings reached $3.14 per share, reflecting steady performance. Analysts expect earnings estimates for the next quarter to remain stable, with projected earnings of $0.85 per share. Nvidia’s earnings estimates for the fiscal year suggest a 48% increase, supported by robust demand for AI hardware and data center solutions.
Earnings growth has slowed compared to previous years. The year-over-year earnings growth rate stands at 28.3%, which is below the five-year average of 90%. Nvidia’s management attributes this moderation to supply chain challenges and regulatory pressures, especially those related to China. Investors should monitor quarterly earnings releases and compare actual results to earnings estimates. Consistent outperformance against earnings estimates often signals positive momentum.
Tip: Investors can track Nvidia’s earnings calendar and review analyst earnings estimates to stay informed about future performance.
Valuation Metrics
Nvidia’s valuation metrics show a premium compared to industry peers. The company’s price-to-earnings (P/E) ratio sits at 43.95, which analysts describe as elevated. The price-to-sales (P/S) ratio reaches 24.55, significantly higher than the semiconductor industry average of 11.74 and the broader information technology sector average of 9.32. This premium valuation reflects investor confidence in Nvidia’s earnings potential and future growth.
| Metric | Nvidia (Early 2025) | Semiconductors & Semiconductor Equipment Industry Average | Information Technology Sector Average |
|---|---|---|---|
| Price to Earnings (P/E) Ratio | 43.95 | N/A | N/A |
| Price to Sales (P/S) Ratio | 24.55 | 11.74 | 9.32 |
Nvidia’s dividend yield remains low at 0.02%, with a payout ratio of 1.3%. This is much lower than the technology sector average of 1.64%. Nvidia’s strategy focuses on reinvesting earnings rather than providing high dividend income. The chart below compares dividend yields among Nvidia and its peers.
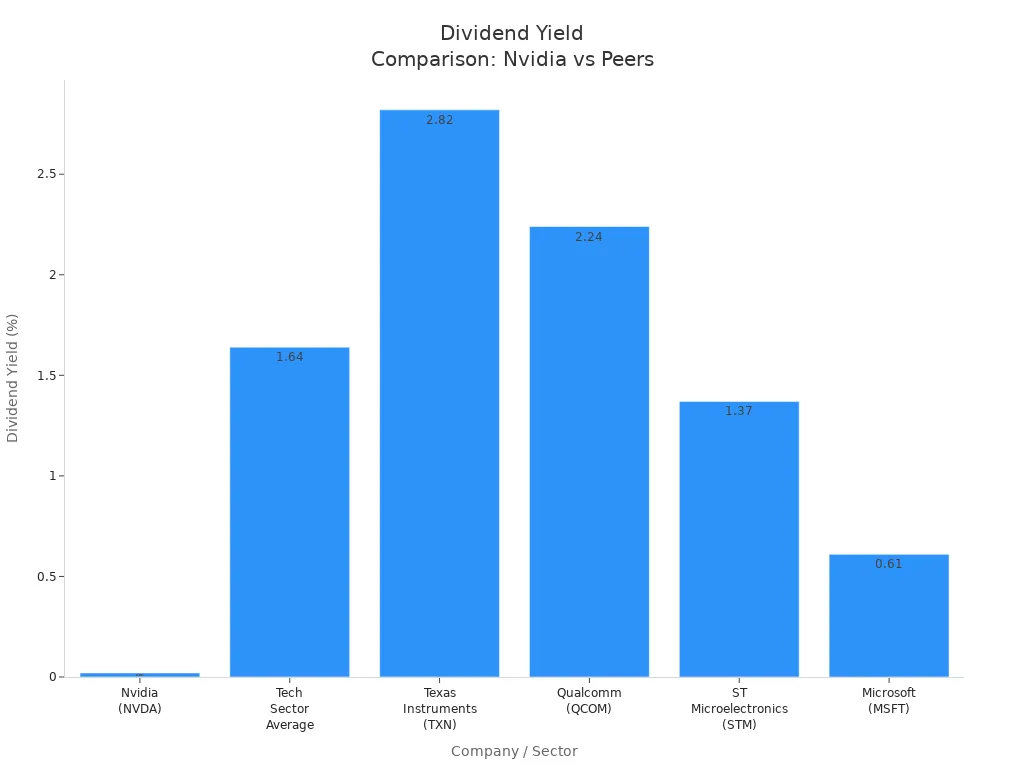
Note: Investors seeking income may prefer other technology stocks with higher dividend yields. Nvidia’s approach prioritizes long-term earnings growth and innovation.
Risks for Nvidia Stock Investors
Competition
Nvidia faces strong competition in the AI semiconductor market in 2025. The company holds an estimated 80–90% market share, dominating data center AI chips. However, rivals continue to challenge its position. AMD remains the top competitor, with its MI300 GPU gaining traction since its 2024 launch. Although AMD’s software ecosystem still trails Nvidia, it holds under 15% of the market. Other companies, such as Qualcomm and Broadcom, compete with new AI chip designs and application-specific integrated circuits. Major cloud providers like Amazon and Google have developed custom chips, mainly for internal use, but these solutions are starting to gain external traction. Chinese companies, especially Huawei, are rapidly improving their AI chip technology and could become significant competitors in the future.
| Competitor | Market Share Estimate | Key Details |
|---|---|---|
| Nvidia | ~80-90% | Dominates AI semiconductor market, especially data center AI chips. |
| AMD | Under 15% | Top competitor with MI300 GPU launched in 2024; software ecosystem still behind Nvidia. |
| Qualcomm | Small share | Competes with new AI chip designs. |
| Broadcom | Small share | Produces ASICs, including Google’s TPUs. |
| Startups | Small share | Emerging with new chip designs and business models. |
| Amazon (Trainium) | Small share | Custom AI chips mainly for internal use, gaining some external traction. |
| Google (TPUs) | Small share | Custom AI chips mainly for internal use, gaining some external traction. |
| Intel | Small share | Struggles to compete; has Gaudi AI chips but behind Nvidia and AMD. |
| Huawei | Small but growing | Chinese competitor catching up in AI chip innovation, driven by export restrictions. |
Nvidia’s advantage comes from its powerful chips and broad developer ecosystem. Traditional semiconductor firms like Intel have struggled to match Nvidia’s GPU architecture, which is optimized for AI workloads. The competitive landscape remains dynamic, and any shift in technology or market preference could impact Nvidia’s stock performance.
Geopolitical Issues
Geopolitical developments present significant risks for Nvidia in 2025. Several recent events have affected the company’s business operations and stock price:
- In August 2025, a revenue-sharing deal allowed Nvidia to resume sales of advanced AI chips (H20) to China after a ban in April 2025.
- The agreement requires Nvidia to pay 15% of revenue from these sales to the U.S. government, creating regulatory uncertainty and legal risks.
- Chinese regulators raised security concerns about the chips, which Nvidia denies, adding to geopolitical tension.
- The arrangement creates a paradox where the U.S. government benefits financially from China’s AI market while trying to limit China’s technological advancement.
- For stockholders, the deal restores revenue potential but adds volatility due to policy shifts, possible legal challenges, and reputational risks.
- Nvidia’s stock valuation reflects optimism about AI growth but is tempered by these geopolitical risks, including possible future increases in revenue-sharing percentages for newer chip architectures.
- The deal marks a shift in corporate governance, requiring direct negotiation with the government to secure market access, increasing complexity and risk.
Note: Regulatory risks also include constitutional concerns over the revenue-sharing agreement, antitrust issues, and the possibility of fragmented global trade. The 15% revenue share could reduce Nvidia’s gross margins by up to 10%, threatening profitability and market access. Investors should monitor policy changes and legal developments closely.
Nvidia Corporation Opportunities
Long-Term Potential
Nvidia corporation demonstrates strong long-term growth potential. Industry analysts forecast steady revenue increases through 2030, driven by GPU dominance and expansion in artificial intelligence. The table below shows projected revenue growth:
| Year | Revenue (in $ billions) |
|---|---|
| 2025 | 121.3 |
| 2026 | 168.2 |
| 2027 | 193.9 |
| 2028 | 225.5 |
| 2029 | 236.5 |
| 2030 | 265.5 |
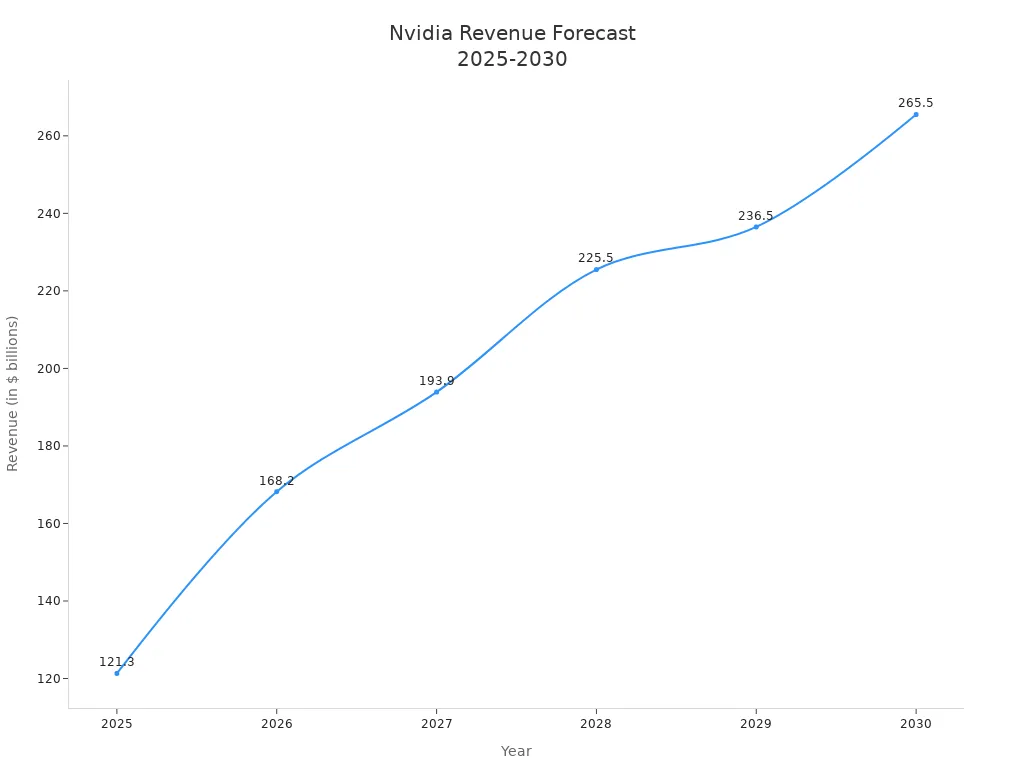
Phil Panaro from Boston Consulting Group projects a scenario where Nvidia corporation could reach $800 per share by 2030. This would require revenue of about $473 billion, assuming a 30% market share in the data center industry. The data center market is expected to grow at a 26% compound annual rate, with total capital expenditures reaching $1.6 trillion USD (see exchange rates). This optimistic target depends on Nvidia corporation expanding into high-margin AI software and services and maintaining investor confidence.
Investors should monitor Nvidia corporation’s progress in AI software and data center solutions. Sustained innovation and market leadership will be key factors for long-term success.
New Markets
Nvidia corporation is entering several new markets in 2025, including automotive, robotics, and healthcare AI applications. The autonomous vehicle sector stands out, with the Drive platform offering hardware and software for self-driving cars. CEO Jensen Huang expects automotive revenue to reach $5 billion USD in fiscal 2026, a 194% increase from fiscal 2025. AI data center spending could exceed $1 trillion USD annually by 2028, and autonomous vehicles represent another trillion-dollar opportunity. The total addressable market for AI chips is projected to reach $400 billion USD by 2027.
Nvidia corporation’s new products launched in 2025 target large market opportunities:
- The total addressable market for AI compute chips is estimated at $563 billion USD by 2028.
- AI networking chips could reach $119 billion USD.
- Blackwell AI GPUs and data center solutions are expected to drive growth, with Data Center revenue projected at $183.8 billion USD in fiscal 2026.
- Blackwell revenue may jump from $3–4 billion USD to $75.1 billion USD.
- Analysts estimate Data Center revenue between $152.4 billion USD and $236.0 billion USD.
- Expansion into sovereign AI infrastructure globally supports these large market estimates.
Nvidia corporation’s entry into automotive, robotics, and healthcare AI applications creates new growth vectors. The company’s leadership in AI chips and data center solutions positions it to capture significant market share in these emerging sectors.
Action Steps for NVDU Stock
Buy, Hold, or Sell
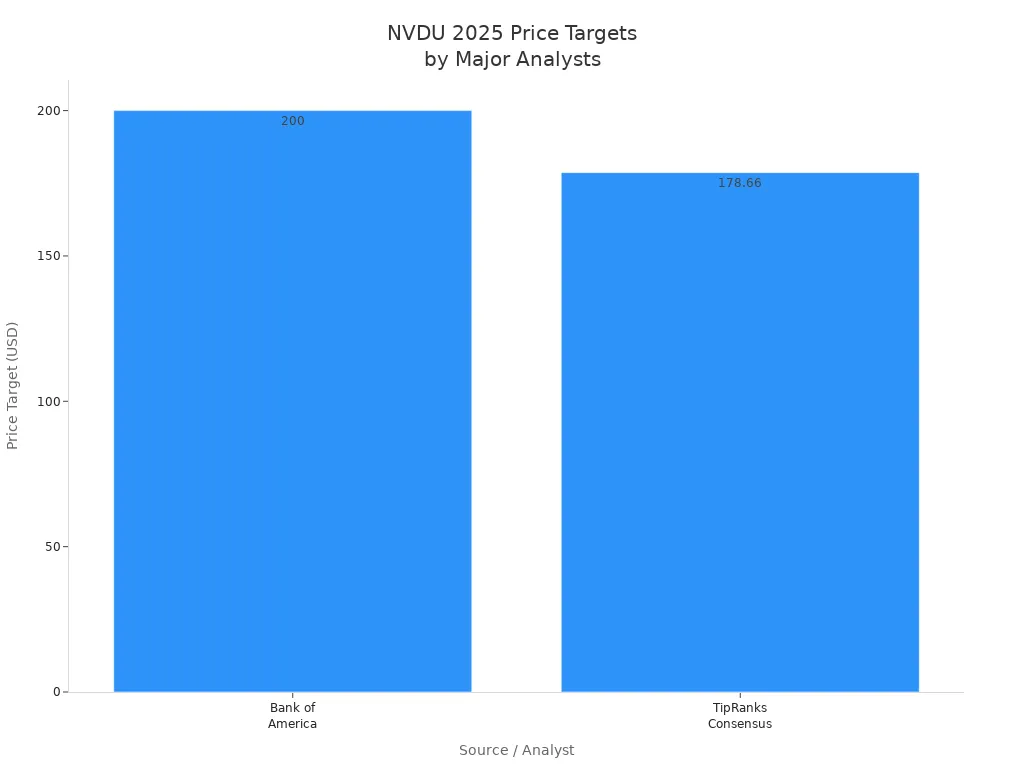
Analyst sentiment for nvdu stock in 2025 remains divided. Most major investment banks and research firms recommend a “Buy” or “Strong Buy,” citing robust earnings growth and Nvidia’s leadership in AI hardware. Bank of America lists nvdu stock as a top pick, raising its price target to $200 USD and describing the valuation as compelling. TipRanks Consensus shows 38 out of 41 analysts recommend buying, with an average price target of $178.66 USD. Beth Kindig from Forbes predicts a 70% upside, driven by the Blackwell AI architecture and strong GPU sales. Some experts urge caution. Sean Williams from Motley Fool recommends holding, warning about a possible valuation bubble and unsustainable price-to-sales ratios. Elliott Management takes a bearish stance, suggesting a sell due to concerns about AI hype and potential earnings disappointments.
| Source / Analyst | Recommendation | Price Target (2025) | Key Points / Rationale |
|---|---|---|---|
| Bank of America | Top Pick / Buy | $200 | Strong long-term demand; near-term headwinds from China tariffs; compelling valuation |
| TipRanks Consensus | Strong Buy | $178.66 | Majority buy ratings; Nvidia expected to outperform market |
| Beth Kindig (Forbes) | Buy / Stock of the Decade | N/A | Predicts 70% upside from new AI architecture |
| Sean Williams (Motley Fool) | Hold / Caution | N/A | Warns of valuation bubble; expects easing GPU shortages |
| Elliott Management (FT) | Sell / Bearish | N/A | Claims AI hype is overblown; warns of valuation risk |
Most analysts recommend buying nvdu stock for exposure to AI-driven growth, but some suggest holding or selling due to valuation risks and market volatility. Investors should align their decisions with risk tolerance and investment horizon.
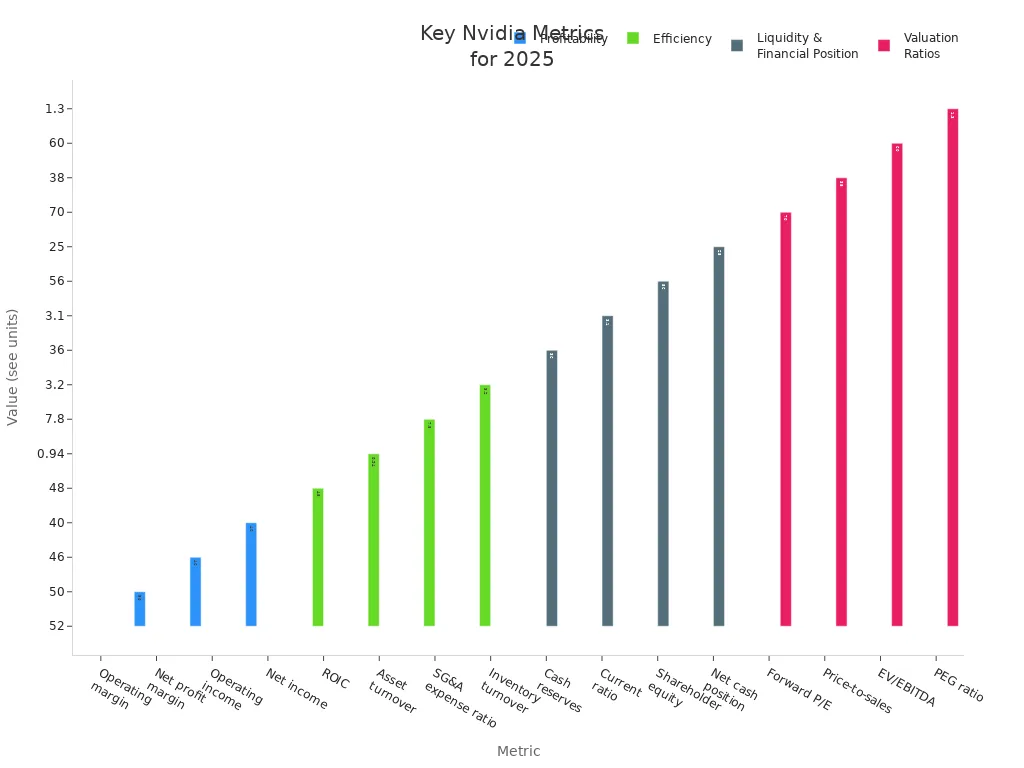
Key Metrics to Watch
Monitoring key financial and operational metrics helps investors evaluate Nvidia’s performance in 2025. The most critical indicators include:
| Metric Category | Key Metrics and Values |
|---|---|
| Profitability | Operating margin: 52%, Net profit margin > 50%, Operating income: $46B USD, Net income: $40B USD |
| Efficiency | ROIC: 48%, Asset turnover: 0.94, Net profit per employee: >$1.6M USD, SG&A expense ratio: 7.8%, Inventory turnover: 3.2, Days sales outstanding: 28 days, R&D-to-revenue ratio: ~12% |
| Liquidity & Financial Position | Cash reserves: $36B USD, Debt-to-equity ratio: <0.1, Current ratio: 3.1, Shareholder equity: $56B USD, Net cash position: $25B+ USD, Credit rating: AA+ |
| Growth | FY 2025 revenue: >$88B USD (44% YoY growth), Data center revenue Q3 2025: $30.8B USD (100% YoY growth), EPS FY 2025: >$15 USD (51% YoY surge) |
| Valuation Ratios | Forward P/E: 70, Price-to-sales: 38, EV/EBITDA: 60, PEG ratio: 1.3, Free cash flow yield: 0.85% |
| Market & Operational | Beta: 1.29, Trading volume: >41M shares/day, Options implied volatility: 45%, AI-driven product lines, Partnerships with major cloud providers |
Investors should track earnings reports, data center revenue, and gross margins. Changes in China policy, competitive developments, and valuation ratios also require attention. For all monetary references, see current exchange rates.
Tip: Regularly review quarterly earnings, analyst upgrades, and regulatory news to stay informed about nvdu stock performance.
Nvidia’s 2025 performance highlights strong revenue growth, robust margins, and expanding opportunities in AI, gaming, and new markets. The table below summarizes the most important takeaways:
| Aspect | Details |
|---|---|
| Q4 FY2025 Revenue | $39.3 billion USD (see exchange rates) |
| EPS | $0.89, above expectations |
| Gross Margin | 73.5%, showing pricing strength |
| Data Center Growth | 93% year-over-year |
| Forward Guidance | Raised revenue outlook, expanded buybacks |
| Key Risks | AI power demands, export restrictions to China, sector volatility |
| Opportunities | AI leadership, robotics, autonomous vehicles, quantum computing |
Maintain a balanced approach. Monitor quarterly earnings, regulatory changes, and technology trends to stay ahead in this dynamic market.
FAQ
What are the main risks for NVDU stock investors in 2025?
Investors face risks from competition, regulatory changes, and geopolitical issues, especially related to China. Volatility may increase if trade policies shift. Monitoring quarterly earnings and policy updates helps manage these risks.
How does Nvidia’s valuation compare to industry peers?
Nvidia trades at a higher price-to-earnings and price-to-sales ratio than most semiconductor companies. This premium reflects strong growth expectations. Investors can check current exchange rates here.
What financial metrics should investors track for NVDU stock?
Key metrics include revenue growth, gross margin, earnings per share, and data center revenue. Investors should also watch cash reserves and valuation ratios. These indicators provide insight into Nvidia’s financial health.
How do geopolitical tensions with China affect Nvidia’s outlook?
Geopolitical tensions can impact Nvidia’s supply chain, sales, and regulatory environment. Recent agreements allow some sales to China but add legal and financial uncertainty. Investors should follow policy changes closely.
Does Nvidia pay a significant dividend?
Nvidia offers a low dividend yield of 0.02%. The company reinvests most profits into research and development. Investors seeking higher income may consider other technology stocks or Hong Kong banks.
Nvidia’s performance in 2025 highlights a critical lesson for investors: while the growth potential is immense, so are the risks. Navigating the volatility, geopolitical headwinds, and premium valuation requires more than just a strong investment thesis—it requires a reliable financial platform that can handle the complexities of a global market. BiyaPay provides that essential foundation. Our unified global financial account simplifies the process of investing in high-growth US stocks like NVDU, allowing you to bypass the traditional hassles of international banking. With our real-time exchange rate converter and low remittance fees, you can manage your funds with speed and transparency. Furthermore, our platform offers access to the Hong Kong stock market, enabling you to diversify and build a balanced portfolio as recommended by analysts. Don’t let financial logistics slow you down. Register today to take control of your global investments.
*This article is provided for general information purposes and does not constitute legal, tax or other professional advice from BiyaPay or its subsidiaries and its affiliates, and it is not intended as a substitute for obtaining advice from a financial advisor or any other professional.
We make no representations, warranties or warranties, express or implied, as to the accuracy, completeness or timeliness of the contents of this publication.


Contact Us
Company and Team
BiyaPay Products
Customer Services


is a broker-dealer registered with the U.S. Securities and Exchange Commission (SEC) (No.: 802-127417), member of the Financial Industry Regulatory Authority (FINRA) (CRD: 325027), member of the Securities Investor Protection Corporation (SIPC), and regulated by FINRA and SEC.
registered with the US Financial Crimes Enforcement Network (FinCEN), as a Money Services Business (MSB), registration number: 31000218637349, and regulated by FinCEN.
registered as Financial Service Provider (FSP number: FSP1007221) in New Zealand, and is a member of the Financial Dispute Resolution Scheme, a New Zealand independent dispute resolution service provider.