- EasyCard
- Trade
- Help
- Announcement
- Academy
- SWIFT Code
- Iban Number
- Referral
- Customer Service
- Blog
- Creator
SLXN Stock Volatility and What It Means for Your Portfolio


Image Source: unsplash
Is holding slxn stock a risk or an opportunity in today’s volatile market? Recent signals from silexion therapeutics corp have drawn attention from traders and analysts. The company’s stock shows a beta of 1.30, making it more sensitive to market swings than average stocks. Technical indicators, such as RSI and moving average crossovers, have triggered optimism. The analyst price target for silexion therapeutics corp stands at $5.00 USD, far above its latest closing price. Investors must weigh both bullish and bearish signals to make informed decisions.
Understanding volatility helps investors protect their portfolios.
Metric Value Interpretation Beta 1.30 More sensitive to market movements. Correlation with SPY ETF 0.02 Largely independent from broader market. Support Level $6.51 Lower bound of expected trading range. Resistance Level $8.70 Upper bound of expected trading range.
Key Takeaways
- SLXN stock shows high volatility with sharp price swings that can quickly change portfolio value.
- Technical indicators give mixed signals, suggesting possible rebounds but overall bearish trends remain.
- Analysts remain optimistic with strong buy ratings and high price targets, but short-term risks persist.
- Investors should use risk management tools like diversification, stop-loss orders, and position sizing.
- Monitoring news, earnings, and technical signals closely helps investors make better decisions with SLXN stock.
SLXN Stock Impact
Portfolio Effects
SLXN stock can create dramatic changes in an investor’s portfolio. Silexion Therapeutics Corp has shown that its shares can move sharply in response to news and technical signals. For example, on January 28, 2025, slxn stock surged by 117.24%. This jump followed groundbreaking clinical trial results and new experimental regimens. Strategic deals also played a role. These events increased trading volume and attracted more investors. Such price swings can boost portfolio value quickly, but they also highlight the unpredictable nature of silexion therapeutics corp.
Investors who hold slxn stock may see rapid gains or losses. The stock’s high beta means it reacts strongly to market changes. When silexion therapeutics corp releases positive news, portfolios can benefit. However, the company’s financial fragility and the volatility of penny stocks add uncertainty. Investors must watch for both opportunities and risks. A single event can change the value of slxn stock in a portfolio overnight.
Tip: Investors should track news events and technical signals for silexion therapeutics corp. Quick reactions can help capture gains or limit losses.
Volatility Risks
Holding slxn stock during periods of high volatility exposes investors to several risks. Silexion Therapeutics Corp experiences large intraday price swings, sometimes up to 25% in a single trading day. This volatility can make it difficult for investors to predict outcomes. The stock also has low liquidity, with falling trading volume. This situation increases the risk of poor price performance and makes it harder to exit positions.
The lack of support from accumulated volume below the current price adds to the downside risk. Technical indicators show strong negative signals. Multiple sell signals from moving averages and MACD suggest further price declines. Recently, slxn stock fell more than 40% in just ten days. It broke down from a wide, falling trend, which points to a higher chance of continued losses.
Investors face additional risk because no stop-loss is recommended for silexion therapeutics corp. This increases exposure to potential losses during volatile swings. Resistance levels exist above the current price, but breaking these is necessary to reverse the negative trend. All these factors combine to make slxn stock a very high-risk investment during volatile periods.
- SLXN stock shows very high intraday price fluctuations.
- Low liquidity increases risk and makes exiting positions difficult.
- No support from accumulated volume below the current price.
- Technical indicators show strong negative signals.
- Recent sharp declines and breakdown from a falling trend.
- No stop-loss recommended, increasing exposure to losses.
- Resistance levels must be broken to shift the negative trend.
Note: Investors should consider reducing exposure to slxn stock during periods of high volatility. Careful monitoring and risk management are essential.
SLXN Stock Trends

Image Source: pexels
Technical Signals
Silexion therapeutics corp has experienced significant shifts in technical indicators over the past month. These signals help investors understand the direction of slxn stock and guide their price prediction strategies. The Aroon Indicator entered a downward trend on July 8, 2025, suggesting a strong bearish move. On August 1, 2025, the price of slxn stock dropped below its 50-day moving average, confirming a shift from an upward to a downward trend. The MACD histogram turned negative on August 6, 2025, reinforcing the bearish outlook.
| Date | Indicator | Signal Description | Interpretation / Implication |
|---|---|---|---|
| July 08, 2025 | Aroon Indicator | Entered a downward trend | Suggests a strong downward move ahead; bearish signal |
| August 01, 2025 | 50-day Moving Average | SLXN price moved below the 50-day moving average | Indicates a shift from upward to downward trend |
| August 06, 2025 | MACD Histogram | Turned negative | Another bearish signal indicating potential price decline |
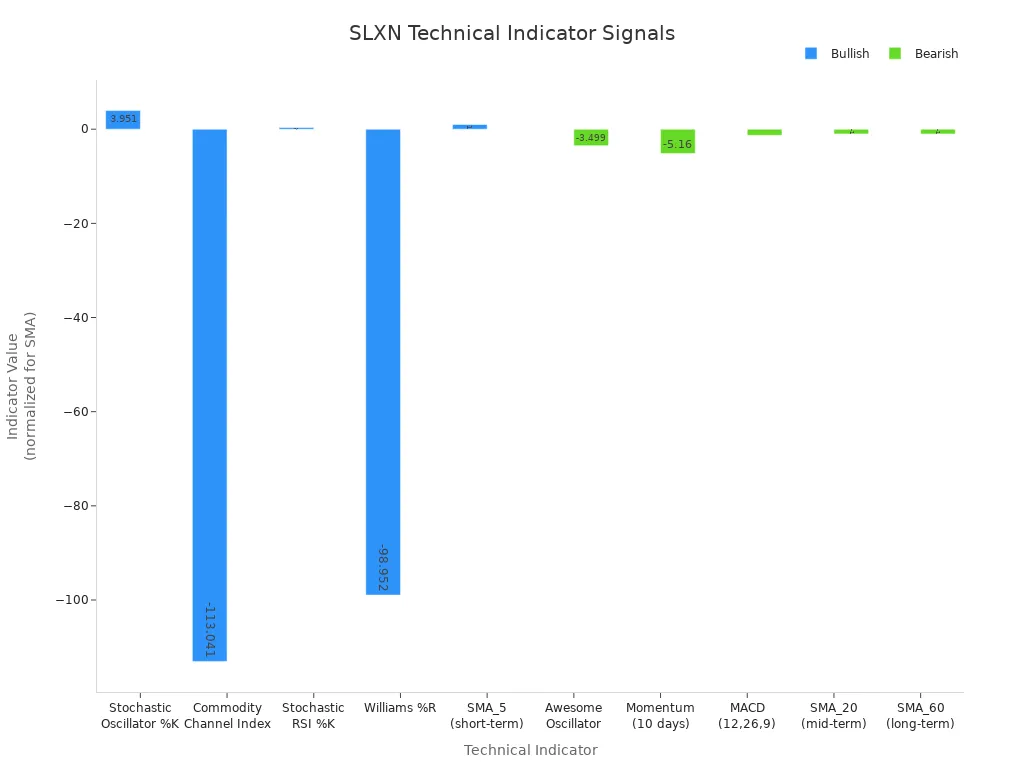
Despite these bearish signals, several momentum indicators now show oversold conditions. The Stochastic Oscillator, Commodity Channel Index, Stochastic RSI, and Williams %R all point to a potential rebound. The RSI stands at 35.8, which is below the neutral level and suggests that slxn stock could recover if buying interest returns. The Bollinger Bands have contracted, forming a squeeze pattern near $0.805. This pattern often signals that a breakout, either upward or downward, may occur soon.
| Indicator | Value | Signal | Interpretation |
|---|---|---|---|
| Stochastic Oscillator %K (14,3,3) | 3.951 | Bullish | Oversold condition, potential rebound |
| Commodity Channel Index (20 days) | -113.041 | Bullish | Oversold condition, potential rebound |
| Stochastic RSI %K (14,14,3,3) | 0.348 | Bullish | Oversold condition, potential rebound |
| Williams %R (14 days) | -98.952 | Bullish | Oversold condition, potential rebound |
| Awesome Oscillator (5,34) | -3.499 | Bearish | Negative value, downward momentum |
| Momentum (10 days) | -5.16 | Bearish | Negative value, downward momentum |
| MACD (12,26,9) | -1.288 | Bearish | Negative value, downward momentum |
| SMA_5 (short-term) | Positive | Bullish | Short-term positivity |
| SMA_20 (mid-term) | Negative | Bearish | Mid-term negativity |
| SMA_60 (long-term) | Negative | Bearish | Long-term negativity |
| RSI | 35.8 | Oversold | Suggests potential rebound |
| Bollinger Bands | Squeeze | Neutral | Indicates volatility contraction, possible breakout |
Key price levels for slxn stock include $0.914, which would confirm a bullish breakout, and $0.729, which would signal bearish capitulation. The 200-day moving average at $1.0956 remains above the current price, reinforcing the longer-term bearish context. Investors should watch these levels closely for any signs of reversal or further decline.
Recent market movements have created a neutral technical rating for silexion therapeutics corp. There are four buy signals and three sell signals, which means investors should remain cautious. The technical profile suggests a possible rebound, but the prevailing trend remains bearish until a breakout above key resistance levels occurs.
Tip: Investors should use technical signals to set entry and exit points for slxn stock. Monitoring these indicators can help improve price prediction accuracy.
Analyst Ratings
Analyst sentiment for silexion therapeutics corp remains highly optimistic despite the current technical weakness. The consensus rating stands at “Strong Buy,” and the average price target is $75.00 USD. This target represents a potential upside of over 934% from the current trading price of $7.25 USD. Such a large gap between the current price and the price prediction from analysts highlights the speculative nature of slxn stock.
| Metric | Value |
|---|---|
| Consensus Rating | Strong Buy |
| Average Price Target | $75.00 |
| Price Target Increase | 934.48% over current price |
| Recent Rating Change | No detailed information |
| Last Stock Split | Reverse split 1:15 on July 29, 2025 |
Analysts expect significant growth for silexion therapeutics corp over the next twelve months. The price prediction reflects confidence in the company’s pipeline and potential FDA approvals. However, the lack of recent rating changes suggests that analyst opinions have not shifted in response to short-term volatility. Investors should consider both the technical signals and analyst ratings when making decisions about slxn stock.
Note: Analyst price targets often reflect long-term expectations. Investors should compare these targets with technical trends and recent market movements before making a decision.
Stock Price Drivers
News Events
News events have played a major role in shaping the stock price of silexion therapeutics corp. Investors often react quickly to announcements that signal changes in the company’s future. Several recent developments have caused sharp movements in the stock price:
- Silexion therapeutics corp stock surged by 68.61% after the company secured crucial FDA approval. This event boosted investor confidence and led to a spike in trading activity.
- The announcement of a groundbreaking partnership with a leading pharmaceutical company expanded the market potential for silexion therapeutics corp.
- Positive clinical trial results exceeded expectations and increased optimism among investors.
- Reports highlighted that the latest product from silexion therapeutics corp could revolutionize treatments for several diseases, fueling further excitement.
These news events often lead to rapid price swings. Investors should monitor company updates closely, as even a single announcement can trigger significant volatility in the stock price.
Earnings Impact
Earnings reports for silexion therapeutics corp have historically caused large swings in the stock price. Investors pay close attention to earnings surprises, especially when actual results differ from estimates. The table below shows how recent earnings reports affected the stock price:
| Earnings Date | EPS Surprise (%) | Price Change on Release Day (%) | Price Change 4 Days After (%) | Total Change Over 8-Day Period (%) |
|---|---|---|---|---|
| Nov 14, 2024 | -147.56 | -4.98 | +49.25 | +27.12 |
| Mar 18, 2025 | -2018.37 | -11.20 | -10.40 | -18.84 |
| May 13, 2025 | -1672.73 | -1.00 | -3.80 | -5.25 |
The data shows that negative earnings surprises often trigger sharp declines on the release day. However, the stock price can rebound strongly in the days that follow, as seen in November 2024. Investors should expect volatility around earnings announcements and prepare for both upward and downward movements.
Note: Monitoring earnings reports and news events can help investors anticipate periods of high volatility for silexion therapeutics corp.
Investor Types
Short-Term
Short-term investors approach SLXN stock with a focus on rapid price movements. They monitor news about executive changes and strategic partnerships, reacting quickly to developments that can trigger volatility. SLXN stock often shows significant intraday price swings, which attract traders seeking momentum. These investors display both optimism and skepticism, depending on the latest company updates. For example, promising preclinical drug data or new partnerships can spark buying interest, while financial uncertainties may prompt caution.
Short-term traders typically wait for clear setups before entering trades. They use technical indicators to identify favorable entry and exit points. This approach helps manage risk, especially when the stock experiences sudden spikes or drops. Many traders aim to capture gains from short-lived momentum, but they remain wary of the company’s financial health and management stability. The speculative nature of SLXN stock means that risk management is essential. Traders often set strict stop-loss orders and limit their exposure to avoid large losses.
Short-term investors balance optimism from news catalysts with careful risk management. They seek to profit from volatility but avoid holding positions during uncertain periods.
Long-Term
Long-term investors view SLXN stock differently. They focus on the company’s growth potential and pipeline of drug candidates. These investors analyze fundamentals such as revenue trends, research progress, and regulatory milestones. They pay attention to analyst ratings and price targets, which often reflect expectations for future growth. For instance, the consensus price target for SLXN stock stands at $75.00 USD, suggesting significant upside over time.
Long-term holders accept short-term volatility as part of the investment journey. They diversify their portfolios to reduce risk and may use position sizing to limit exposure. Many rely on regular updates from the company, including earnings reports and clinical trial results. Long-term investors often hold through periods of uncertainty, believing that successful product launches or FDA approvals will drive future gains.
| Investor Type | Focus | Strategy | Risk Approach |
|---|---|---|---|
| Short-Term | Price swings, news | Momentum trading, setups | Strict risk controls |
| Long-Term | Growth, fundamentals | Hold, diversify | Portfolio balancing |
Long-term investors prioritize company fundamentals and future growth. They use patience and diversification to manage volatility in SLXN stock.
Managing Volatility

Image Source: pexels
Risk Strategies
Investors face high volatility when holding SLXN stock. They can use several strategies to manage risk. Diversification stands out as a key approach. By combining SLXN with stocks that move in opposite directions, investors can lower unsystematic risk. For example, SLXN and FLNT have a negative correlation coefficient of -0.51 over three months. This means when SLXN falls, FLNT often rises. Holding both stocks in a portfolio helps offset company-specific risks. Pair trading with SLXN and FLNT can also create a market-neutral position. This approach reduces exposure to broad market swings.
Stop-loss orders provide another layer of protection. Investors set a price at which they will sell SLXN if it drops too far. This action limits potential losses during sharp declines. Position sizing also matters. By keeping SLXN as a small part of the portfolio, investors avoid large losses from a single stock.
Investors should review technical signals and analyst ratings before making decisions. When analysts issue sell or strong sell ratings, reducing exposure to SLXN may help protect the portfolio.
Portfolio Adjustments
Adjusting the portfolio in response to volatility can help investors stay on track with their goals. They can rebalance by selling some SLXN shares after large price increases. This action locks in gains and prevents overexposure. If SLXN drops sharply, investors may choose to buy more only if the long-term outlook remains positive.
A simple table summarizes key actions:
| Strategy | Purpose | Example Action |
|---|---|---|
| Diversification | Reduce unsystematic risk | Add FLNT to offset SLXN moves |
| Stop-Loss Orders | Limit downside | Sell SLXN at $0.70 USD |
| Position Sizing | Control exposure | Keep SLXN under 5% of assets |
| Rebalancing | Maintain target allocation | Sell SLXN after big gains |
Investors should monitor SLXN news and technical signals. Quick responses to changes in ratings or price trends can help limit losses. Regular reviews of the portfolio ensure that risk stays within acceptable limits.
Expert Insights
Analyst Views
Analysts continue to monitor SLXN stock closely. Their recent opinions reflect a cautious approach. Many point to strong preclinical data for SIL204, which shows anti-tumor and anti-metastatic activity. The company has expanded its development strategy, planning clinical trials for SIL204 in the first half of 2026. A new partnership with Catalent supports formulation and clinical manufacturing, which could help advance the pipeline.
Financial data presents a mixed picture. SLXN increased its cash position to $6.2 million USD, up from $1.2 million USD in the previous quarter (see current USD exchange rates). However, net losses grew to $1.7 million USD, and general expenses also rose. The company raised capital through a public offering and warrant exercises, but ongoing losses and no revenue raise concerns about sustainability.
| Aspect | Details |
|---|---|
| Clinical Progress | Strong preclinical data for SIL204 |
| Development Strategy | Dual-route plan; clinical trials expected H1 2026 |
| Strategic Collaboration | Partnership with Catalent |
| Financial Position | Cash increased to $6.2M USD |
| Financial Challenges | Net loss $1.7M USD; rising expenses |
| Capital Raising | $5.0M USD from offering; $3.3M USD from warrants |
| Outlook | Cautious optimism, tempered by losses and volatility |
Investor sentiment remains neutral to mixed. Most analysts do not recommend a strong buy or sell. Technical indicators and forecasts suggest a cautious or neutral price prediction. Hedge fund activity shows no new institutional investors, and one hedge fund exited its position completely in late 2024. The company’s low market capitalization and ongoing losses add to the uncertainty.
Analysts encourage patience and careful monitoring. They recommend waiting for clear improvements in financial stability before making new investments.
Market Outlook
The market outlook for SLXN stock over the next 6 to 12 months remains bearish. The stock has experienced a very wide and falling trend, with a price drop of 21.88% since August 1, 2025, and a 41.58% decline over the last ten days. On the most recent trading day, the price fell 4.61% to $7.25 USD, with high intraday volatility.
| Indicator/Aspect | Details |
|---|---|
| Price Trend | Wide, falling trend; significant declines |
| Recent Price Change | -21.88% since Aug 1, 2025; -41.58% over last 10 days |
| Last Day Price Movement | Fell 4.61% to $7.25 USD; 7.75% intraday fluctuation |
| Moving Averages | Multiple sell signals |
| MACD Indicator | Sell signal |
| Volume | Decreased with price; last day volume down by 14,000 shares |
| Support Levels | No support below $7.25 USD |
| Resistance Levels | $7.60 and $8.31 USD (not breached) |
| Volatility | Daily average 9.89% |
| Liquidity | Low liquidity increases risk |
| Risk Assessment | Very high risk |
| Recommendation | Negative; weak performance expected next 6-12 months |
| Forecast Summary | Bearish outlook; no positive technical reversal signals |
Market experts highlight several challenges. Failed drug trials, sector competition, and financial instability create uncertainty. The company’s quick ratio and return on assets show some ability to meet short-term obligations, but liabilities exceed assets. Some experts see potential for recovery if SLXN stabilizes financially and secures new partnerships. Others warn that ongoing risks may further depress valuation.
- SLXN’s recent equity offering caused a sharp price drop and shareholder dilution.
- Financial reports show net losses and a weak balance sheet.
- The company continues to invest in research, signaling commitment to innovation.
- Experts recommend patience and value-oriented investing.
- Price prediction models remain cautious, with no clear signs of reversal.
- Recovery depends on improved financial health and successful strategic moves.
The outlook for SLXN stock remains speculative. Investors should prepare for continued volatility and use price prediction tools to guide decisions.
Investors face high volatility when trading SLXN stock. They must consider technical signals, analyst ratings, and recent price prediction trends. Key takeaways include the impact of clinical milestones, strategic partnerships, and leadership changes. Technical indicators such as RSI and AI-powered tools help optimize entry and exit points. Risks remain due to liquidity concerns and negative earnings forecasts. Investors should monitor news and analyst updates using resources like Stock Titan and Benzinga. Reviewing investment strategies and staying informed supports better decision-making in a rapidly changing market.
- SLXN stock surged after promising preclinical data and partnerships.
- Technical signals and AI tools improve risk management.
- High volatility and sector competition require active monitoring.
- Stock Titan and Benzinga offer timely updates for investors.
Investors should consult a financial advisor and regularly check SLXN stock news to adjust strategies as market conditions evolve.
FAQ
What causes high volatility in slxn stock?
Recent market movements, news about silexion therapeutics corp, and changes in investor sentiment drive volatility. Technical signals and price prediction models also influence the stock price. Earnings reports and product announcements often trigger sharp swings.
How do analysts make a price prediction for slxn stock?
Analysts review financial data, clinical trial results, and the latest product updates from silexion therapeutics corp. They consider investor sentiment and recent market movements. Many use technical indicators and compare the stock price to industry peers.
Can investor sentiment affect the stock price of silexion therapeutics corp?
Investor sentiment plays a major role. Positive news about the latest product or clinical progress can boost the stock price. Negative reports or missed targets may cause declines. Changes in sentiment often follow recent market movements and analyst opinions.
What should investors watch before buying slxn stock?
Investors should monitor technical signals, analyst ratings, and news about silexion therapeutics corp. They need to check price prediction trends and review recent market movements. Watching updates on the latest product helps assess future growth.
How do Hong Kong banks handle slxn stock transactions?
Hong Kong banks process slxn stock trades in USD. They provide exchange rates for currency conversion (see current USD exchange rates). Investors use these banks to buy or sell shares and manage their accounts securely.
SLXN stock represents a classic high-risk, high-reward scenario. While its volatility can lead to significant gains from groundbreaking clinical news, it also demands rigorous risk management and a platform that can handle rapid market swings. For international investors, the challenges of cross-border transactions and currency conversion add another layer of complexity. This is where a seamless financial solution becomes as crucial as your trading strategy. With BiyaPay, you can fund your US trading account and execute trades with speed and confidence. Our platform offers a unified global account that provides low fees and transparent real-time exchange rate converter to help you minimize costs. By using BiyaPay for your US stocks, you can focus on analyzing the stock’s price prediction and technical signals without worrying about the logistics of funding and fees. Take control of your investments today. Register with BiyaPay to streamline your trading process.
*This article is provided for general information purposes and does not constitute legal, tax or other professional advice from BiyaPay or its subsidiaries and its affiliates, and it is not intended as a substitute for obtaining advice from a financial advisor or any other professional.
We make no representations, warranties or warranties, express or implied, as to the accuracy, completeness or timeliness of the contents of this publication.


Contact Us
Company and Team
BiyaPay Products
Customer Services


is a broker-dealer registered with the U.S. Securities and Exchange Commission (SEC) (No.: 802-127417), member of the Financial Industry Regulatory Authority (FINRA) (CRD: 325027), member of the Securities Investor Protection Corporation (SIPC), and regulated by FINRA and SEC.
registered with the US Financial Crimes Enforcement Network (FinCEN), as a Money Services Business (MSB), registration number: 31000218637349, and regulated by FinCEN.
registered as Financial Service Provider (FSP number: FSP1007221) in New Zealand, and is a member of the Financial Dispute Resolution Scheme, a New Zealand independent dispute resolution service provider.