- EasyCard
- Trade
- Help
- Announcement
- Academy
- SWIFT Code
- Iban Number
- Referral
- Customer Service
- Blog
- Creator
Recent Trends in PDYN Stock Every Investor Should Watch


Image Source: pexels
PDYN stock experienced a sharp 15.8% drop after the latest Q2 2025 earnings, signaling a dramatic shift in market sentiment. You see this volatility as palladyne’s financials reveal both strengths and concerns. The past year saw palladyne’s stock price soar by 395.45%, far outpacing industry peers, yet the company’s earnings lag behind, with a -53.0% EPS growth rate. Recent swings stem from high valuation multiples, negative profitability, and rapid changes in the AI sector. As an investor, you must weigh these risks and opportunities carefully when assessing palladyne’s future in the AI landscape.
Key Takeaways
- PDYN stock shows high volatility with sharp price swings, reflecting quick changes in investor sentiment after earnings and news.
- The company faces financial challenges, including a 63% revenue drop and growing net losses, but holds strong cash reserves to support its AI strategy.
- Palladyne is shifting focus to AI automation, developing advanced software platforms that attract new contracts and partnerships, signaling growth potential.
- Technical analysis reveals mixed buy and sell signals; investors should watch key support and resistance levels to time their trades wisely.
- Investors must balance risks like competition and financial instability with opportunities from AI innovation, monitoring cash flow, contracts, and analyst updates closely.
PDYN Stock Trends

Image Source: pexels
Price Movements
You have seen dramatic changes in PDYN stock over the past year. After a remarkable annual gain of 342%, the stock experienced a sharp 15.8% decline following the Q2 2025 earnings release. This drop reflected a sudden shift in market sentiment as palladyne reported disappointing financial results. The stock’s price action shows how quickly investor confidence can change in response to new information.
To help you understand the recent stock performance, review the table below. It summarizes the number of new highs and lows, along with the percent changes from those points, over several periods:
| Period | Number of New Highs | Percent Change from Last Price at Highs | Number of New Lows | Percent Change from Last Price at Lows |
|---|---|---|---|---|
| 6-Month | 3 | Approximately -41.31% | 10 | Approximately +57.97% |
| 1-Month | 4 | Approximately -41.31% | 4 | Approximately +9.78% |
| 3-Month | 13 | Approximately -41.31% | 1 | Approximately +32.24% |
| 5-Day | 1 | -13.00% | 2 | +9.78% |
The 52-week high stands at $14.95, while the 52-week low is $1.38. The last recorded price is $7.63. These figures highlight the high volatility and the wide trading range that you must consider when evaluating palladyne’s trend.
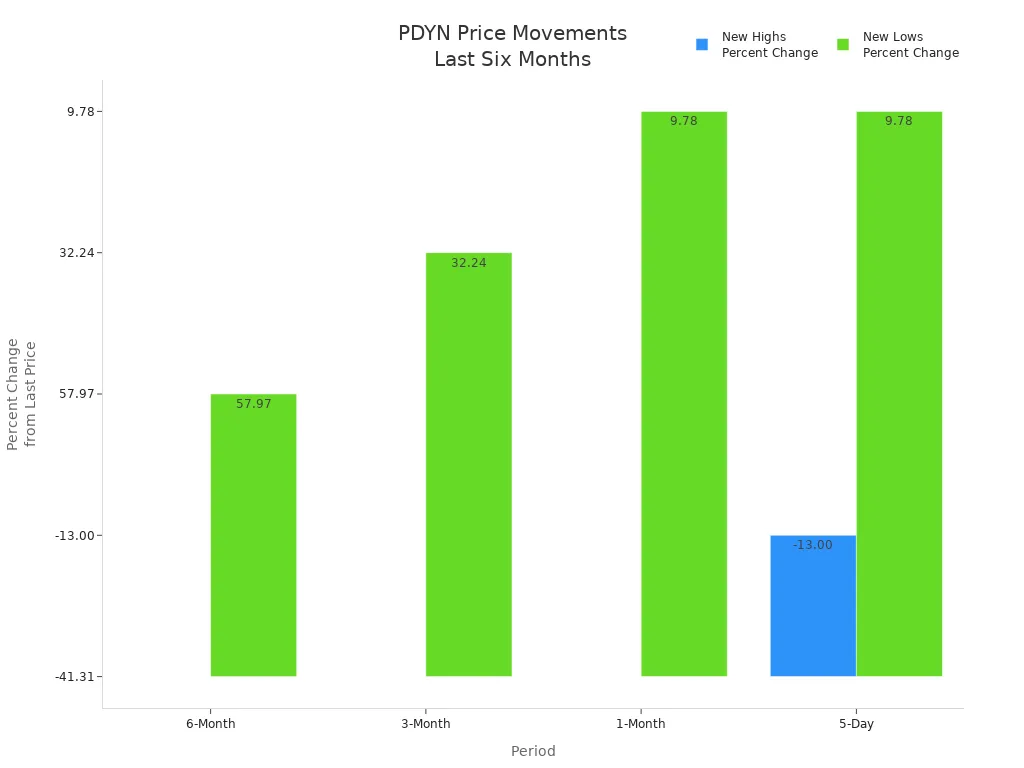
You can see from the chart that PDYN stock has experienced frequent swings between new highs and lows. This pattern signals a market that reacts quickly to news and company developments.
Short-term forecasts remain optimistic despite recent setbacks. Analysts have set a consensus price target of $15.00, which suggests a potential upside of nearly 97% from the current price. The consensus rating ranges from ‘Buy’ to ‘Strong Buy.’ This positive outlook reflects confidence in palladyne’s ability to recover from recent losses and capitalize on growth opportunities in the AI sector.
Volume and Volatility
Trading activity in PDYN stock has remained robust. Over the past quarter, the average daily trading volume reached approximately 3.47 million shares. This high volume indicates strong interest from both institutional and retail investors. You should pay attention to these volume levels, as they often signal increased liquidity and the potential for rapid price movements.
The trend of high volatility has persisted throughout 2025. For example, after the Q2 2025 earnings announcement, the stock dropped 12.15% in a single day and 7.29% over five days. Earlier in the year, positive company news led to a 17.90% surge in one day. These sharp moves show that palladyne’s stock performance is highly sensitive to earnings reports and strategic updates.
You will notice that technical analysis points to active trading around key levels, such as $10.60. The stock has repeatedly tested this level, reflecting strong trader interest and the influence of short-term sentiment. When you track these patterns, you gain insight into the underlying trend and can better anticipate future price action.
Note: PDYN stock’s volatility creates both risks and opportunities. You should monitor trading volume and price reactions to news closely. This approach helps you navigate the rapid changes that define the current trend in palladyne’s stock.
Technical Analysis

Image Source: pexels
Support and Resistance
You need to watch several key support and resistance levels when trading PDYN stock. Technical analysis reports highlight the following zones:
- Resistance levels: 8.17, 6.28, 5.88
- Support levels: 5.28, 5.67, 5.83
Fibonacci analysis adds more detail. You see resistance near 7.68, 7.75, and 7.88, while support appears at 7.24, 7.36, and 7.44. Accumulated volume shows resistance at 8.23, 8.92, and 9.17, with support at 7.23, 7.45, and 7.53. The current price sits around 7.63. These levels help you spot reversal points and plan your next move.
Tip: You can use these support and resistance levels to set your entry and exit points. If the price approaches resistance, consider a sell strategy. If it nears support, a buy strategy may be more effective.
Buy and Sell Signals
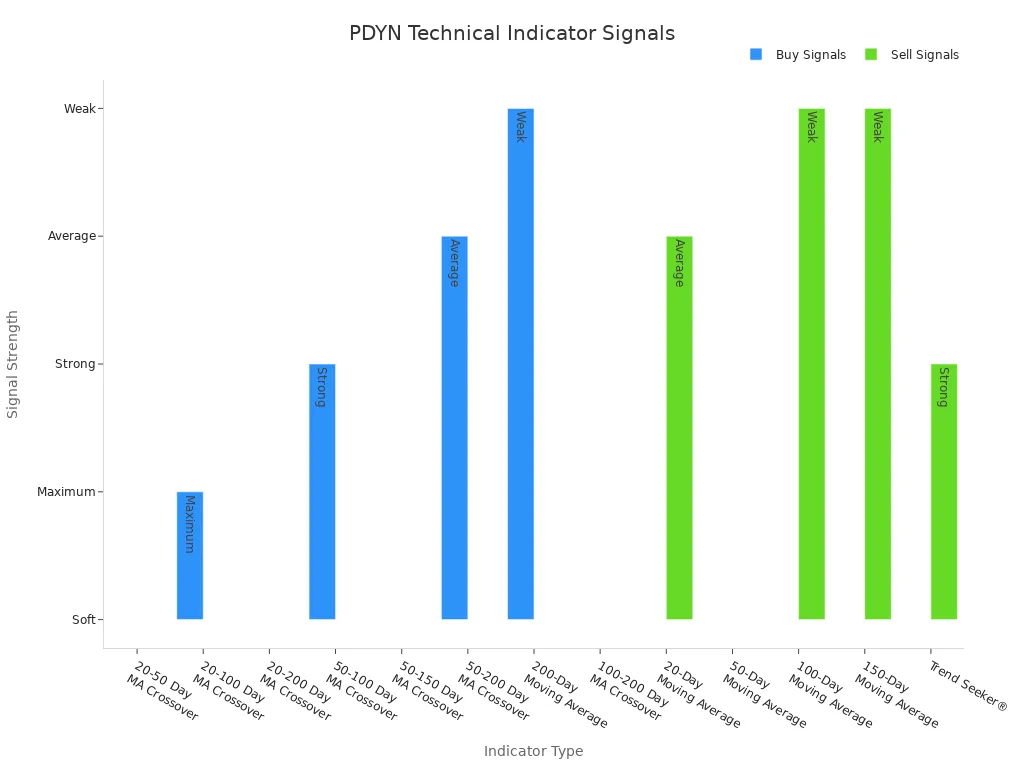
Technical indicators give you mixed signals for PDYN stock. Moving averages and crossovers show both buy and sell opportunities. The table below summarizes recent signals:
| Time Frame | Indicator Type | Signal | Strength | Notes |
|---|---|---|---|---|
| Short-Term | 20-Day MA | sell | Average | Single MA signals sell |
| Short-Term | 20-50 Day MA Crossover | buy | Soft | Buy signal from crossover |
| Short-Term | 20-100 Day MA Crossover | buy | Maximum | Strong buy signal from crossover |
| Medium-Term | 50-Day MA | sell | Soft | Single MA signals sell |
| Medium-Term | 50-100 Day MA Crossover | buy | Strong | Buy signal from crossover |
| Long-Term | 100-Day MA | sell | Weak | Single MA signals sell |
| Composite | Trend Seeker® | sell | Strong | Overall composite indicator signals sell |
Momentum indicators such as MACD, STOCH, and Williams %R suggest buy signals, while moving averages and rate of change point to sell signals. The composite Trend Seeker® indicator strongly recommends a sell approach. You should pay close attention to these signals before making a decision.
Risk Factors
You face several risks when trading PDYN stock. Geopolitical and macro-economic factors such as inflation, tariffs, interest rates, oil prices, unemployment, and international conflicts can affect the company’s operations. Financial risks include a history of losses and negative cash flows, which may continue. If the company raises funds through loans, you may see increased costs and restrictive terms. Valuation risks also exist due to complex financial instruments like the 2024 Warrants, which depend on assumptions that could change.
Note: You should always consider these risks before you decide to buy or sell PDYN stock. Staying informed helps you manage your exposure and respond to changes in the trend.
Palladyne Recent Developments
Q2 2025 Earnings
You need to pay close attention to the latest financial snapshot from palladyne. The company reported total revenue of $1.01 million in Q2 2025, which marks a 62.6% decline compared to the same period last year. Net loss widened to $7.49 million, up 40.7% from $5.32 million in Q2 2024. This sharp drop in revenue and the growing net loss highlight the challenges palladyne faces as it transitions its business model.
You can see the impact of these changes in the table below. It summarizes the main financials and operational metrics for Q2 2025:
| Metric | Q2 2025 Value | Comparison / Notes |
|---|---|---|
| Total Revenue | $1 million | 63% decrease from $2.7 million in Q2 2024 |
| Product Development Contract Revenue | Significant decline | Major contributor to revenue drop |
| Product Revenue | 100% decline | Due to discontinuation of legacy hardware sales |
| Backlog (June 30, 2025) | $1.7 million | About half expected to be recognized within 12 months |
| Operating Expenses | $9.1 million | 7% increase year-over-year |
| R&D Spending | Increased by 33% | Due to product testing and enhancements |
| Sales Cycle | 12-18 months | Long sales cycle impacting contract timing |
| Revenue Outlook | Modest growth expected in 2025 | More gradual ramp in 2026 anticipated |
Note: The slowdown in contract activity and the end of legacy hardware sales have put pressure on palladyne’s financials. You should monitor how the company manages expenses and adapts its revenue streams in the coming quarters.
Strategic Pivot to AI Automation
You see palladyne making a bold move into transformative ai implementations. The company has shifted its focus from hardware to advanced ai software platforms, such as Palladyne IQ and Palladyne Pilot. These platforms enable industrial robots and drones to perform complex tasks autonomously, reducing the need for manual programming and increasing efficiency.
Palladyne achieved key milestones in automating surface finishing tasks, like autonomous media blasting and sanding, using its ai software on industrial robots. The U.S. Air Force provided additional funding, which validates the technical strength and operational value of palladyne’s solutions. The software now operates on edge devices and supports industries such as aviation, defense, manufacturing, and logistics.
You should note that palladyne is expanding its commercial pipeline and forming new partnerships. The company is working with drone manufacturers, integrators, and defense contractors to scale its ai platforms. A multi-year contract with the U.S. Air Force for autonomous aircraft maintenance demonstrates the real-world benefits of its technology. Palladyne is also investing in marketing and sales to secure more customers and has filed an “at-the-market” equity offering to support strategic relationships and acquisitions.
Tip: The shift toward ai automation positions palladyne to benefit from trends like reshoring, increased defense spending, and modernization in public safety. You should watch for updates on new contracts and product launches, as these could drive future growth.
Analyst Ratings
You should consider the current analyst consensus when evaluating palladyne’s recent developments. The stock holds a ‘Buy’ rating with an average score of 3.00. One analyst covers the stock, and there are no hold or sell ratings. The average price target stands at $15.00, which suggests a potential upside of nearly 97% from current levels.
Palladyne has also announced several important partnerships. The company completed a successful autonomous drone flight with Red Cat Holdings, using its Pilot ai software to enable real-time detection and tracking with multiple drones. This collaboration aims to enhance autonomous drone capabilities for both military and civil customers. In another partnership, palladyne joined with Mobilicom to combine its ai autonomy software with Mobilicom’s cybersecurity platform. This bundled solution delivers secure, autonomous operations for defense and commercial environments.
Note: Analyst optimism and new partnerships signal confidence in palladyne’s strategy. You should track these alliances and analyst updates to gauge market sentiment and potential catalysts for the stock.
Outlook for Investors
Sentiment and Forecasts
You see a mixed and cautious mood among investors when it comes to PDYN stock. The market reacts to both the promise of new AI breakthroughs and the reality of recent setbacks. Here are the main factors shaping sentiment:
- The stock dropped by 9.24% after news of data security flaws in its AI systems. This raised concerns about privacy and trust.
- Financial data shows operational losses, a high price-to-sales ratio of 32.74, and negative operating cash flow of -$4.5 million. These numbers point to overvaluation and liquidity challenges.
- Despite these issues, you notice continued interest from investors who believe in palladyne’s AI innovation.
- Market sentiment remains volatile. You see both risk and hope as investors weigh the company’s potential against its financial instability.
- Regulatory changes, leadership speculation, and competitive pressure add to the uncertainty. Recent institutional investor share sell-offs also affect confidence.
- The stock’s price swings reflect both doubt and ambition. Some investors hope for recovery as palladyne advances its AI technology.
Note: You should approach PDYN stock with caution. The outlook depends on how well palladyne addresses its financial and technical challenges.
Cash Burn and Runway
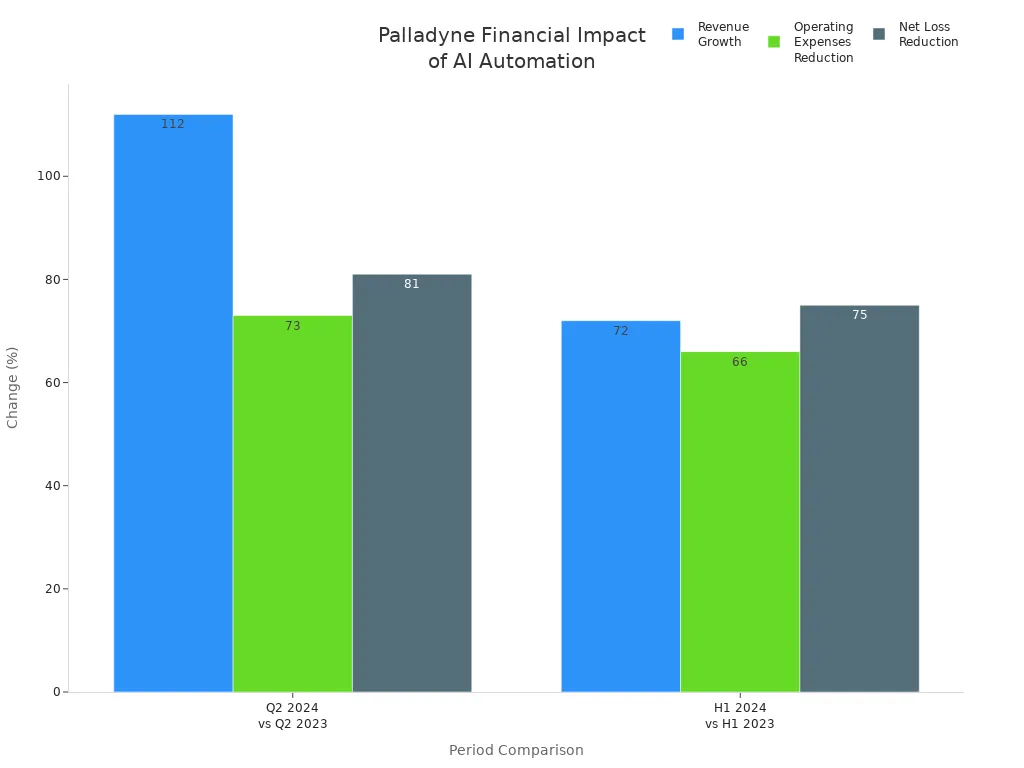
You need to keep a close eye on palladyne’s cash position. As of early 2025, the company holds about $54.5 million in cash reserves. The monthly cash burn rate has improved to between $1.6 million and $2.0 million. Operating expenses dropped by 73% year-over-year, which helps stretch available funds. Based on these numbers, palladyne has a financial runway of about two years. This gives the company time to execute its AI strategy and pursue new opportunities.
Tip: You should monitor cash flow reports and expense trends. These will show if palladyne can maintain its runway or if new funding will be needed.
Opportunities and Risks
You face a high-risk, high-reward scenario with PDYN stock. Consider these key points:
- Revenue fell by 63% year-over-year, and net losses reached $7.5 million in Q2 2025.
- The sales cycle lasts 12–18 months, which delays revenue.
- Palladyne competes with large companies in the AI space, such as Siemens, Rockwell Automation, ABB, and Microsoft-Siemens partnerships.
- The company relies on non-operating gains and equity raises, which raises questions about its business model.
- Success depends on the timely launch of Version 2 of Palladyne IQ and converting the $1.7 million backlog into revenue.
- New contracts in 2026 are needed for growth.
- The price-to-sales ratio stands at 72.3, showing high growth expectations.
- Liquidity management is critical, given the current cash burn rate.
Note: You should weigh the opportunities in AI automation against the risks of financial instability and strong competition. Stay alert to updates on contracts, product launches, and financial performance.
You should focus on the sharp revenue decline and ongoing losses shown in Q2 2025 results:
| Metric | Q2 2025 Value | Year-over-Year Change | Notes |
|---|---|---|---|
| Revenue | $1.01 million | -62.6% | Missed estimates |
| Net Loss | $7.49 million | -40.65% (worsened) | Substantial losses continue |
| EPS | -0.20 | 0.00% | Missed estimates |
Palladyne’s strong cash position and strategic shift to AI automation offer growth potential, but you must watch for upcoming announcements like the Palladyne IQ Version 2 release. Monitor analyst ratings, cash flow, and company news. Balancing short-term volatility with long-term opportunity requires discipline, risk management, and ongoing research.
FAQ
What caused the recent drop in PDYN stock?
You saw PDYN stock fall after Q2 2025 earnings. The company reported a 63% revenue decline and a larger net loss. Investors reacted quickly to these negative results.
How does PDYN’s cash position affect its future?
You should watch the cash reserves closely. Palladyne holds about $54.5 million in cash. This gives the company a two-year runway to fund operations and pursue growth. See current USD exchange rates.
What are the main risks for PDYN investors?
You face risks from ongoing losses, high cash burn, and strong competition in the AI sector. Regulatory changes and market volatility can also impact your investment.
How important are new contracts for PDYN’s growth?
You need to see new contracts for revenue growth. The company relies on converting its $1.7 million backlog and securing more deals, especially in 2026.
What should you monitor before investing in PDYN?
You should track cash flow, analyst ratings, and company announcements. Watch for updates on product launches and new partnerships. These factors can influence the stock’s direction.
PDYN stock presents a challenging but potentially rewarding investment. On one hand, you face significant risks from volatile market swings, a sharp decline in recent revenue, and ongoing financial losses. On the other, the company’s strong cash position and strategic pivot into AI automation offer a compelling long-term narrative. Navigating this high-stakes environment requires not only a disciplined strategy but also a seamless and reliable trading platform. For international investors, managing these risks is even more critical. BiyaPay provides the perfect solution, enabling you to buy US stocks like PDYN without the friction of traditional international banking. Our platform simplifies the process with low, transparent fees and a real-time exchange rate converter so you can focus on monitoring the company’s progress, not on complex financial logistics. Stay ahead of market shifts and take control of your financial future. Register with BiyaPay today to start trading.
*This article is provided for general information purposes and does not constitute legal, tax or other professional advice from BiyaPay or its subsidiaries and its affiliates, and it is not intended as a substitute for obtaining advice from a financial advisor or any other professional.
We make no representations, warranties or warranties, express or implied, as to the accuracy, completeness or timeliness of the contents of this publication.


Contact Us
Company and Team
BiyaPay Products
Customer Services


is a broker-dealer registered with the U.S. Securities and Exchange Commission (SEC) (No.: 802-127417), member of the Financial Industry Regulatory Authority (FINRA) (CRD: 325027), member of the Securities Investor Protection Corporation (SIPC), and regulated by FINRA and SEC.
registered with the US Financial Crimes Enforcement Network (FinCEN), as a Money Services Business (MSB), registration number: 31000218637349, and regulated by FinCEN.
registered as Financial Service Provider (FSP number: FSP1007221) in New Zealand, and is a member of the Financial Dispute Resolution Scheme, a New Zealand independent dispute resolution service provider.