- EasyCard
- Trade
- Help
- Announcement
- Academy
- SWIFT Code
- Iban Number
- Referral
- Customer Service
- Blog
- Creator
What Makes ITOT Stock a Popular Choice for U.S. Market Exposure


Image Source: pexels
You choose ITOT stock because it gives you broad exposure to the U.S. market with more than 3,500 stocks in one ETF. ITOT stands out for its very low expense ratio and strong risk-adjusted performance. The ETF offers you a cost of just 0.03%, which is much lower than many other popular funds. You get similar returns and volatility compared to leading ETFs like SPY.
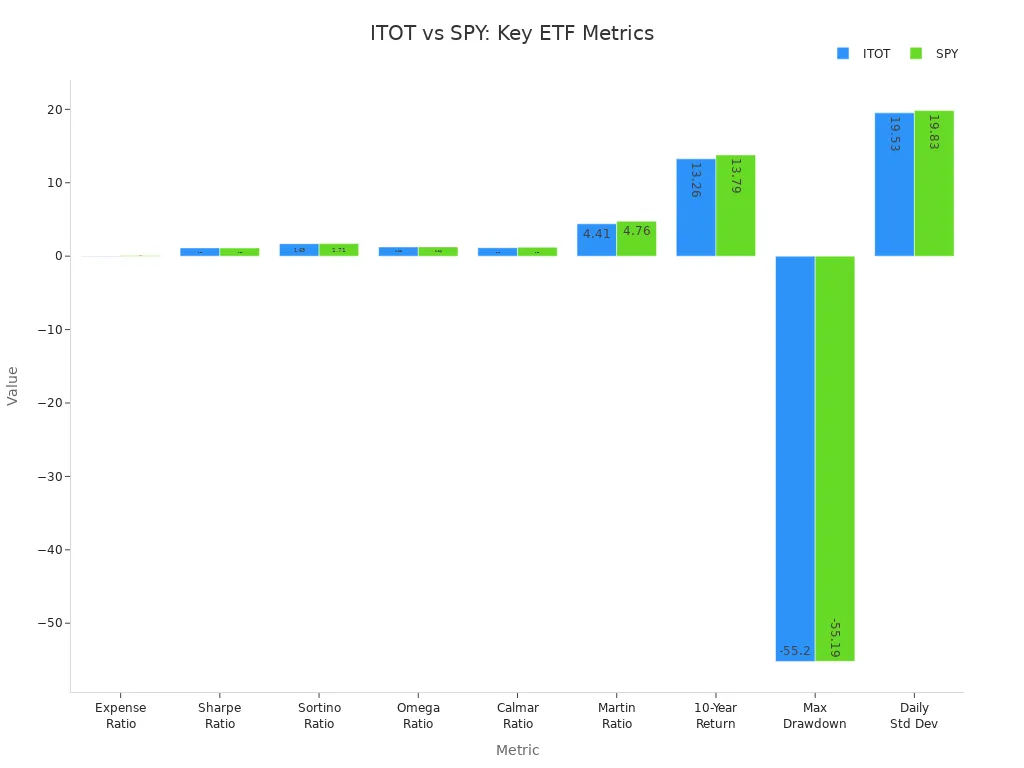
| Metric | ITOT Value | SPY Value | Context/Comparison |
|---|---|---|---|
| Expense Ratio | 0.03% | 0.09% | ITOT’s expense ratio is significantly lower than SPY’s and well below the broader market average (0.3% to 0.9%). |
| Sharpe Ratio (12 months) | 1.13 | 1.12 | ITOT’s risk-adjusted performance is comparable to SPY’s. |
| Sortino Ratio | 1.69 | 1.71 | Very close risk-adjusted performance. |
| Omega Ratio | 1.25 | 1.26 | Comparable risk-adjusted performance. |
| Calmar Ratio | 1.15 | 1.21 | Slightly lower but similar performance. |
| Martin Ratio | 4.41 | 4.76 | Comparable risk-adjusted performance. |
| 10-Year Annualized Return | 13.26% | 13.79% | ITOT’s long-term returns are slightly below SPY’s but very close. |
| Max Drawdown | -55.20% | -55.19% | Risk metrics and drawdowns are nearly identical. |
| Daily Std Dev | 19.53% | 19.83% | Similar volatility profiles. |
Key Takeaways
- ITOT offers broad exposure to the entire U.S. stock market with over 3,500 stocks in one low-cost ETF.
- The ETF has an ultra-low expense ratio of 0.03%, helping you keep more of your investment gains.
- ITOT provides strong long-term performance and steady dividend income, making it a reliable core holding.
- You get diversified access to large, mid, small, and micro-cap companies across all major sectors.
- ITOT is easy to trade with good liquidity and works well for both beginners and experienced investors.
ITOT Stock Overview
Image Source: unsplash
What Is ITOT
You may wonder what ITOT stock actually is. ITOT stands for the iShares Core S&P Total U.S. Stock Market ETF. You can find this ETF on the NYSE Arca exchange under the ticker symbol ITOT. When you invest in ITOT, you gain access to a fund that tracks the S&P Total Market Index. This index covers a wide range of U.S. equities, including large-cap, mid-cap, small-cap, and even micro-cap companies. You do not have to pick individual stocks to get exposure to the entire U.S. market. Instead, you can own a single ETF that holds thousands of stocks for you.
The total net asset value of ITOT is about $72.58 billion. Over the past five years, this value has grown by 83.77%. This growth shows that more investors trust ITOT as a way to invest in the U.S. market. You can see that ITOT has become a major player among ETFs that focus on U.S. stocks.
iShares Core S&P Total U.S. Stock Market ETF Features
When you look at the features of the iShares Core S&P Total U.S. Stock Market ETF, you notice its broad coverage. ITOT includes 2,467 individual stocks. Most of these are large-cap companies, which make up 91.7% of the holdings. Mid-cap stocks account for 5.7%, and small-cap stocks make up 1.4%. This breakdown means you get a strong focus on large, stable companies, but you also get some exposure to smaller, faster-growing firms.
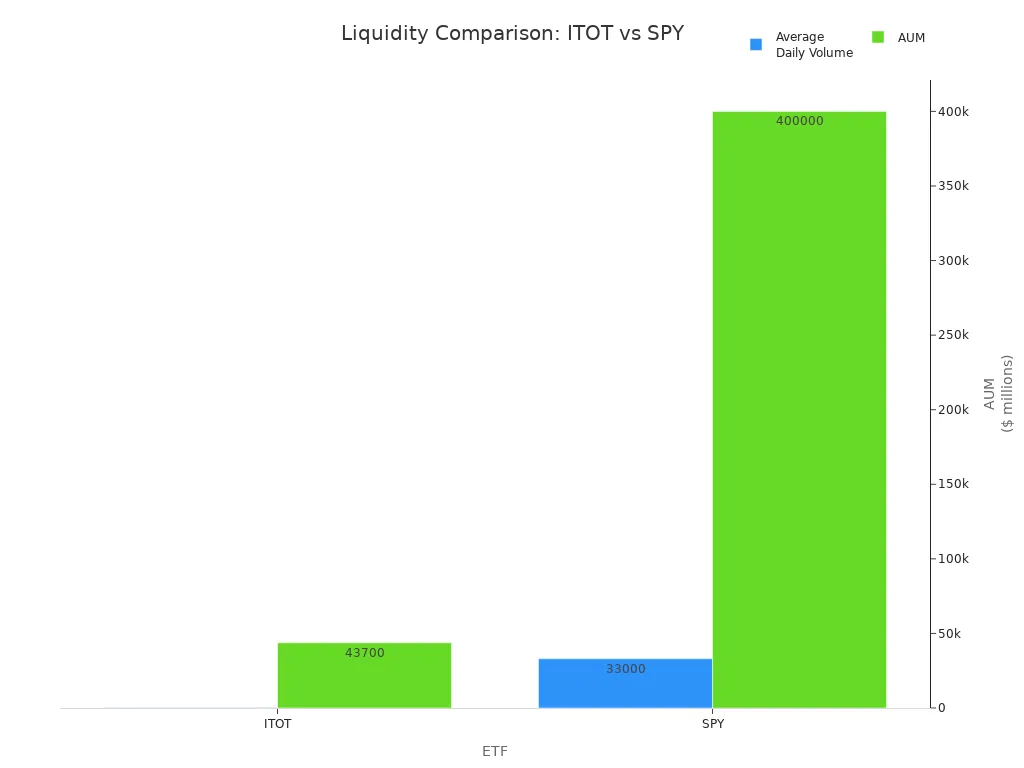
You benefit from ITOT’s listing on NYSE Arca, which makes it easy to buy and sell shares. The ETF offers high liquidity, so you can trade without worrying about large price swings. While ITOT’s average daily trading volume is about $92 million, it is not as high as some other ETFs like SPY, which has a much larger daily volume. Still, ITOT gives you enough liquidity for most investment needs.
| Metric | ITOT | SPY |
|---|---|---|
| Average Daily Volume | Approximately $92 million | Approximately $33 billion |
| Assets Under Management (AUM) | Approximately $43.7 billion | Approximately $400 billion |
You get a simple way to invest in the whole U.S. market with ITOT. The ETF’s structure helps you avoid the risk of missing out on any major sector or company. You can use ITOT stock as a core part of your investment portfolio. The iShares Core S&P Total U.S. Stock Market ETF gives you a low-cost, diversified, and easy-to-trade option for U.S. market exposure.
Diversification and Market Exposure

Image Source: pexels
Holdings and Sector Allocation
You get access to a wide range of stocks when you invest in the ITOT ETF. The fund includes 2,476 U.S. common equities in its holdings. This means you own shares in almost every company listed on major U.S. exchanges. You do not need to worry about missing out on important sectors or companies. The ETF gives you a complete view of the U.S. stock market.
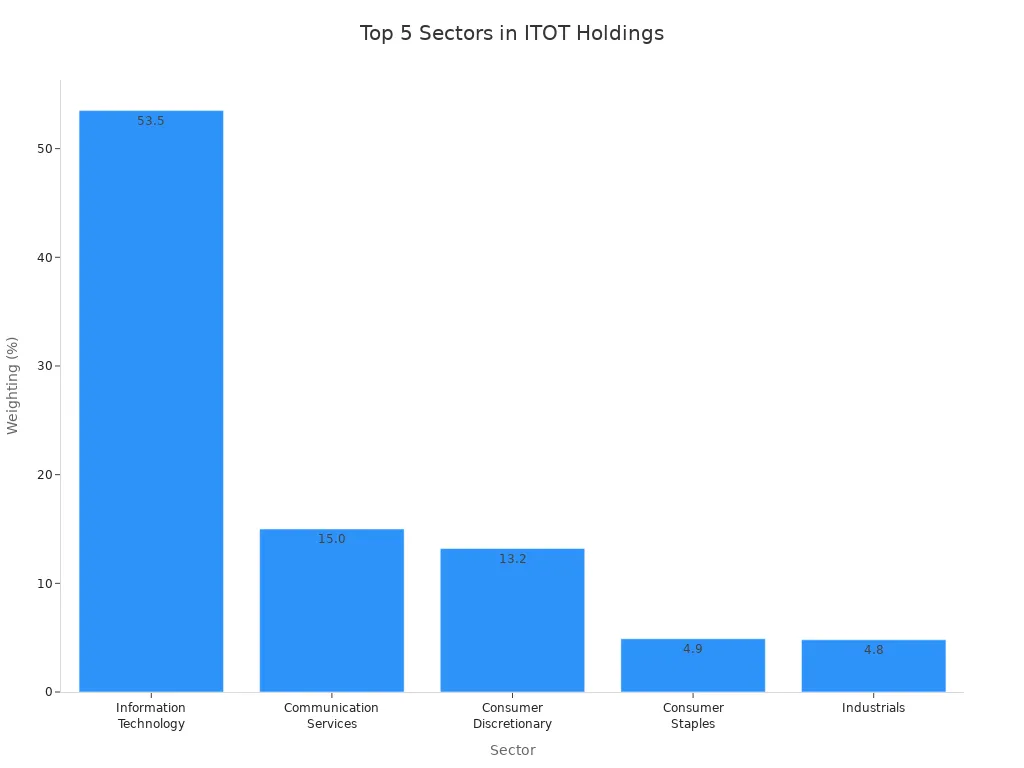
Let’s look at the holdings analysis for ITOT. The top five sectors make up most of the ETF’s portfolio. Information Technology leads with 53.5% of the holdings. Communication Services follows with 15.0%. Consumer Discretionary accounts for 13.2%. Consumer Staples and Industrials make up 4.9% and 4.8%, respectively. You can see the breakdown in the table below:
| Sector | Weighting (%) |
|---|---|
| Information Technology | 53.5 |
| Communication Services | 15.0 |
| Consumer Discretionary | 13.2 |
| Consumer Staples | 4.9 |
| Industrials | 4.8 |
This holdings analysis helps you understand where your money goes. You see strong exposure to technology and communication, which drive much of the U.S. market’s growth.
Market Coverage
You benefit from ITOT’s broad market coverage. The ETF tracks the S&P Total Market Index, which includes all U.S. common equities listed on major exchanges. This approach means you get nearly 100% coverage of the U.S. stock market. You do not need to buy multiple funds to achieve full diversification. ITOT gives you exposure to large, mid, small, and micro-cap stocks in one ETF.
When you review the holdings analysis, you notice that ITOT does not exclude companies in fossil fuels or firearms. The ETF includes stocks from every sector, so you may want to consider ESG factors if these industries matter to you. Some investors prefer funds that screen out certain sectors, but ITOT aims for complete market representation.
Tip: If you want to avoid exposure to fossil fuels or firearms, you should look for an ETF with ESG screening. ITOT focuses on total market coverage and does not filter out these industries.
You get a simple way to invest in the entire U.S. market with ITOT. The ETF’s holdings analysis shows you the sector breakdown and market coverage, helping you make informed decisions.
ITOT ETF Performance and Costs
Performance
You want to know how the ITOT etf performs compared to other options. The etf tracks the S&P Total Market Index, so you get exposure to almost every U.S. stock. Over the past three years, the etf delivered a 15.66% annualized return. This performance is close to the S&P 500, which had a 16.47% annualized return in the same period. The one-year return for the etf stands at 20.42%. These numbers show that you can expect strong performance from the etf, even when compared to leading funds like SPY.
| Metric | ITOT (S&P Composite 1500) | SPY (S&P 500) |
|---|---|---|
| 3-Year Annualized Return | 15.66% | 16.47% |
| 1-Year Return | 20.42% | 20.80% |
| Expense Ratio | 0.03% | 0.09% |
All returns and expense ratios are in USD. See current USD exchange rate.
You also want to consider risk. The etf has a standard deviation similar to the S&P 500, which means the price does not swing much more than the market average. This helps you manage risk while still aiming for solid performance. The etf’s low turnover rate, about 8% or less, means fewer trades and less chance for large price changes. You get a stable investment that tracks the market closely.
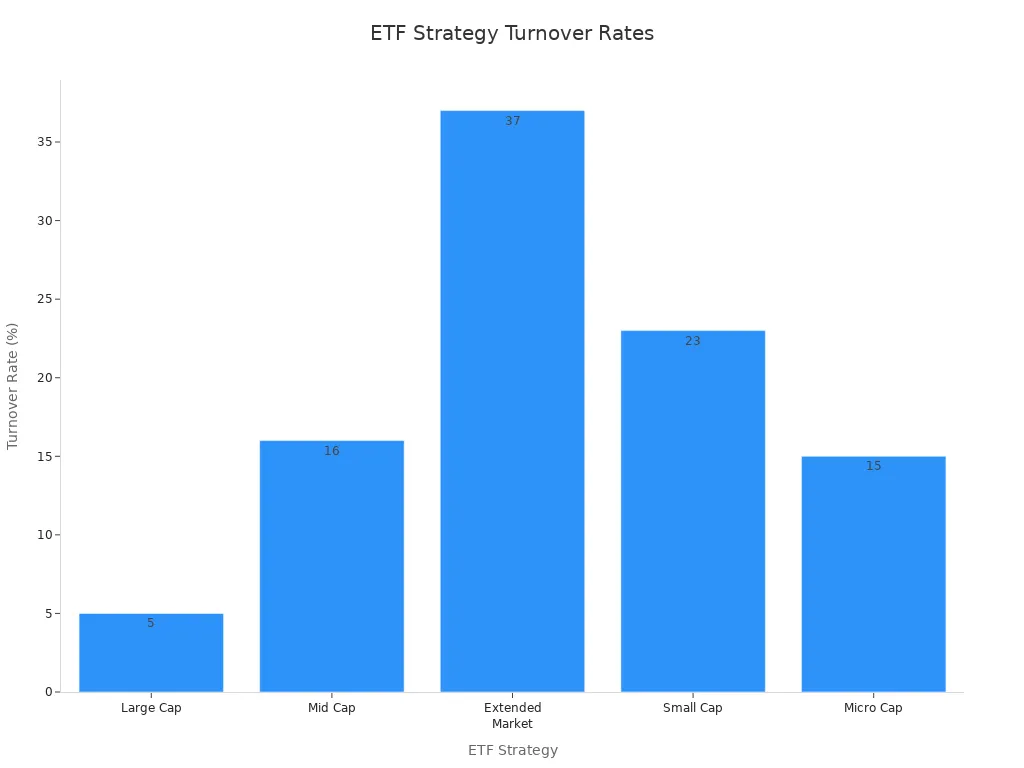
Note: The low turnover rate of the etf helps you keep more of your gains. Fewer trades mean fewer taxable events, which can improve your after-tax performance.
Expense Ratio and Dividends
You want to keep your costs low when you invest. The etf charges an expense ratio of just 0.03% per year in USD. This is much lower than the average for most funds, which often ranges from 0.3% to 0.9%. You can see how the etf compares to other popular funds in the table below:
| ETF | Expense Ratio (USD) | Comparison to Market Average |
|---|---|---|
| ITOT | 0.03% | Much lower |
| VTI | 0.03% | Much lower |
| SCHB | 0.03% | Much lower |
Expense ratios are in USD. See current USD exchange rate.
You also receive a quarterly dividend from the etf. The current quarterly dividend yield is about 1.20% in USD. Over the past year, the etf paid $1.68 per share in dividends. The dividend payout has grown by 7.55% in the last year, which shows steady growth. The table below gives you a quick look at the dividend details:
| Metric | Value (USD) |
|---|---|
| Current Quarterly Dividend Yield | ~1.20% |
| Dividend Paid per Share (Past Year) | $1.68 |
| Dividend Payout Frequency | Quarterly |
| Last Ex-Dividend Date | June 16, 2025 |
| Dividend Growth (1 Year) | 7.55% |
Dividend values are in USD. See current USD exchange rate.
You benefit from the etf’s low price and steady dividend payments. The etf’s price stays close to its net asset value, so you do not pay a premium when you buy shares. The low expense ratio means you keep more of your investment gains. The quarterly dividend gives you regular income, and the steady growth in the dividend shows the etf’s strength.
You also get tax efficiency with this etf. The low turnover rate means the etf does not trade stocks often, so you face fewer taxable events. This helps you keep more of your after-tax returns. The etf’s structure and low price make it a smart choice for long-term investors who want to track the U.S. market.
Tip: If you want a low-cost, broad-market etf with steady dividend income and strong performance, ITOT gives you all these benefits in one package.
Comparing ITOT to Other ETFs
ITOT vs. VTI
When you compare ITOT to the Vanguard Total Stock Market ETF (VTI), you see that both funds offer broad U.S. market exposure. Each etf covers large-, mid-, small-, and micro-cap stocks. The main difference comes from the number of holdings and the index each etf tracks. ITOT holds over 3,200 positions, while VTI holds over 3,800. Both have similar sector allocations, with about 73-74% in large-cap stocks, 18% in mid-cap, and 8-9% in small-cap. The analysis shows that ITOT uses the S&P Total Market Index, which does not set a minimum market cap for inclusion. VTI tracks the CRSP US Total Market Index, which requires a $15 million minimum market cap.
| ETF | Number of Holdings | Sector Coverage and Composition | Notes |
|---|---|---|---|
| ITOT | Over 3,200 | 73% large-cap, 18% mid-cap, 9% small-cap | S&P Total Market Index; no minimum market cap |
| VTI | Over 3,800 | 74% large-cap, 18% mid-cap, 8% small-cap | CRSP US Total Market Index; $15M minimum market cap |
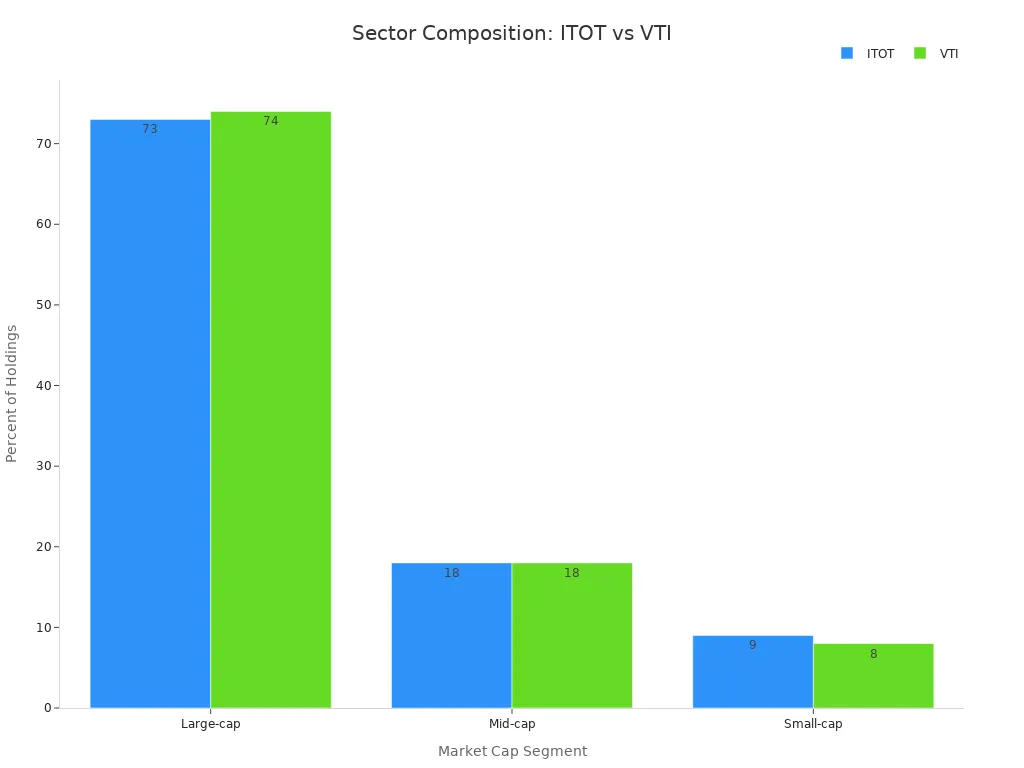
You notice that the analysis of both etfs reveals almost identical sector coverage. The main difference is that VTI includes more small companies. This may give you slightly broader diversification, but the impact on performance is minimal.
ITOT vs. SCHB
You may also consider the Schwab U.S. Broad Market ETF (SCHB) as another option. SCHB aims to track the total U.S. stock market, much like ITOT and VTI. However, detailed analysis of SCHB’s holdings and sector breakdown is not always available. You can expect SCHB to offer similar diversification and performance, but the exact number of holdings and sector weights may differ. All three etfs have low expense ratios, usually around 0.03% per year in USD. See current USD exchange rate.
Note: When you review the analysis of these etfs, you find that ITOT, VTI, and SCHB all provide strong market coverage at a low cost. The differences are small, so your choice may depend on your preferred provider or trading platform.
Unique Advantages
You get several unique benefits when you choose ITOT. The etf offers a simple structure, high liquidity, and easy trading on NYSE Arca. The analysis shows that ITOT’s sector composition matches VTI within 1%. However, ITOT has slightly fewer holdings and a marginally higher concentration in its top 10 stocks. This means you may see a bit less diversification compared to VTI.
The analysis of past performance shows that ITOT outperformed VTI in annual returns in 6 out of the last 10 years. However, VTI had a higher dividend yield in 6 of those years. If you want higher income, VTI may suit you better. If you want a straightforward etf with strong performance and a low price, ITOT stands out.
Tip: Always check the latest analysis and price before investing. Even small differences in holdings or sector weights can affect your long-term results.
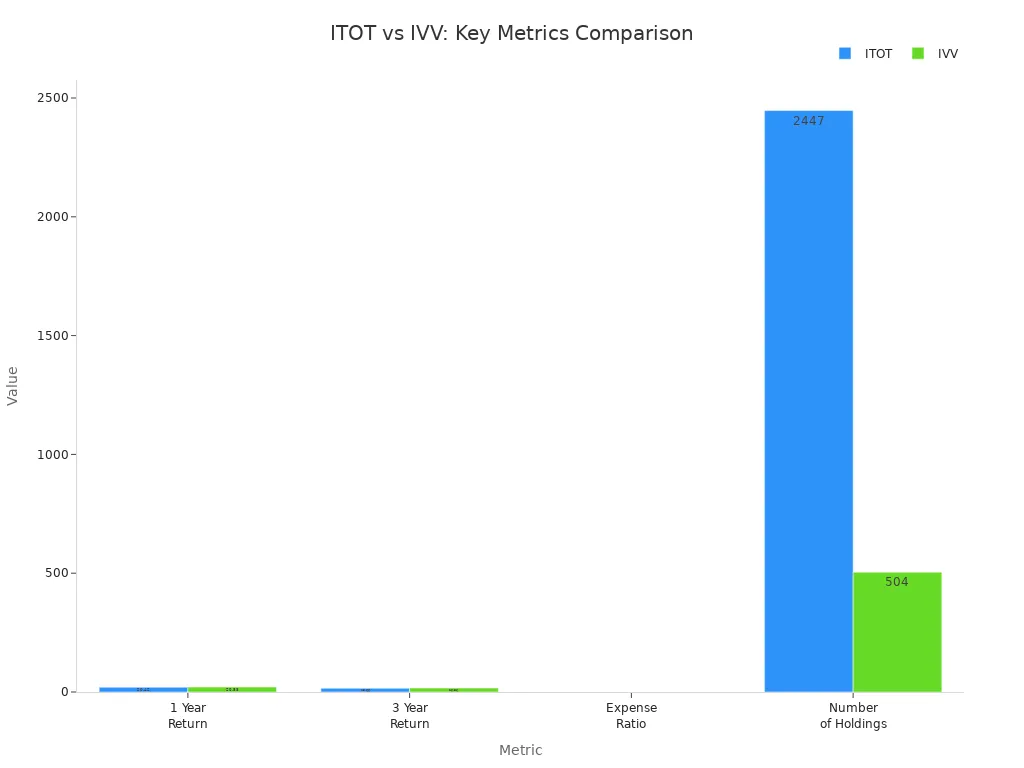
You see why many investors choose itot stock for U.S. market exposure. The etf gives you broad diversification, low cost, and strong performance. You get access to over 2,400 stocks and a 0.03% expense ratio. The etf’s long-term returns stay close to large-cap funds, as shown below:
| Metric | ITOT (Total U.S. Market ETF) | IVV (Large-Cap S&P 500 ETF) |
|---|---|---|
| 1 Year Return | 20.42% | 20.88% |
| 3 Year Return | 15.66% | 16.56% |
| Expense Ratio | 0.03% | 0.03% |
| Number of Holdings | 2447 | 504 |
Many investors pick this etf for these reasons:
- You get comprehensive diversification across the U.S. market.
- The etf offers a strong record of long-term performance.
- You benefit from ultra-low costs.
- The etf works well as a core holding for any portfolio.
You can review the fund’s latest holdings or consult a financial advisor before investing.
FAQ
What is the minimum investment for ITOT?
You can buy just one share of ITOT through your brokerage account. The price of one share changes daily. You do not need a large amount of money to start investing.
How often does ITOT pay dividends?
You receive dividends from ITOT every quarter. The fund pays out earnings from its holdings four times each year. You can check the payout dates on your broker’s website.
Can you buy ITOT in a retirement account?
You can hold ITOT in most retirement accounts, including IRAs and 401(k)s. Many investors use ITOT for long-term growth in these accounts.
Does ITOT have any ESG screening?
You do not get ESG screening with ITOT. The fund includes all sectors, including fossil fuels and firearms. If you want ESG features, you should look for a different ETF.
Is ITOT suitable for beginners?
You can use ITOT as a core holding if you are new to investing. The fund offers broad diversification, low costs, and easy trading. Many beginners choose ITOT for simple U.S. market exposure.
ITOT stock is an excellent choice for a wide range of investors, offering a simple and cost-effective way to get broad exposure to the entire U.S. market. Its ultra-low expense ratio, strong performance, and comprehensive diversification make it an ideal core holding for any long-term portfolio. For investors outside the United States, accessing and trading US-listed ETFs like ITOT requires a reliable and efficient financial platform. BiyaPay provides a seamless solution. Our platform enables you to easily fund your account and trade US-listed stocks, including ETFs, with minimal friction. With our low fees for cross-border transactions and a transparent real-time exchange rate converter, you can preserve more of your investment gains. By simplifying the complexities of global finance, BiyaPay empowers you to focus on your long-term investment goals and build a robust portfolio. Take control of your financial future and begin your investment journey. Register with BiyaPay today.
*This article is provided for general information purposes and does not constitute legal, tax or other professional advice from BiyaPay or its subsidiaries and its affiliates, and it is not intended as a substitute for obtaining advice from a financial advisor or any other professional.
We make no representations, warranties or warranties, express or implied, as to the accuracy, completeness or timeliness of the contents of this publication.


Contact Us
Company and Team
BiyaPay Products
Customer Services


is a broker-dealer registered with the U.S. Securities and Exchange Commission (SEC) (No.: 802-127417), member of the Financial Industry Regulatory Authority (FINRA) (CRD: 325027), member of the Securities Investor Protection Corporation (SIPC), and regulated by FINRA and SEC.
registered with the US Financial Crimes Enforcement Network (FinCEN), as a Money Services Business (MSB), registration number: 31000218637349, and regulated by FinCEN.
registered as Financial Service Provider (FSP number: FSP1007221) in New Zealand, and is a member of the Financial Dispute Resolution Scheme, a New Zealand independent dispute resolution service provider.