- EasyCard
- Trade
- Help
- Announcement
- Academy
- SWIFT Code
- Iban Number
- Referral
- Customer Service
- Blog
- Creator
What Makes UDOW Stock Move and How to Respond


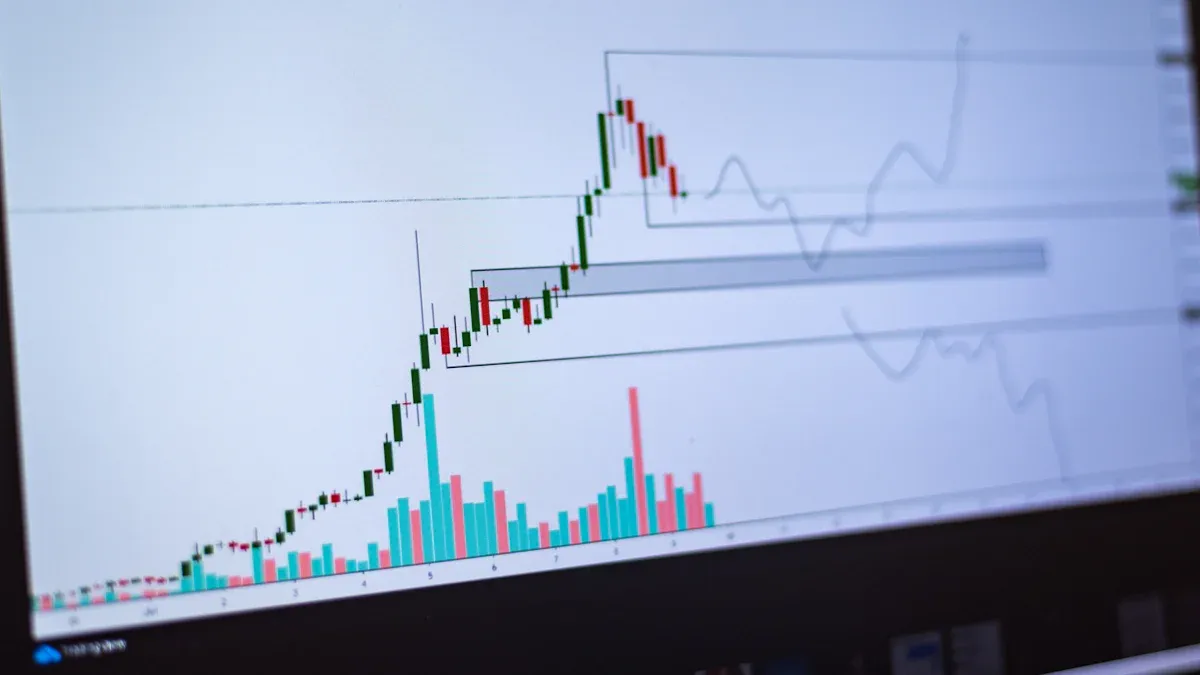
Image Source: pexels
The price of udow stock moves almost entirely in sync with the Dow Jones Industrial Average. The proshares ultrapro dow30 etf achieves this by seeking three times the daily performance of the DJIA. Over the past five years, this etf has shown a perfect positive correlation with the index, meaning nearly 100% of udow stock price changes come from DJIA updates. The proshares ultrapro dow30 etf uses financial instruments to amplify both gains and losses. Market updates and volatility can cause large swings in the etf, making up-to-date information critical for anyone considering an investment in udow stock. Investors should monitor proshares ultrapro dow30 etf updates closely, as price movements can be rapid and significant.
Key Takeaways
- UDOW stock moves closely with the Dow Jones Industrial Average, aiming to deliver three times its daily performance using financial derivatives.
- The fund resets its leverage daily, which can cause gains or losses to compound and may lead to underperformance during volatile markets.
- High volatility amplifies both gains and losses in UDOW, so investors should monitor market swings and use risk controls like stop-loss orders.
- UDOW suits short-term trading and swing trading strategies but is not ideal for long-term holding due to volatility decay and higher fees.
- Successful UDOW investing requires active monitoring of technical signals, economic indicators, and market conditions to manage risk and capture opportunities.
UDOW Stock Price Drivers
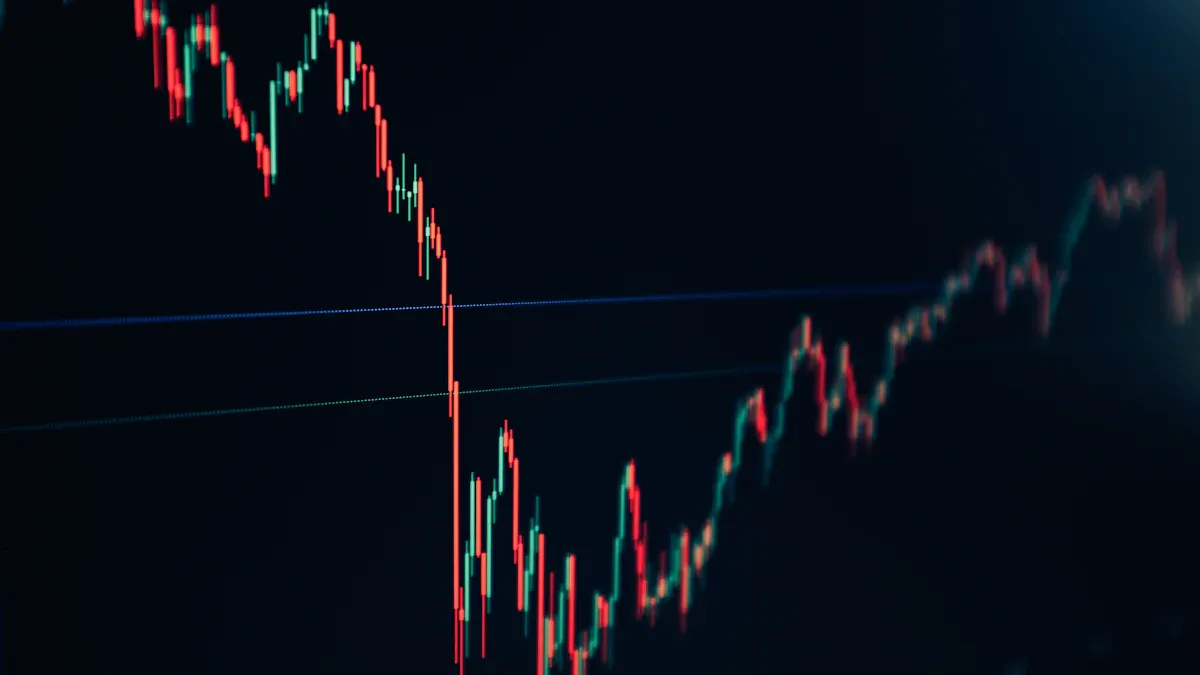
Image Source: unsplash
Market Trends
The movement of udow stock depends on the underlying trend of the Dow Jones Industrial Average. The proshares ultrapro dow30 etf aims to deliver three times the daily performance of the index. When the Dow rises, the etf amplifies gains, and when the Dow falls, losses increase at the same multiple. Investors observe the trend in the index to predict the direction of udow stock. Technical indicators such as the Relative Strength Index and Barchart Technical Opinion help identify potential reversals or continuation of the price trend. Options market sentiment, including the put/call volume ratio and open interest, also provides insight into expected price changes. The table below shows how closely the etf tracks the index:
| Fund Name | Leverage | Correlation (1yr) | Return (3mo) | Avg. Daily Volume |
|---|---|---|---|---|
| ProShares UltraPro Dow30 (UDOW) | 3x | 1.00 | 0.19% | $127,946,575 |
The proshares ultrapro dow30 etf achieves a perfect daily correlation with the Dow Jones Industrial Average. However, over longer periods, returns may diverge due to compounding and tracking errors. The average tracking error between the etf and the index over the past year is 32.13, which highlights the importance of monitoring both short-term and long-term price movements.
Leverage and Daily Reset
The proshares ultrapro dow30 etf uses financial derivatives to maintain three times leverage. Each day, the etf resets its exposure to ensure it matches the daily movement of the Dow Jones Industrial Average. This daily reset causes path-dependent drift, which can lead to underperformance over time, especially during periods of high volatility. The following points explain the impact of the daily reset mechanism:
- The etf rebalances daily to maintain 3x exposure, which can cause volatility decay and negative divergence from the expected 3x return.
- When daily market swings increase, the etf’s performance worsens compared to a simple leveraged position:
- With 1% daily moves, the etf may slightly outperform.
- With 2% daily moves, the etf can show losses even if the index gains.
- With 3% daily moves, the etf may end down, showing volatility decay.
- With 5% daily moves, the etf can suffer significant losses even if the index remains flat.
- The etf has a higher expense ratio, around 1% annually, which erodes long-term returns compared to traditional etfs.
The proshares ultrapro dow30 etf is best suited for short-term trading rather than long-term holding. Over extended periods, the combination of volatility decay and higher fees makes it less efficient for investors seeking sustained exposure to the index.
Volatility Impact
Volatility plays a major role in the price movement of udow stock. The etf’s high beta of 2.92 means it reacts strongly to changes in the broader market. During periods of increased volatility, both gains and losses are amplified. Implied volatility and historical volatility serve as forward-looking and backward-looking measures of expected price fluctuations. When the market experiences sharp swings, the etf can show large price changes in either direction.
Note: Volatility decay can hurt long-term returns, but it can also boost gains during strong upward momentum. Investors must understand that the proshares ultrapro dow30 etf magnifies both the risk and reward associated with market volatility.
Losses become more severe during downturns, while rebounds can lead to outsized gains. The etf’s structure makes it sensitive to daily price changes, so investors should monitor volatility indicators and technical signals to manage risk effectively. The amplified price swings require disciplined strategies and close attention to market conditions.
ProShares UltraPro Dow30 ETF Structure
How the ETF Achieves 3x Exposure
The proshares ultrapro dow30 etf uses a sophisticated structure to deliver three times the daily movement of the Dow Jones Industrial Average. The fund does not directly buy all the stocks in the index. Instead, it relies on financial instruments to amplify returns. The proshares ultrapro dow30 etf uses derivatives, including swap agreements and futures contracts, to replicate the desired exposure. These tools allow the etf to achieve leveraged returns without borrowing capital directly. When the Dow moves 1% in either direction, the proshares ultrapro dow30 etf aims to move about 3% in the same direction. The daily reset of leverage, combined with the use of derivatives, enables the fund to deliver its targeted exposure. This approach introduces complexities such as volatility decay and tracking error, especially over longer periods.
Compounding and Decay
The proshares ultrapro dow30 etf resets its leverage every day. This daily reset means that the etf’s returns compound over time. Compounding can cause the etf’s price to drift away from exactly three times the index’s return, especially during volatile periods. If the Dow experiences large swings, the proshares ultrapro dow30 etf may underperform or outperform the expected return. Volatility decay occurs when frequent ups and downs reduce the etf’s price, even if the index ends flat. Tracking error can also appear, causing the etf’s performance to differ from the target. Investors should monitor the etf’s price closely and understand that long-term holding increases the risk of decay.
Note: The compounding effect can benefit investors during strong, steady trends but can hurt returns when the market is choppy.
Transparency and Holdings
The proshares ultrapro dow30 etf maintains a high level of transparency. The fund publishes its holdings daily, allowing investors to see the exact mix of derivatives and assets used to achieve its goals. This transparency helps investors track the etf’s price and understand its structure. The proshares ultrapro dow30 etf also discloses its expense ratio and any changes to its strategy. Investors can review these details on the fund’s official website. By providing clear information, the proshares ultrapro dow30 etf supports informed decision-making and helps investors manage risk.
Key Investment Signals
Economic Indicators
Economic indicators play a vital role in forecasting UDOW price movements. Investors monitor data such as U.S. GDP growth, unemployment rates, and inflation reports to gauge the market’s direction. Positive forecast for the Dow Jones Industrial Average often leads to a buy signal for UDOW. When China releases trade data or updates on manufacturing output, global markets react, which can influence the upside target for UDOW. Strong support from economic growth and stable interest rates can push the index higher, creating new resistance levels. Investors use these indicators to set buy and sell targets, aiming to capture gains during periods of economic expansion.
Technical Analysis
Technical analysis provides actionable insights for UDOW trading. Moving averages offer the highest predictive value for buy signals. The table below summarizes the current moving average analysis for UDOW:
| Moving Average Period | Signal Type |
|---|---|
| MA10 | Buy |
| MA20 | Buy |
| MA50 | Buy |
| MA100 | Buy |
| MA200 | Buy |
These buy signals indicate strong support for an upside target. Oscillators such as RSI and Stochastic show neutral sentiment, suggesting limited resistance in the short term. Technical analysis helps traders identify buy opportunities and forecast resistance levels. When moving averages align with a positive forecast, traders often increase their positions, expecting further gains. Technical analysis also highlights support zones, allowing investors to set stop-loss orders and manage risk.
Tip: Traders should combine technical analysis with economic indicators to improve their forecast accuracy and identify optimal buy signals.
Volume and Liquidity
Volume and liquidity are essential for successful UDOW trading. High volume supports efficient execution and reduces slippage. The table below compares UDOW’s trading volume with other leveraged ETFs:
| ETF | 1-Month Avg Daily Volume (shares) | 3-Month Avg Daily Volume (shares) |
|---|---|---|
| UDOW | 2,381,868 | 2,045,283 |
| DDM | 311,977 | 255,958 |
UDOW’s strong volume supports active trading and provides reliable support and resistance levels. Liquidity depends on the bid-ask spread, which reflects the difference between buy and sell prices. A smaller spread means higher liquidity, allowing traders to enter and exit positions with minimal cost. High volume and tight spreads support frequent trading and help investors achieve their upside target. Monitoring volume trends and liquidity conditions enables traders to forecast price movements and identify buy signals at key support and resistance levels.
Investment Strategies for UDOW
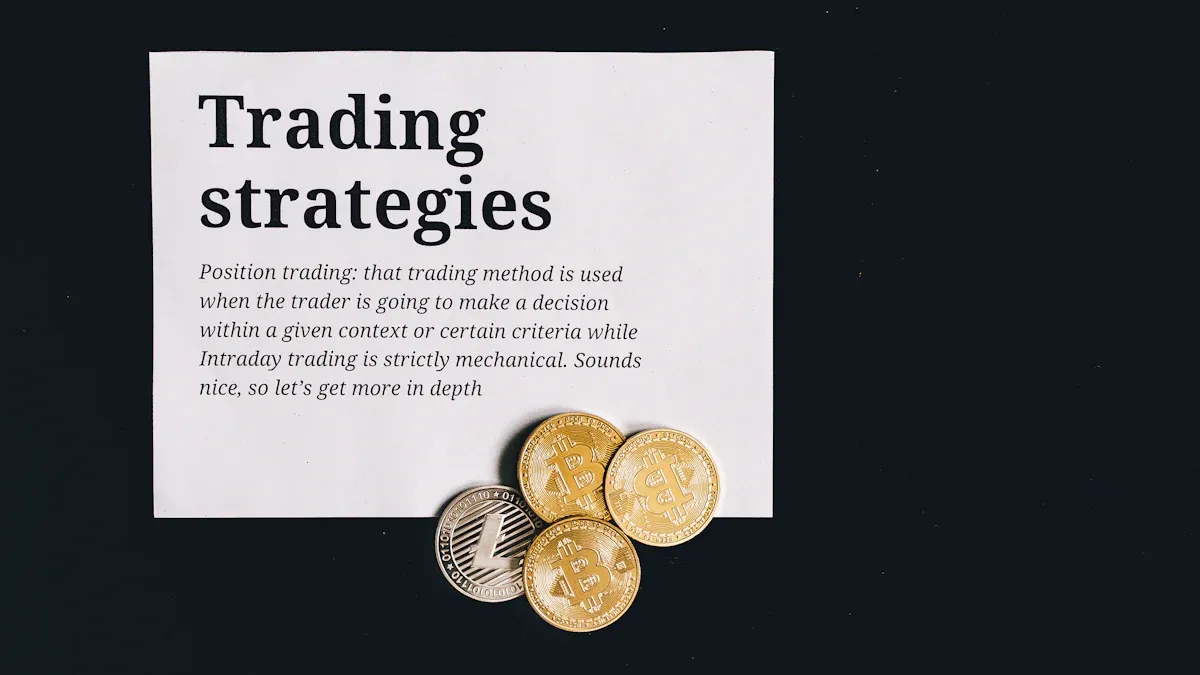
Image Source: pexels
Short-Term Trading
Short-term trading in UDOW relies on capturing rapid price movements. Traders use a trading strategy that focuses on intraday signals and technical analysis. They often buy when the price breaks above the 15-minute opening high and set a target based on resistance levels. Selling near resistance helps lock in profits and manage risk. Traders watch for short signals when the price approaches resistance or fails to break above it. They trim positions quickly if the market reverses. Short-term trading requires discipline, as holding UDOW for longer than a day can lead to losses from volatility decay. Traders use stop-loss orders to protect their capital and avoid unexpected downturns. High trading costs and fees in USD can impact returns, so traders should check current exchange rates before making large transactions.
Tip: Short-term traders should always set a clear target and sell when the price reaches resistance. They must react quickly to short signals and avoid holding positions overnight.
Swing Trading
Swing trading in UDOW aims to capture gains over several days or weeks. Traders buy when the Dow Jones Industrial Average shows a strong upward trend and set a target at the next resistance level. They monitor technical indicators to identify short signals and sell when momentum fades. UDOW’s 3x leverage can boost returns during steady trends, but traders must watch for resistance and path-dependent decay. The table below compares annualized returns for UDOW and a non-leveraged ETF:
| ETF Type | Ticker | CAGR (Annualized Return) | Years of Data |
|---|---|---|---|
| Leveraged Dow Jones ETF | UDOW | 26.31% | 12.79 |
| Non-leveraged Dow Jones ETF | DIA | 10.09% | 12.79 |
Swing traders benefit from amplified gains but face higher risks. They use short signals to exit trades before resistance causes reversals. Selling at resistance and buying at support helps maximize returns.
Risk Controls
Effective risk controls are essential for UDOW trading. Traders set stop-loss orders below support to limit losses. They sell when short signals appear or when the price hits resistance. Monitoring trading volume and liquidity helps traders avoid slippage. They adjust their target and trading strategy based on market conditions. Short-term and swing traders both use resistance levels to guide buy and sell decisions. They avoid holding UDOW during periods of high volatility, as short signals often lead to rapid declines. Traders review their strategy regularly and update their target to reflect changing market trends.
Risk Management
Stop-Loss Techniques
Stop-loss orders serve as a primary defense for UDOW investors during market downturns. Traders often set stop-loss levels below support zones to limit losses when prices move against their positions. On August 5, 2024, a volatility spike triggered stop-loss orders beyond their set levels. The trader decided to override the stop-loss and hold the position, which later proved beneficial. Stop-loss orders only activate during regular trading hours due to liquidity concerns. Traders must use discretion and intuition to avoid premature liquidation. Tighter stops reduce losses but may trigger false alarms, while wider stops risk larger losses. Investors should review stop-loss strategies regularly and adjust them based on market conditions. Sell signals often prompt traders to activate stop-loss orders and exit positions quickly.
Managing Volatility
Managing volatility in leveraged ETFs like UDOW requires active monitoring and adjustment. The table below compares volatility management for leveraged and traditional ETFs:
| Aspect | Leveraged ETFs (UDOW) | Traditional ETFs |
|---|---|---|
| Leverage | Amplifies daily returns | No leverage |
| Volatility Decay | Subject to volatility decay | Not subject to decay |
| Rebalancing | Daily resetting required | No daily resetting |
| Transaction Costs & Fees | Higher due to swaps and leverage | Lower fees |
| Volatility Management | More complex; needs active management | Standard risk management |
| Suitability | Best for experienced, short-term traders | Suitable for long-term investors |
Traders monitor price swings and adjust their positions to avoid excessive losses. They use short positions to hedge risk during turbulent markets. Sell orders help reduce exposure when volatility increases. Resistance levels guide traders in setting targets and managing risk. Leveraged ETFs demand more frequent reviews and dynamic rebalancing than traditional funds.
When to Avoid UDOW
Investors should avoid UDOW during periods of high market risk. The table below highlights risk metrics that signal increased danger:
| Risk Metric | UDOW Value | SPY Value | Interpretation |
|---|---|---|---|
| Volatility | 9.79% | 3.09% | UDOW shows greater price swings. |
| Maximum Drawdown | -80.29% | -33.72% | UDOW faces larger losses in downturns. |
| Correlation with SPY | 0.92 | N/A | UDOW moves closely with the market. |
Common mistakes include holding UDOW long term, ignoring the daily reset mechanism, and underestimating expense ratios. Morningstar and regulatory disclosures warn against buy-and-hold strategies. Traders should use UDOW for short-term tactical trades and sell positions before resistance causes reversals. Alternatives like unleveraged ETFs offer safer long-term exposure. Sell orders and short trades help manage risk and protect capital during volatile periods.
The main drivers of proshares ultrapro dow30 stock include the Dow Jones Industrial Average, leverage, and volatility. Investors should recognize that the proshares ultrapro dow30 etf offers both high reward and high risk.
- Historical data shows proshares ultrapro dow30 has delivered strong returns near support, but requires disciplined stop losses and active management.
- Financial experts stress that ongoing monitoring and adaptability are essential for leveraged etf investors, as proshares ultrapro dow30 can quickly diverge from expectations.
Advice for investors: Use real-time tools, follow technical signals, and review the proshares ultrapro dow30 etf regularly. Adapt strategies as market conditions change to meet expectations and manage risk.
FAQ
What is UDOW’s main investment objective?
UDOW seeks to deliver three times the daily performance of the Dow Jones Industrial Average. The fund uses financial derivatives to achieve this goal. Investors should expect amplified gains and losses compared to traditional ETFs.
How does daily resetting affect UDOW’s returns?
The fund resets its leverage every day. This process causes returns to compound. Over time, volatility and market swings can lead to performance that differs from three times the index.
Is UDOW suitable for long-term investors?
UDOW works best for short-term strategies. Long-term holding increases risk due to volatility decay and higher fees. Financial experts recommend using UDOW for tactical trades rather than buy-and-hold investing.
What risks should traders monitor with UDOW?
Traders should watch for volatility spikes, tracking errors, and expense ratio impact. Stop-loss orders and regular reviews help manage risk. UDOW’s structure can cause rapid price changes during market swings.
How do global events, such as China’s economic data, impact UDOW?
China’s economic reports can influence global markets. Changes in trade, manufacturing, or policy from China may affect the Dow Jones Industrial Average. UDOW’s price often reacts quickly to these shifts.
UDOW stock is a powerful tool for short-term traders who can manage its significant risks. Its 3x daily leverage offers the potential for strong gains, but it also exposes investors to volatility decay and rapid losses. Navigating these risks requires constant vigilance and a robust financial platform. For investors outside the United States, accessing and trading US-listed ETFs like UDOW requires a reliable and efficient financial platform. BiyaPay provides a seamless solution. Our platform enables you to easily fund your account and trade US-listed stocks, including high-volatility ETFs, with minimal friction. With our low fees for cross-border transactions and a transparent real-time exchange rate converter, you can execute your trades efficiently and keep your costs low. By simplifying the complexities of international finance, BiyaPay empowers you to focus on your trading strategy and risk management. Take control of your portfolio and begin your investment journey. Register with BiyaPay today.
\
*This article is provided for general information purposes and does not constitute legal, tax or other professional advice from BiyaPay or its subsidiaries and its affiliates, and it is not intended as a substitute for obtaining advice from a financial advisor or any other professional.
We make no representations, warranties or warranties, express or implied, as to the accuracy, completeness or timeliness of the contents of this publication.


Contact Us
Company and Team
BiyaPay Products
Customer Services


is a broker-dealer registered with the U.S. Securities and Exchange Commission (SEC) (No.: 802-127417), member of the Financial Industry Regulatory Authority (FINRA) (CRD: 325027), member of the Securities Investor Protection Corporation (SIPC), and regulated by FINRA and SEC.
registered with the US Financial Crimes Enforcement Network (FinCEN), as a Money Services Business (MSB), registration number: 31000218637349, and regulated by FinCEN.
registered as Financial Service Provider (FSP number: FSP1007221) in New Zealand, and is a member of the Financial Dispute Resolution Scheme, a New Zealand independent dispute resolution service provider.