- EasyCard
- Trade
- Help
- Announcement
- Academy
- SWIFT Code
- Iban Number
- Referral
- Customer Service
- Blog
- Creator
HYG Stock and Its Influence on High Yield Corporate Bond Markets


Image Source: pexels
HYG stock plays a strategic role in the high yield corporate bond market due to its size, liquidity, and benchmark status. Investors view HYG as a pioneer among high yield ETFs, often using it for exposure to high yield bonds and yield opportunities.
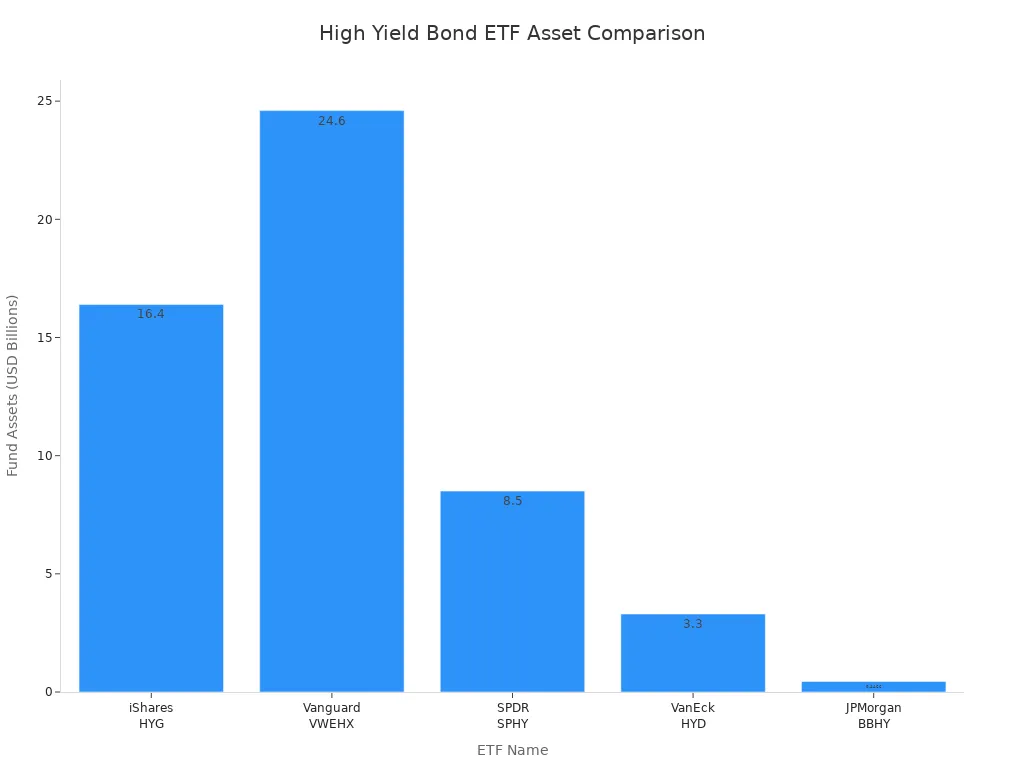
| ETF Name | Fund Assets (June 2025) |
|---|---|
| iShares iBoxx $ High Yield Corporate Bond ETF (HYG) | $16.4 billion |
| Vanguard High-Yield Corporate Fund (VWEHX) | $24.6 billion |
| SPDR Portfolio High Yield Bond ETF (SPHY) | $8.5 billion |
| VanEck High Yield Muni ETF (HYD) | $3.3 billion |
| JPMorgan BetaBuilders USD High Yield Corporate Bond ETF (BBHY) | $446.6 million |
- Liquidity in the high yield market has declined since the global financial crisis.
- HYG ETF creates an illusion of liquidity, but underlying trading volumes remain low.
- Price-to-NAV gaps in HYG stock can increase costs, especially during market stress.
Understanding HYG’s structure and market impact helps investors manage risk and seek income with high yield ETFs.
Key Takeaways
- HYG ETF offers broad, diversified access to U.S. high yield corporate bonds with monthly income payments.
- The fund provides strong liquidity and transparency, making it a key benchmark in the high yield bond market.
- Investors face credit risk and possible price swings, especially during economic stress or market volatility.
- HYG delivers competitive yields near 6% with lower volatility compared to some peers, balancing income and risk.
- Comparing fees, yield, and diversification helps investors choose the right high yield ETF for their goals.
HYG ETF Overview

Image Source: pexels
What Is HYG?
The iShares iBoxx $ High Yield Corporate Bond ETF, known by its ticker HYG, stands as one of the most recognized high yield bond products in the market. HYG ETF gives investors access to a broad portfolio of high yield bonds. BlackRock manages this ETF, and it has become a benchmark for the high yield bond space. HYG tracks the Markit iBoxx USD Liquid High Yield Index, which includes a wide range of U.S. dollar-denominated high yield bonds. Investors often choose HYG ETF for its transparency, liquidity, and ease of trading on major exchanges.
HYG ETF launched in 2007 and quickly gained popularity among investors seeking high yield opportunities. Its large asset base and active trading volume make it a key player in the high yield market.
Key Features
HYG ETF offers several features that set it apart from other high yield bond products:
- Diversification: HYG holds hundreds of high yield bonds from various sectors. This broad exposure helps reduce the impact of any single issuer’s default.
- Liquidity: Investors can buy or sell HYG ETF shares throughout the trading day. This feature provides more flexibility than buying individual high yield bonds.
- Benchmark Role: Many investors and analysts use HYG as a reference point for the high yield bond market. Its price movements often reflect broader trends in high yield.
- Transparency: HYG ETF publishes its holdings daily, allowing investors to see exactly which bonds the fund owns.
- Pioneer Status: As one of the first high yield bond ETFs, HYG helped shape the development of the high yield bond space.
HYG ETF’s combination of size, liquidity, and transparency makes it a leading choice for those seeking exposure to high yield bonds. Investors use HYG to access the high yield market efficiently and to monitor trends in high yield bond prices.
High Yield Corporate Bond Market
Market Structure
The high yield corporate bond market includes a wide range of debt instruments issued by companies with lower credit ratings. Credit rating agencies such as S&P, Moody’s, and Fitch classify high yield bonds as sub-investment grade. These ratings fall below BBB for S&P, below Baa3 for Moody’s, and below BBB- for Fitch. Companies issue high yield bonds to raise capital when they cannot access investment grade financing.
High yield bonds usually offer higher fixed interest rates. Investors receive greater compensation for taking on more risk. These bonds are generally unsecured, which means they do not have collateral backing. In case of default, holders of high yield bonds have lower priority than senior debt holders. The market features several types of structures, including subordinated debt, unitranche debt, convertible bonds, and mezzanine financing.
Key factors shape the market structure. Credit risk, interest rates, and bond duration all influence pricing and yields. High yield bonds often have shorter maturities than investment grade bonds. Companies use these bonds in leveraged buyouts and mergers and acquisitions. The market experiences higher volatility and risk compared to investment grade corporate bonds. Investors must understand these risks before entering the high yield corporate debt market.
Note: High yield bonds provide higher returns but carry greater default risk. Investors should weigh the risk/return profile carefully.
HYG’s Market Share
HYG stock represents a significant portion of the high yield corporate bond market. The ETF holds about 2% of the total market value. This share gives HYG notable influence over liquidity and price discovery. When investors trade HYG, they affect the prices of the underlying high yield bonds. Large inflows or outflows in HYG can move the market, especially during periods of stress.
HYG’s size and trading volume help improve liquidity in the high yield market. Many investors use HYG as a benchmark for pricing and performance. The ETF’s transparency and daily reporting of holdings support price discovery. HYG’s presence allows investors to access high yield bonds efficiently, without buying individual securities.
The high yield corporate bond market remains less liquid than investment grade markets. HYG helps bridge this gap by providing a liquid vehicle for exposure. However, the ETF’s influence can also create challenges. Price-to-NAV gaps may widen during volatile periods, increasing trading costs. Investors should monitor HYG’s market share and its impact on the broader high yield market.
HYG Stock Performance
Image Source: unsplash
Historical Returns
HYG stock has delivered a consistent performance since its launch. Investors often look at annualized returns to measure how well an ETF tracks the high yield market. Over the past year, HYG achieved an annualized return of 9.29% when including dividends. Since its inception in 2007, the ETF has posted an annualized return of 4.96%. These figures show that HYG can provide steady yield for those seeking income from high yield bonds.
| Period | Annualized Return |
|---|---|
| 1 Year | 9.29% (including dividends) |
| Since Inception (2007) | 4.96% |
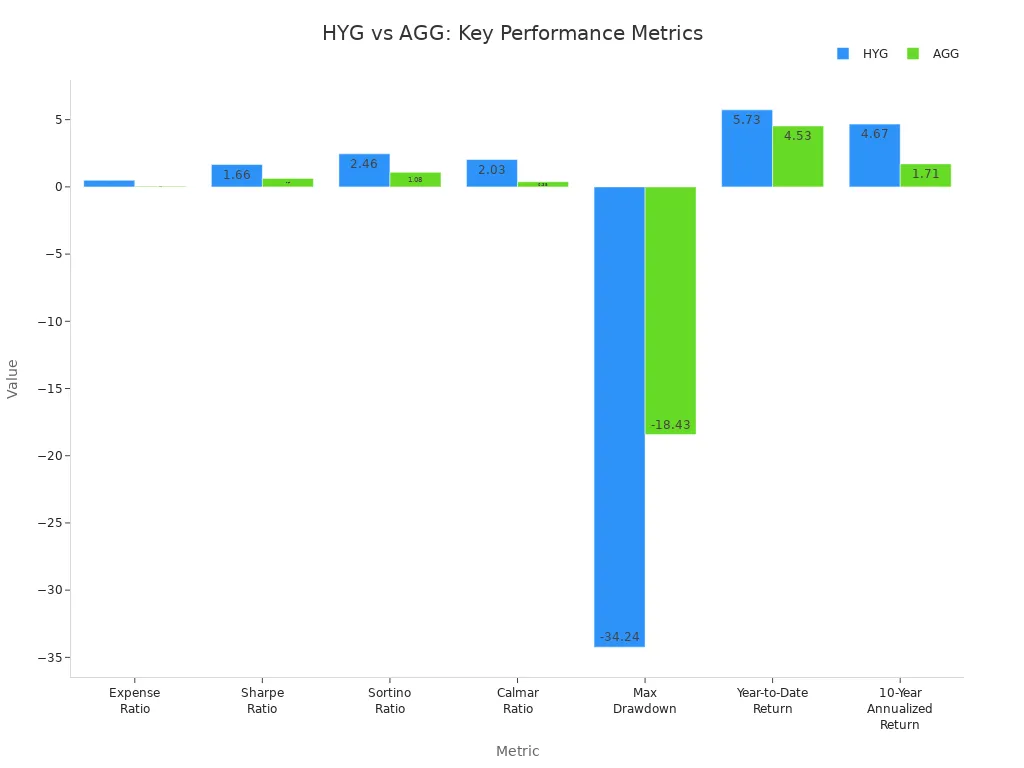
When compared to the broader high yield bond market, HYG stock has shown competitive results. Over the last ten years, HYG posted a 4.67% annualized return, outperforming the aggregate bond market, which returned 1.71%. The ETF’s year-to-date return stands at 5.73%, higher than many other fixed income options.
Investors should remember that past performance does not guarantee future results. High yield bonds can experience periods of both strong gains and sharp declines.
Volatility and Risk
HYG stock offers exposure to high yield bonds, which carry higher credit risk than investment grade bonds. Credit risk measures the chance that a bond issuer may default. HYG manages this risk by holding a diversified portfolio, but investors still face the possibility of losses if credit conditions worsen.
The ETF’s historical volatility stands at 0.70%, which is lower than some other high yield ETFs, such as HYHG, which has a volatility of 1.46%. This lower volatility means HYG experiences smaller price swings, making it less risky compared to some peers. However, the ETF has faced a maximum drawdown of -34.24%, showing that high yield investments can be sensitive to market stress and changes in credit conditions.
| ETF Symbol | Historical Volatility (%) |
|---|---|
| HYG | 0.70 |
| HYHG | 1.46 |
HYG’s risk-adjusted performance also stands out. The ETF’s Sharpe ratio of 1.66 and Sortino ratio of 2.46 indicate that it has delivered strong returns for the level of risk taken. Investors should weigh these factors when considering HYG for yield and credit exposure.
HYG Holdings and Diversification
Sector Breakdown
HYG offers investors broad diversification across many sectors. The fund holds a large number of high yield bonds from industries such as energy, healthcare, communications, and consumer goods. This sector allocation helps reduce the impact of any single industry downturn. For example, if the energy sector faces challenges, strong performance in healthcare or communications can help balance returns. HYG uses a rules-based approach to select bonds, which ensures that no sector dominates the portfolio. The fund reviews its holdings regularly to maintain this balance.
The table below shows a typical sector allocation for HYG:
| Sector | Percentage of Portfolio |
|---|---|
| Communications | 22% |
| Consumer Goods | 18% |
| Healthcare | 15% |
| Energy | 13% |
| Technology | 10% |
| Other Sectors | 22% |
Note: Sector weights may change over time as the fund rebalances its holdings.
Issuer Exposure
HYG limits exposure to individual issuers to manage risk. The fund holds bonds from hundreds of companies, which lowers the chance that one issuer’s default will hurt overall performance. Top issuers in HYG often include large, well-known companies that have issued high yield bonds to raise capital for growth or refinancing debt. The rules-based strategy prevents any single issuer from making up too much of the portfolio. This approach protects investors from concentration risk.
Investors benefit from HYG’s diversification because it spreads risk across many types of debt and industries. The fund’s structure allows for stable income while reducing the impact of credit events. HYG’s broad holdings make it a reliable choice for those seeking exposure to high yield bonds without taking on excessive risk.
HYG ETF Yield and Income
Dividend Yield
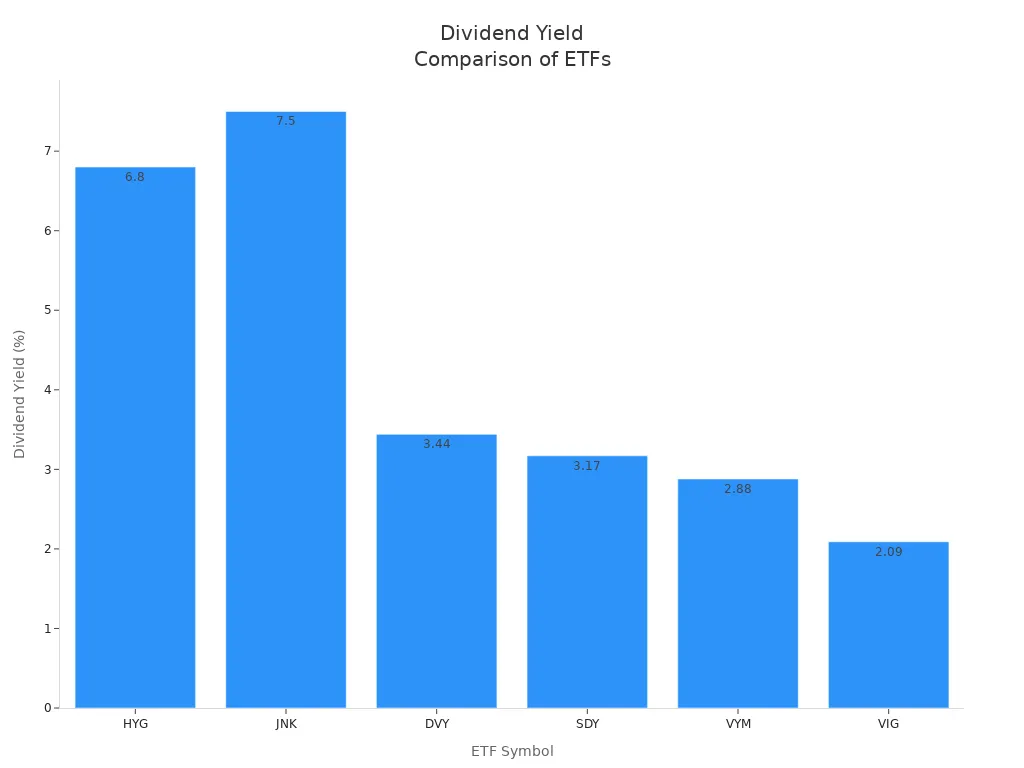
HYG offers investors a competitive yield in the high yield bond ETF space. The current dividend yield for HYG stands at 6.80%. This figure places HYG slightly below JNK, which provides a 7.50% yield, but well above traditional dividend stock ETFs. For comparison, DVY yields 3.44%, SDY yields 3.17%, VYM yields 2.88%, and VIG yields 2.09%. Investors seeking higher income often choose HYG for its attractive yield profile.
| ETF Symbol | Dividend Yield (%) |
|---|---|
| HYG | 6.80 |
| JNK | 7.50 |
| DVY | 3.44 |
| SDY | 3.17 |
| VYM | 2.88 |
| VIG | 2.09 |
HYG distributes income to shareholders through regular monthly payments. These distributions reflect the interest collected from the underlying high yield bonds. Investors who prioritize monthly income often find HYG appealing, as it provides a steady stream of cash flow.
Note: Dividend yields can fluctuate based on market conditions and changes in the underlying bond portfolio.
Distribution Trends
HYG has maintained a consistent record of income distributions since its inception. The fund pays out income monthly, which helps investors plan for regular cash needs. Over the past year, HYG’s monthly income distributions have remained stable, even during periods of market volatility. This stability comes from the fund’s diversified holdings and its focus on high yield bonds.
Investors should monitor the trend of HYG’s yield over time. Rising interest rates or changes in credit spreads can impact the amount of income generated. HYG’s monthly income may increase if yields in the high yield bond market rise, but it can also decrease if bond prices fall or defaults increase. The fund’s transparency allows investors to track distribution history and anticipate future income.
Technical Factors
Liquidity
Liquidity plays a crucial role in the high yield bond market. Investors often choose the HYG ETF because it offers higher liquidity than most other high yield bond ETFs. Liquidity means investors can buy or sell shares quickly without causing large price changes. HYG ETF stands out with an average daily trading volume of over 34 million shares. This figure is much higher than other funds, such as the Invesco Senior Loan ETF, which trades about 7.7 million shares daily.
| ETF Symbol | ETF Name | Average Daily Trading Volume (Shares) |
|---|---|---|
| HYG | iShares iBoxx $ High Yield Corporate Bond ETF | 34,535,445 |
| BKLN | Invesco Senior Loan ETF | 7,780,364 |
High trading volume helps keep the bid-ask spread tight. This means investors pay less when entering or exiting positions. HYG ETF’s strong liquidity also supports price discovery in the high yield market. Many investors use HYG as a tool to gauge market sentiment and to manage risk during volatile periods.
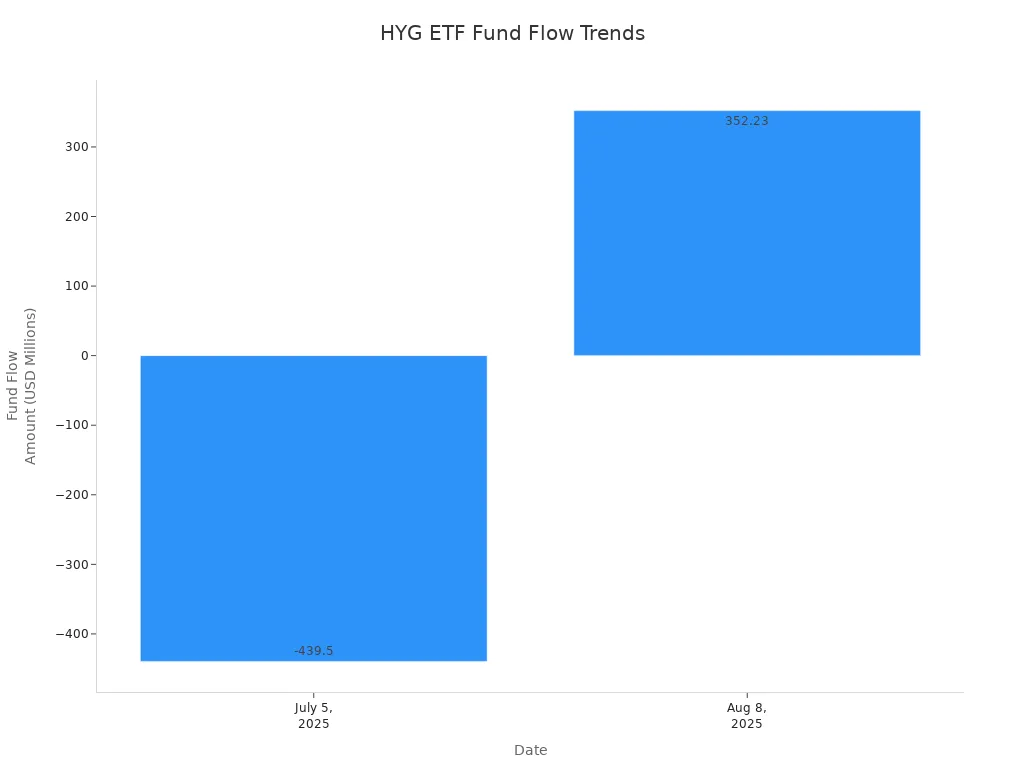
Fund Flows
Fund flows show how much money investors add or withdraw from an ETF. HYG ETF often acts as a barometer for investor confidence in high yield corporate bonds. Recent trends reveal a mix of inflows and outflows, reflecting changing investor sentiment. In early July 2025, HYG saw outflows of about $439.5 million, even though it posted modest gains for the year. This suggests investors took profits or rebalanced their portfolios rather than leaving the high yield market completely.
In August 2025, HYG ETF attracted $352.23 million in new investments. This inflow points to renewed demand for high yield income, even as investors remain cautious about interest rates and risk. The table below summarizes recent fund flows and investor sentiment:
| ETF / Date | Fund Flow Amount | YTD Return | Investor Sentiment / Interpretation |
|---|---|---|---|
| HYG (Aug 8, 2025) | +$352.23M | ~2.00% | Selective demand for high-yield income amid rate uncertainty and low yields; cautious optimism |
| HYG (July 5, 2025) | -$439.5M | 2.03% | Tactical profit-taking or portfolio rebalancing amid fragmented risk appetite |
These fund flow patterns highlight how investors balance their search for yield with risk management. HYG ETF’s activity often signals broader trends in the high yield bond market.
HYG vs Other High Yield Bond ETFs
Performance Comparison
Investors often compare HYG with other leading high yield bond ETFs, such as USHY and JNK, to evaluate which fund best fits their needs. Each ETF offers a unique mix of yield, risk, and diversification. HYG has delivered a 3.3% gain over the past year, which stands slightly ahead of USHY and JNK over similar periods. USHY provides the highest dividend yield at 6.82%, while JNK follows with 6.57%. HYG’s yield is competitive at 5.91% based on trailing 12-month data.
The table below summarizes key metrics for these ETFs:
| ETF | Dividend Yield | Expense Ratio | Beta | Recent Gain | Number of Holdings | POWR Rating | Notes |
|---|---|---|---|---|---|---|---|
| HYG | 5.91% | 0.49% | 0.92 | +3.3% (1 year) | 1,257 | A (Strong Buy) | Solid buy rating; more holdings than JNK |
| USHY | 6.82% | 0.08% | 0.86 | +2.9% (9 months) | 1,888 | A (Strong Buy) | Highest yield; lowest expense ratio |
| JNK | 6.57% | 0.40% | 0.92 | +2.5% (9 months) | 2,350 | A (Strong Buy) | Most holdings; balanced profile |

USHY stands out for its higher yield and lower risk, as shown by its lower beta. JNK offers the largest number of holdings, which can help with diversification. HYG maintains a strong buy rating and a solid performance record, making it a reliable choice for many investors.
Investors should review each ETF’s risk and return profile before making a decision.
Fees and Expenses
Expense ratios play a key role in long-term returns. HYG charges a 0.49% expense ratio, which is higher than many competitors. JNK’s expense ratio is 0.40%, while USHY offers a much lower cost at 0.08%. Other funds, such as the Schwab High Yield Bond ETF (SCYB), charge as little as 0.03%. Lower fees can help investors keep more of their returns over time.
| ETF Name | Expense Ratio |
|---|---|
| iShares iBoxx $ High Yield Corporate Bond ETF (HYG) | 0.49% |
| SPDR Bloomberg High Yield Bond ETF (JNK) | 0.40% |
| iShares Broad USD High Yield Corporate Bond ETF (USHY) | 0.08% |
| Schwab High Yield Bond ETF (SCYB) | 0.03% |
| VanEck Fallen Angel High Yield Bond ETF (ANGL) | 0.35% |
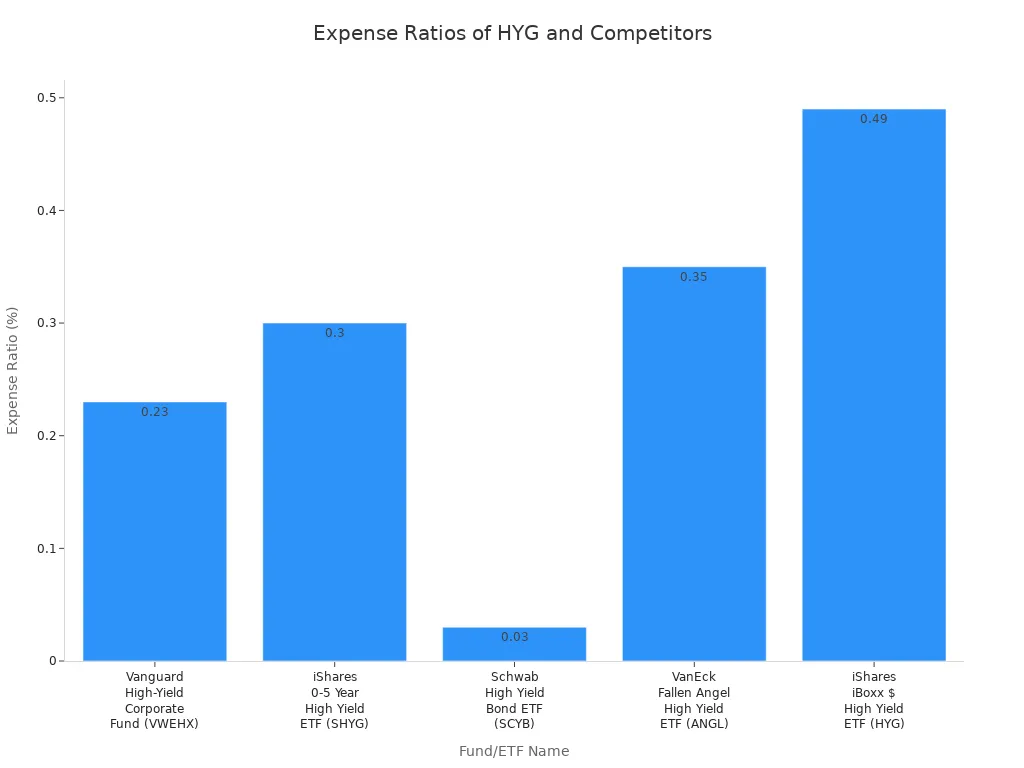
The Fidelity Enhanced High Yield ETF (FDHY) also offers a lower expense ratio at 0.35%, about 30% less than HYG. Over time, these differences in fees can add up, especially for investors focused on maximizing net returns.
Note: Investors should weigh both performance and costs when selecting a high yield bond ETF. Lower expenses can enhance returns, but yield, liquidity, and diversification remain important factors.
ESG and Geographic Exposure
ESG Considerations
HYG ETF does not use environmental, social, or governance (ESG) criteria when selecting bonds for its portfolio. The fund tracks the Markit iBoxx USD Liquid High Yield Index. This index follows a rules-based approach and includes U.S. dollar-denominated high yield corporate bonds. The portfolio composition depends only on the index rules. ESG screening or integration does not play a role in the selection process. Investors who want ESG-focused investments may need to consider other funds that apply these standards.
Investors should note that HYG’s lack of ESG criteria means the fund may include issuers with varying environmental or social practices. This approach can affect the overall risk profile for those who prioritize responsible investing.
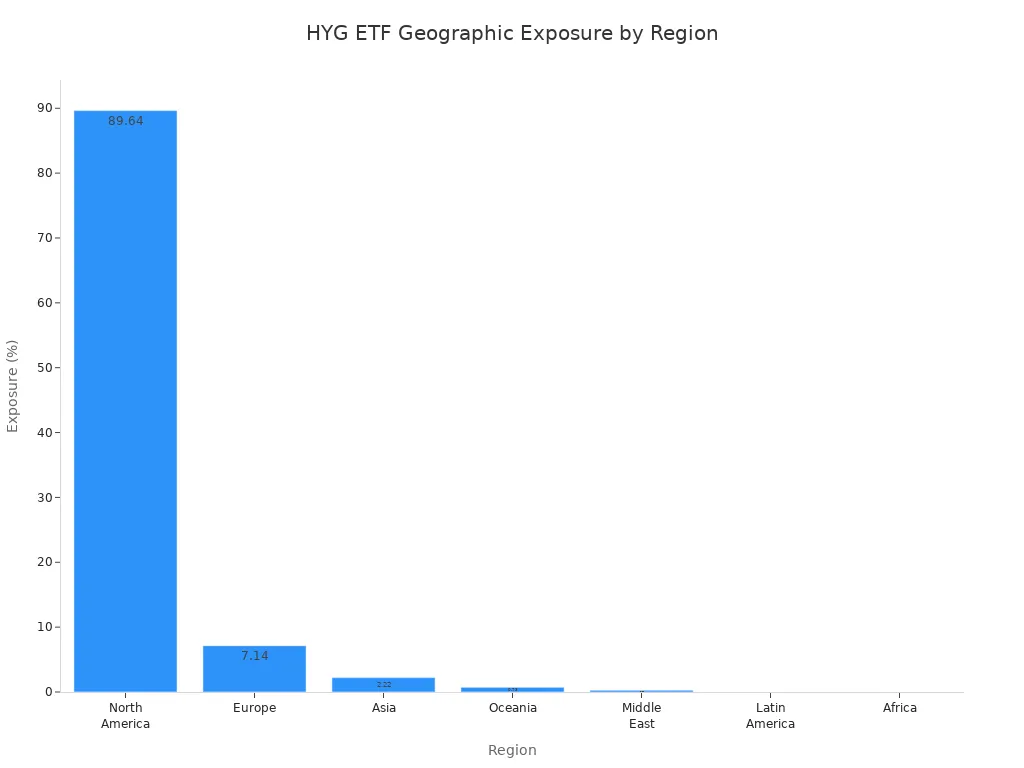
U.S. Focus
HYG ETF holds a strong geographic concentration in North America, especially the United States. The fund allocates about 89.64% of its assets to North American issuers. Exposure to other regions remains limited. Europe accounts for roughly 7.14%, Asia for 2.22%, and Oceania for 0.73%. The Middle East makes up only 0.28%. The fund has no exposure to Latin America or Africa. This focus sets HYG apart from some global high yield bond ETFs that diversify across more regions.
| Region | Geographic Exposure (%) |
|---|---|
| North America | 89.64 |
| Europe | 7.14 |
| Asia | 2.22 |
| Oceania | 0.73 |
| Middle East | 0.28 |
| Latin America | 0.00 |
| Africa | 0.00 |
A U.S.-centric approach can help investors who want to focus on the American high yield market. However, it may limit diversification benefits that come from broader global exposure. Investors should consider their own geographic preferences and risk tolerance when evaluating HYG ETF.
HYG ETF stands as a benchmark in the high yield corporate bond market, offering strong liquidity, broad diversification, and reliable income. Investors benefit from its large asset base, competitive yield near 6%, and lower volatility compared to peers.
Key takeaways for investors:
- HYG provides diversified exposure to U.S. high yield bonds with monthly income distributions.
- The ETF carries meaningful credit risk and elevated default rates, especially during economic stress.
- Lower fees and broad sector coverage make HYG attractive versus alternatives with higher costs or limited diversification.
To incorporate HYG into a portfolio, investors should combine it with other fixed income ETFs, use disciplined rebalancing, and monitor macroeconomic signals for risk management.
FAQ
What types of bonds does HYG hold?
HYG holds high yield corporate bonds. These bonds come from companies with lower credit ratings. The fund includes bonds from many sectors, such as energy, healthcare, and communications.
How often does HYG pay income to investors?
HYG pays income monthly. Investors receive distributions based on the interest earned from the underlying high yield bonds in the fund.
Is HYG suitable for risk-averse investors?
HYG carries higher risk than investment grade bond funds. Investors face credit risk and price swings. Those seeking safety may prefer funds with higher-rated bonds.
Can investors buy HYG through Hong Kong banks?
Yes, many Hong Kong banks offer access to U.S.-listed ETFs like HYG. Investors should check with their bank for availability and trading fees in USD. See current USD exchange rates.
Does HYG use ESG criteria when selecting bonds?
HYG does not use ESG criteria. The fund tracks an index based on credit ratings and liquidity, not environmental, social, or governance factors.
The analysis of HYG stock shows that even with a stable bond investment, efficiency and cost matter. For investors outside the U.S., such as those in Hong Kong, the hassle of cross-border transactions, currency conversion, and high remittance fees can erode your returns.
BiyaPay is designed to solve this problem by offering a streamlined global financial solution that lets you participate in US and Hong Kong stocks from a single platform, without needing an overseas bank account. Our service supports seamless conversion between various fiat and digital currencies and offers a low remittance fee of just 0.5%, ensuring your capital flows efficiently and securely. Check our real-time exchange rate converter to see your potential savings. Register now to experience more convenient and cost-effective global investing, and secure your stable income stream.
*This article is provided for general information purposes and does not constitute legal, tax or other professional advice from BiyaPay or its subsidiaries and its affiliates, and it is not intended as a substitute for obtaining advice from a financial advisor or any other professional.
We make no representations, warranties or warranties, express or implied, as to the accuracy, completeness or timeliness of the contents of this publication.


Contact Us
Company and Team
BiyaPay Products
Customer Services


is a broker-dealer registered with the U.S. Securities and Exchange Commission (SEC) (No.: 802-127417), member of the Financial Industry Regulatory Authority (FINRA) (CRD: 325027), member of the Securities Investor Protection Corporation (SIPC), and regulated by FINRA and SEC.
registered with the US Financial Crimes Enforcement Network (FinCEN), as a Money Services Business (MSB), registration number: 31000218637349, and regulated by FinCEN.
registered as Financial Service Provider (FSP number: FSP1007221) in New Zealand, and is a member of the Financial Dispute Resolution Scheme, a New Zealand independent dispute resolution service provider.