- EasyCard
- Trade
- Help
- Announcement
- Academy
- SWIFT Code
- Iban Number
- Referral
- Customer Service
- Blog
- Creator
Chasing highs and selling lows? The secret to outperforming the market! How strong is the SPMO momentum strategy?


There is a momentum strategy of “chasing highs and killing lows” that has outperformed the S & P 500 for many years in a row! Why can this seemingly risky strategy surpass the market for many years? What kind of investment wisdom is hidden behind it?
Next, let’s take a closer look at the S & P 500 Momentum ETF, also known as SPMO. See how it uses momentum strategy to select the strongest performing stocks in the past 12 months, helping investors follow market trends and achieve investment returns that exceed the market.

Whether it is a large rise in a bull market or a small retracement in a bear market, SPMO can consistently outperform the market in a competitive market with its flexible strategy.
So, how does SPMO achieve this goal? Let’s explain it from three aspects.
Introduction and Operation Principle of SPMO
Introduction to SPMO
SPMO, short for The Invesco S & P 500 Momentum ETF, was launched by Invesco in 2015. It is also an index fund that mainly tracks the S & P 500 Momentum Index, also known as the S & P 500 Momentum Index.
SPMO operation principle
Invesco S & P 500 Momentum ETF is based on the S & P 500 Momentum Index. The fund typically invests at least 90% of its total assets in the securities that make up the index, tracking the performance of stocks with high “momentum scores” in the S & P 500 index.
Funds and indices are restructured and rebalanced twice a year on the third Friday of March and September. Constituent Stocks are weighted by market capitalization and momentum scores, and the core is to understand the momentum strategy and the compilation of the S & P 500 Momentum Index.
Introduction to Momentum Strategy
Momentum strategy is an investment strategy based on market price trends. The core idea is that assets that have performed well in the past may continue to perform well in the future, while assets that have performed poorly may continue to be sluggish. This strategy uses market inertia to follow stock price trends in order to achieve returns that exceed the market. Its basic principle is as follows:
1. Trend sustainability
Its basic assumption is that strong stocks, which means stocks that have performed well in the past, are more likely to continue to rise in the future, while weak stocks, which have performed poorly in the past, are likely to continue to fall. Market prices often maintain a certain inertia, and short-term gains or losses will continue for a period of time.
2. Behavioral Finance :
Momentum strategy is not only based on the statistical laws of the market, but also involves the principles of behavioral finance. For example, investors may push up the price of popular stocks due to emotional or psychological factors, leading to a continuation of price trends.
3. Technical Analysis and Fundamental Analysis :
Momentum strategies usually rely more on technical analysis, which predicts future trends through historical data such as price and trading volume, and pay less attention to fundamental factors of stocks, such as company financial reports.
S & P 500 Momentum Index
Index range: Mainly select S & P 500 index Constituent Stocks as the basis, select the top 20%, which is 100 Constituent Stocks.
Calculation of Momentum Value:
Standard momentum value (12-month price change):
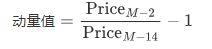
Among them:
Price (M-2): Closing Price from 2 months ago.
Price (M-14): Closing Price from 14 months ago.
Calculation of risk-adjusted momentum value:
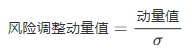
Among them:
Momentum value: The momentum value calculated earlier.
Sigma is the Standard Deviation of the daily rate of return during the corresponding period, used to measure volatility.
Filtering and ranking:
Ranking all Constituent Stocks based on risk-adjusted momentum values, selecting the top 20% of stocks to enter the candidate pool. Using the 20% buffer rule, existing Constituent Stocks are preferentially retained within the top 120% of the current Constituent Stock momentum ranking to reduce frequent stock swaps and maintain index stability.
Momentum value reflects the price performance of a stock over a period of time. Positive values represent an increase in stock price, while negative values represent a decrease. Risk-adjusted momentum value further adjusts the momentum value to consider the volatility of the stock, ensuring that high-volatility stocks do not unreasonably occupy high rankings due to large price changes. When rebalancing every quarter or half year, adjust the Constituent Stock based on the latest momentum value and ranking, and apply buffer rules to reduce the frequency of stock swaps.
Through this process, the S & P 500 Momentum Index can continuously track the best-performing momentum stocks while avoiding frequent changes in Constituent Stocks due to short-term fluctuations, thereby improving the stability and investment value of the index.
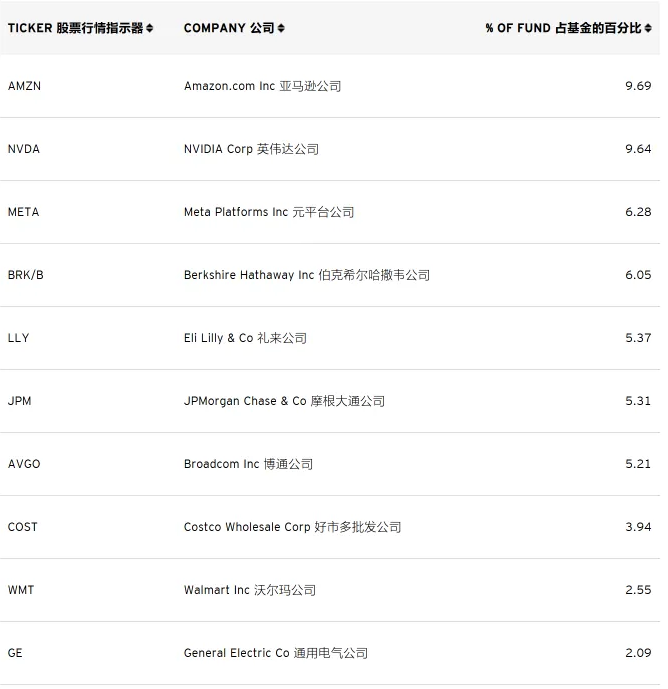
SPMO position
The total position of SPMO is 100, and the top 10 positions account for as much as 55.32%. It is relatively concentrated, focusing on popular companies in the market such as Amazon, NVIDIA, and META, and does not hold Apple, Microsoft, Goole, or Tesla.
Industry configuration
From an industry perspective, it is concentrated in industries such as finance, information technology, consumer goods, industry, and healthcare. Compared to the S & P 500, due to not holding Apple, Microsoft, or Google, the proportion of information technology holdings is relatively low.
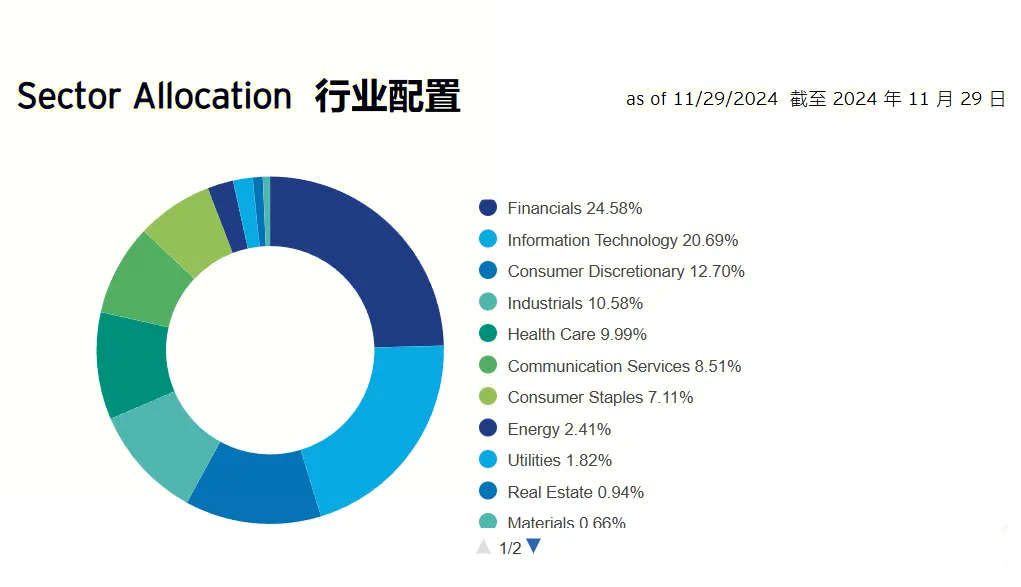
SPMO passively tracks the S & P 500 Momentum Index. Its positions are allocated based on the momentum principle of the S & P 500 Momentum Index, with positions concentrated in popular financial and technology stocks, which is more in line with the current market style.
Analysis of SPMO revenue and risk resistance
Earning capacity
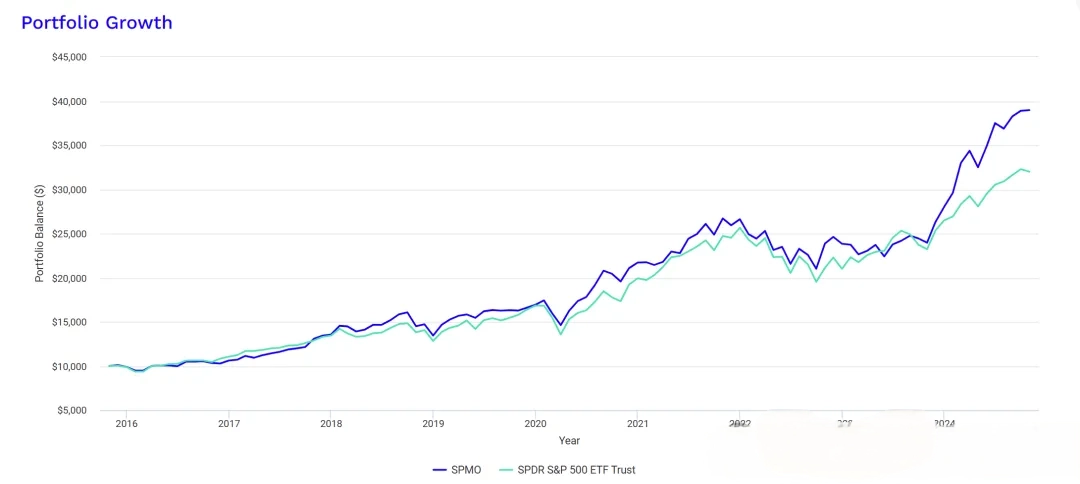
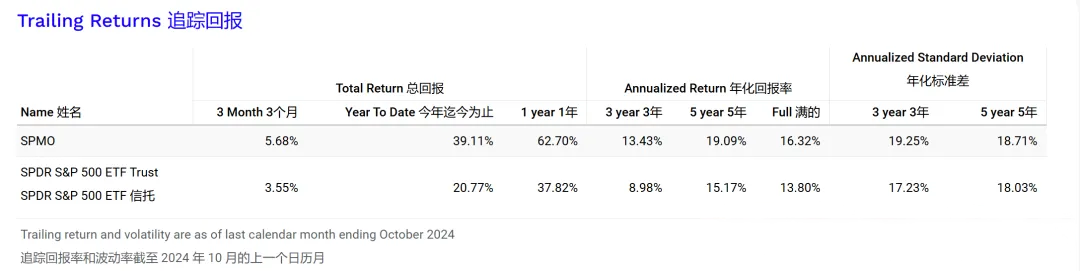
By comparing the growth curves, annual revenue charts, and annualized revenue charts of SPMO and SPY below, it can be found that most of the time SPMO’s revenue ability is better than SPY’s. This year, in the past 1 year, 3 years, and 5 years since its establishment, SPMO’s revenue has outperformed SPY’s.
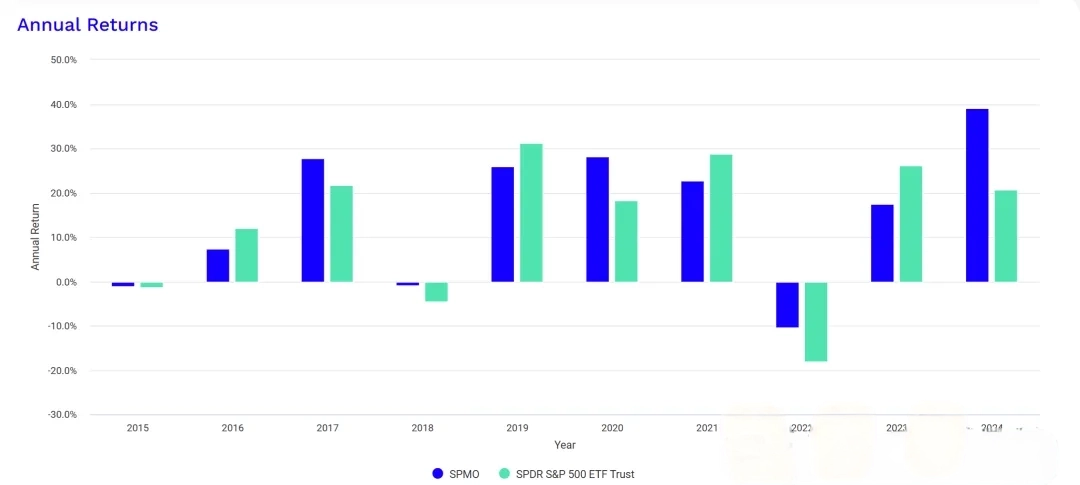
Even in the poor market conditions of 2018 and 2023, SPMO’s earnings performance has a significant advantage over SPY, especially in the past year, SPMO’s earnings have significantly outperformed SPY, with a terrifying yield of 62.7%.
SPMO vs SPY growth curve comparison :
SPMO vs SPY Annual Earnings Comparison :
Annualized return on SPMO vs SPY :
Risk resistance
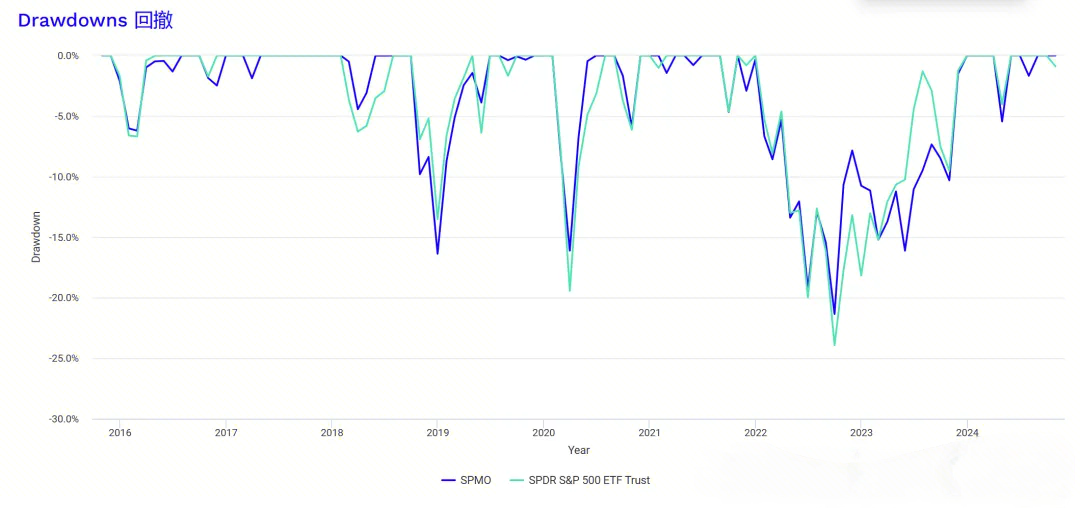
Compare the drawdown curves, Standard Deviation, maximum drawdown, Sharpe Ratio, profit-loss ratio, Beta and other indicators of SPMO and SPY below. Compared with SPY, SPMO has slightly higher volatility and smaller drawdown, higher investment cost-effectiveness, and overall risk resistance is not much different from SPY, even better.
SPMO vs SPY drawdown curve :
Size, expense ratio and dividend and payout frequency :
The latest size of SPMO is about 4.13 billion US dollars, the overall scale is moderate, the trading volume is also good, there is no need to worry about this, the management fee is 0.13%, the overall average, the dividend yield is only 0.44%, the dividend yield performance is relatively general, the dividend distribution frequency is the market average level, distributed quarterly.
Pros and Cons of SPMO and Suitable People
Advantages of SPMO
1. Catch the strong stocks in the market : SPMO adopts momentum strategy, focusing on those stocks that have performed the strongest in the past, usually these stocks have strong upward potential in the future.
2. Based on Data Drive : By selecting the best performing S & P 500 Constituent Stocks in the past 12 months, SPMO eliminates subjective judgment and selects stocks based entirely on historical data and market performance.
3. Reduce risk exposure : Momentum strategy can reduce the risk exposure of the investment portfolio by avoiding stocks with poor performance. Especially during market fluctuations, SPMO will be relatively stable.
4. Strong adaptability : As the market environment changes, SPMO will automatically adjust its Constituent Stock, maintain the capture of market hotspots, and flexibly respond to different economic cycles.
Disadvantages of SPMO
1. The chasing strategy has a high risk of retracement : Momentum strategy relies on past performance and may choose some overheated stocks at the top of the bull market or when the market is overly optimistic, with the risk of significant retracement.
Although SPMO has not experienced significant drawdowns in its history, with a history of less than 10 years and the potential drawdowns of this strategy itself, a high drawdown is not impossible.
2. May miss value stocks : SPMO mainly focuses on stocks that perform well in the short term, ignoring those value stocks with good fundamentals but mediocre short-term performance, and may miss some long-term growth opportunities.
3. Frequent stock swaps, which may increase transaction costs : Momentum strategies typically require a higher frequency of stock swaps, which may result in higher transaction costs and tax burdens, especially for short-term investors.
4. When the market volatility is high, the performance is volatile : When the market falls rapidly, SPMO may be subject to greater fluctuations, especially some momentum stocks may suffer greater losses in the market downturn.
5. Strong dependence on market trends : Momentum strategy is highly dependent on the sustained trend of the market. If the market trend suddenly reverses, SPMO may face greater losses.
Suitable for people
1. Investors with strong risk tolerance: Momentum strategies are suitable for investors who can withstand higher volatility and hope to obtain excess returns by catching strong stocks in the market.
2. Investors who like short-term trading: Momentum strategies require a high frequency of stock swaps, so they are suitable for investors who prefer short-term investments and are willing to adjust their investment portfolios frequently.
3. Investors who like right-side trading: In the case of obvious market trends, momentum strategies can give full play to their advantages, so they are suitable for investors who believe in market trends and are willing to follow the trend.
How to invest
For investors who pursue convenient fund management, BiyaPay is a professional platform that integrates Jimei stock, Hong Kong stock trading, and deposit and withdrawal services, perfectly meeting diverse investment needs. Whether it is hedging market risks or pursuing high returns and asset diversification, BiyaPay is your ideal choice.
Through BiyaPay, you can quickly recharge digital currency and exchange it for US dollars or Hong Kong dollars, and then conveniently withdraw it to your personal bank account, easily configuring high-quality assets such as SPMO. SPMO adopts momentum strategy, focusing on strong market stocks, which can help you seize short-term excellent opportunities while flexibly responding to market fluctuations.
BiyaPay has fast deposit speed and no limit on credit limit, allowing you to allocate funds at any time and seize market growth opportunities in a timely manner. Whether it is configuring high-quality assets such as SPMO or realizing global fund management, it can make your investment more efficient and convenient, help you balance returns and risks, and steadily increase returns.
SPMO not only outperforms the market significantly in a bull market, but also outperforms the market in terms of drawdowns and returns in a bear market, which is indeed worth understanding. However, the core reason is that the US stock market is a long bull market, and companies that perform well often have higher valuations, and strong stocks will continue to rise.
SPMO follows these trends and uses “chasing the rise” to obtain excess returns. Moreover, the US stock market is relatively efficient, and information is quickly reflected in stock prices. Strong stocks attract funds and continue to rise; poor-performing stocks will quickly fall and be removed from the index. By using “sell-off” to eliminate disadvantaged companies, it ensures that only high-quality companies are purchased.
As a US stock market offensive strategy, SPMO can be a powerful tool to help you stand out in the rising tide of the market when the US stock market is in an offensive trend.
Of course, the current market is very hot, and the timing of SPMO allocation still needs to be cautious. The market can sometimes be too optimistic. It is more prudent to wait for the market to adjust or have clearer investment opportunities before taking action. Everyone should pay attention to reasonable risk allocation.
*This article is provided for general information purposes and does not constitute legal, tax or other professional advice from BiyaPay or its subsidiaries and its affiliates, and it is not intended as a substitute for obtaining advice from a financial advisor or any other professional.
We make no representations, warranties or warranties, express or implied, as to the accuracy, completeness or timeliness of the contents of this publication.


Contact Us
Company and Team
BiyaPay Products
Customer Services


is a broker-dealer registered with the U.S. Securities and Exchange Commission (SEC) (No.: 802-127417), member of the Financial Industry Regulatory Authority (FINRA) (CRD: 325027), member of the Securities Investor Protection Corporation (SIPC), and regulated by FINRA and SEC.
registered with the US Financial Crimes Enforcement Network (FinCEN), as a Money Services Business (MSB), registration number: 31000218637349, and regulated by FinCEN.
registered as Financial Service Provider (FSP number: FSP1007221) in New Zealand, and is a member of the Financial Dispute Resolution Scheme, a New Zealand independent dispute resolution service provider.